共同基金風格飄移分析 - 政大學術集成
32
0
0
全文
(2) Style drift on the Mutual Funds. Student:Pei-Chun Chen. Advisor:Prof. Wei-Yu Kuo. Department of International Business National ChengChi University. 立. 治 政 Abstract 大. We provide an introduction to utilize the return based style model of. ‧ 國. 學. Sharpe (1992) to analyze the style drift of mutual fund managers in Taiwan in. ‧. practice. Often the investment style is assumed to be constant through time. sit. y. Nat. but it actually is dynamic. We use rolling regressions to estimate the style. io. al. er. exposures and calculate style drift score (Idzorek & Bertsch 2004) to produce the allocated maps. We can clearly see the changing process over time by the. n. iv n C maps. SDS provides a single quantitative of style drift over the h e n g cmeasure hi U sample period because earlier research has only provided a qualitative method to approximately estimate.. Brown and Harlow (2002) conclude that there is a positive relationship between investment style consistency and performance but in our sample the relation between score and fund performance is not obvious.. 2.
(3) 共同基金風格飄移分析 學生:陳沛鈞. 指導教授:郭維裕 老師. 政治大學國際經營與貿易學系研究所. 摘要. 立. 政 治 大. ‧ 國. 學. 我們利用 Sharpe(1992)所提出的 return-based 模型來分析台灣經理人的風格遷移狀 況。基金經理人的投資風格在分析面上,通常假設是定態不變的,意即不隨時間改變而. ‧. 變化。但是事實上,這是一個動態改變的過程。基金投資說明書上常常明定此基金經理. y. Nat. io. sit. 人限制投資在哪類型的股票,但是基金經理人有可能依照不同的市場情況以及時機,從. n. al. er. 原先偏向小型股的經理人,轉而變成投資大型股的經理人。我們用 rolling-window 迴歸. Ch. i Un. v. 式的係數結果來估計風格以及計算參考 Idzorek & Bertsch (2004)的風格遷移分數來為台. engchi. 灣一般共同基金經理人締訂一個比較指標,我們也利用計算出的風格係數畫出資產權數 分配圖,經由此圖,我們亦可以觀察到基金經理人投資風格隨著時間經過的整個改變過 程。風格遷移分數提供我們一個量化的方法來衡量風格遷移的現象,因為較早的研究文 獻只有提供一個質化的圖型做大約的估計,因此這個風格分數提供了我們一個很好的輔 助工具,將質化的圖形輔以量化的分數做整合搭配比較。 根據 Brown and Harlow (2002)的結論,基金經理人投資風格的一致性以及基金表現 績效有正相關的關係,意即當基金經理人的投資風格越一致,基金的表現就會越好,但 是在我們的數據裡面這個關係並不顯著。. 3.
(4) 論文謝詞. 此篇論文的完成,首先要感謝我的指導老師---郭維裕教授,在寫作過程中用 心的指導以及鼓勵,在論文付梓的背後有著更多看不到的老師的愛與耐心和關 懷。 也要感謝政治大學金融系的教授陳威光老師以及中央大學財金系教授徐政 義老師百忙之中抽空來擔任口試委員,提供本論文諸多寶貴的意見,學生獲益良 多。. 立. 政 治 大. ‧ 國. 學. 最後,還要感謝我最親愛的家人和朋友們,在我就讀研究所寫論文期間給予. ‧. 我的支持和陪伴,這篇論文是因為有他們才得以如期完成。. sit. y. Nat. al. n. 都寫進心裡。. er. io. 政大的好風光伴我兩年,其間要感謝的人事物還有好多好多,沒寫在這裡的,也. Ch. engchi. i Un. v. 4.
(5) 目錄 1 .Introduction …………………………………………………............6 2. Literature Review ……………………………………………………9 3. Data …………………………………………………………………12 4. Methodology ……………………………………………………….16 4-I.. Relation to Multifactor Models ……………………………16. 4-II. Sharpe’s model for Return-Based Style Analysis ……….17. 政 治 大 A Rolling Window Method ………………………………...21 立. 4-III. A Six Asset Class Model …………………………………..20 4-IV.. ‧ 國. 學. 4-V. Style Drift Score …………………………………………….22 5. Result ……………………………………………………………….23. ‧. 6. Conclusion …………………………………………………………28. n. al. er. io. sit. y. Nat. 7. Reference ………………………………………………………….31. Ch. engchi. i Un. v. 5.
(6) 1. Introduction. Classification of mutual funds according to their style or pattern has been applied in the United States for several years. Mutual funds are usually classified by its their investment objectives or the type of securities in which they invest so analysts can evaluate the performances of a mutual fund by its classification to where it belongs and investors can also select the fund which is the most appropriate to meet their investment needs. Equity funds range from “aggressive funds” such as High-Growth funds to “income-based funds”. 治 政 like High-Yield Funds or High-Quality Bond Funds. 大Such fund classifications 立 are omnipresent. But sometimes, the investment style of a mutual fund is hard ‧ 國. 學. to distinguish from its name for an investor who is not familiar with the. ‧. philosophy of the fund group or his manager’s behavior.. sit. y. Nat. Not knowing actually the fund we invested in is at all. The definition and. io. al. er. guidance for the same style sometimes varies slightly from country to country. For example, firm size with 500,000,000 in dollar is only classified as small. n. iv n C company or small stocks in U.S.,hbut it might belong e n g c h i U to medium size in Taiwan so does the classification of daily trading volumes in two countries. From the perspective of individual manager, they might have different opinions toward the same company or stock. One might consider that is a value stock, but the other would possibly think that is a growth stock. This can also happen to define the firm size. One can identify it as a small company, however, the other feels like medium company.. Generally, a fund manager has a lot of. discretions to temporally deviate his style to hold the stocks not conforming to his investment objective and investment policy. This action is called “style drift”. 6.
(7) Therefore, even we can pick up the wanted fund by its policy or its name, it cannot be sure that manager will have the same type of classification as we though. And it also cannot be guaranteed that the manager won’t change his investing behaviors over time accompanied with varying market and economic conditions. The possible reason why the mutual fund has a misleading name or objectives is to dim the investor’s perception of manager’s deviated strategy when he takes more risky assets in order to derive higher returns. There is an interesting result from Cooper, Gulen, and Rau (2005), they find that the year after a fund changes its name to reflect a current hot style, the fund. 治 政 experiences an average cumulative abnormal flow大 of 28%, with no 立 improvement in performance. The increase in flows is similar across funds ‧ 國. 學. whose holdings match the style implied by their new name and those whose. ‧. holdings do not, suggesting that investors are irrationally influenced by. y. Nat. cosmetic effects. Concerned to this problem so far, it still lacks an uniform. al. er. io. sit. criteria to evaluate whether these fund managers’ styles are consistent or not for a local investor to follow not alone the difficulties for a global investor to. n. iv n C judge. There doesn’t exist standard to discipline or punish managers h erules ngchi U when they don’t obey their policy.. Classification of Mutual funds in Taiwan is quite obscure. We often see the misleading results by comparing the performance with rather different categorized mutual funds together on some websites. For example, compared and ranked the performance of growth funds to value funds together that are built in the distinct investing philosophy and group may mislead investors’ judgment about the risk-to-reward relationship. We find the situation in Taiwan is rampant that investing websites or financial reports delivered from institutions to the public usually misclassify general equity mutual funds whose 7.
(8) targets can be small, medium and large stocks as the same level as ones investing in only small-cap or only mid-cap equity funds. Based on the theory, growth funds should have higher returns than the latter because of higher beta. If ranking them simply against the return factor, it loses the objectiveness, effectiveness and meaningfulness in sequence. As DiBartolomeo &Witowski (1997) phrase it: The easiest way to win a contest for the largest tomato is to paint a cantaloupe red and hope the judges do not notice. Another problem in Taiwan is investors sometimes ignored the phenomenon that some mutual funds might change its manager frequently. 治 政 when it had under-average performance in the short 大run or the fact that its 立 operating manager was different from the specified manager who is titular ‧ 國. 學. when the fund initiated. Team-managed funds are more prone to have style. ‧. drift problem. These components all contributed to a fund pursues a different. sit. y. Nat. style than advertised.. io. al. er. Based on Hardy (2003), investors can obtain a qualitative perception from style maps and rolling-window asset allocation figures, which demonstrate the. n. iv n C evolution of a manager’s style and have hopes to detect the h ewen might gchi U. misleading. However, this method doesn’t offer us a quantitative measure of style drift. Hence, in order to quantify this abbreviation through simply analyzing a fund manager’s historical return, Idzorek and Bertsch (2004) shed the light on the style drift score to measure the extent of style drift, providing investors a complementary tool to screen the quality, quantity and consistency regarding to fast-growing numbers of manager, meanwhile, monitor the manager’s style on the invested mutual fund. The purpose of this paper is to provide investors in Taiwan a technique to determine and monitor their investments in mutual funds by applied the 8.
(9) rolling-window method (Hardy[2003]) and style drift score(Idzorek and Bertsch [2004]) based on the return-based model (see Sharpe[1992]) which only requires a time-series of historical fund returns and is usually easy to get comparing to other models such as characteristic-based model(Daniel, Grinblatt, Titman and d aWermers[1997]). Because up-to-date holdings of mutual funds are often no available, characteristic-based style analysis leads to poor information. This makes return-based style analysis the more popular approach to pursue. First, to examine the application with respect to the fund. 治 政 miss-specification phenomenon, we consider 30 domestic-equity mutual funds 大 立 that their investing periods exceed 10 years and using rolling window ‧ 國. 學. regression. In the second part, we calculate style drift score and drawing the. Nat. 2. Literature Review. io. al. er. sit. y. ‧. allocated weights maps over time. Finally, we conclude.. n. iv n C The number of mutual funds fast over the last decade. hhas e nincreased gchi U Despite the fact that general performance of mutual funds managers have poor performance, investors have increased their demand for investment management; see Gruber (1996). Different needs of investors are reflected by in the different investment objectives. In the foreign countries, a large part of the funds describe its style rather properly through its name. However, in Taiwan, a substantial part of funds have misleading names, obscure investment objectives, or pursue a different style than advertised. A tool introduced by Sharpe(1992) might be appropriate to obtain a first insight of historical exposures of mutual funds. Sharpe(1992) contributes a great model 9.
(10) that investors can utilize return-based style analysis to track their portfolios at relatively low cost. Money managers are increasingly evaluated relative to a performance specific to their style, such as a growth or a value index. Each index represents a dimension of the behavior of returns corresponding to a particular style. The fund's estimated sensitivities or loadings are taken as measures of its style. Alternatively, the characteristics of the stocks held by a fund serve as another indicator of the types of firms in which the fund invests, and hence its style. Grinblatt and Titman (1989) use such an approach to evaluate fund performance. Sharpe’s econometric model involves a. 治 政 constrained regression that uses several asset classes 大 to replicate the 立 historical return pattern of a portfolio. The constraints are imposed to improve ‧ 國. 學. an intuitive interpretation of the coefficients. First, the coefficients as weights. ‧. within a portfolio the factor loadings are required to add up to one. Second,. io. al. er. suitable to most fund managers.. sit. y. Nat. coefficients should be positive to reflect the short-selling constraint which is. Sirri &Tufano (1998) indicate that mutual funds with higher rank in the. n. iv n C performance lists of magazines attract money from the investing public. It h e n more gchi U might be a lure for mutual manager to deviate his objective and invest in more risky assets. There are abundant evidences of misclassification of mutual funds. Both Brown & Goetzmann (1997) and Dibartolomeo & Witowski (1997) use the realized fund returns as inputs for their analysis. Their results suggest that up to 40% of mutual funds are in one way or another misclassified. Kim, Shukla & Tomas(2000) report classification up to 50% when also taking into account other fund attributes than risk and return measures. These studies do not consider style changes. Of great concern about style consistent, Louis K.C. Chan, Hsiu-Lang Chen and Josef Lakonishok (1999) finds the results that 10.
(11) funds applying consistent styles over time might outperform the funds with inconsistent investing style, and funds with poor past performances are more likely to change styles. In particular, in some situations a manager may have an incentive to deviate from his declared style, in hopes of recovering from past losses or simply to follow the crowd and adopt whichever style has been successful. Brown and Harlow (2004) find that style consistent managers are less likely to make asset allocation errors than those that try to time the market. There is some evidence to suggest consistency is a more valuable talent within some. 治 政 style classes (e.g., large- and small-cap) than others 大 (e.g., mid-cap). Also, 立 although their results do not negate the possibility that managers who follow ‧ 國. 學. an explicit tactical style timing strategy can be successful, they do suggest that. ‧. unintentional style drift can lead to inferior relative performance; indeed, the. sit. y. Nat. decision to remain style consistent may be more useful in helping managers. io. al. persistent superior relative returns.. er. avoid consistently poor performance than creating an environment that fosters. n. iv n C Buetow, Robert, Johnson and Runkle(2000) h e n g c hutilize i U historical returns to obtain the results that Growth Equity Fund and Aggressive Equity Fund significantly have dynamic drift than Balanced Funds, Asset Allocation fund, Growth and Income Fund, and Index Fund. Tracking error relative to a market benchmark can be a reasonable measure of style consistency (Seigel 2003) ,however, it doesn’t measure the style drift of a manager directly. Tracking error is an evolution of the asset class coefficients over time that indicates style drift indirectly. Idzorek and Bertsch(2004) provide a critique of tracking error and style benchmark turnover as a measure of style rotation and propose a new statistic method to 11.
(12) measure style drift, the style drift score, which measures the variability of style through time. The main advantage of the style drift score is that it makes an easier evaluation through numerous rolling asset allocation graphs unnecessary by providing additional complicated information. Holmes and Faff (2007) find there is some evidence that SDS is related to fund performance. In particular, when conditional performance models are used, style drift and selectivity skill are positively related, indicating that managers that are more successful at stock selection tend to be less consistent with respect to style.. 治 政 Brown and Harlow (2002) demonstrate the results大 that more style-consistent 立 funds to produce higher total and relative returns than less consistent funds, ‧ 國. 學. after controlling for past performance and portfolio turnover. These findings are. ‧. robust across fund investment style classification, the return measurement. sit. y. Nat. period, and the model used to calculate expected returns.. io. al. er. Finally, Brown and Harlow (2009) also conclude that deciding to maintain. n. a consistent investment style is an important aspect of the portfolio management process.. Ch. engchi. i Un. v. 3. Data. To demonstrate our concerns, we consider a sample of 30 domestic equity mutual funds in Taiwan for the 2005/11/30~2012/02/29 period monthly returns. The data on the mutual funds are from TEJ database. Since our primary interest is to see style drift of funds; that is to say, we want to demonstrate the loading distribution of a fund over time. What type of the stocks is their favorite. Does mutual fund manager prefer to invest in small stocks or large stocks. We 12.
(13) can get the answer from these data. We searched through this database for mutual funds that are classified by Ph.D Shean-Bii Chiu and Tsun-Siou Lee in their mutual fund performance reports as domestic equity funds that can invest in small, medium and large stocks. These mutual funds that we used in our sample survive at least for 10 years and we focus on the top thirty. Four of thirty mutual funds have just changed its manager to another last year. This enables us to check that when each of four funds changes its manager, whether its operating style change a. 治 政 lot or not. It helps us to measure the style consistency 大 and see a clear picture 立 of changing process. If the calculated SDS is quite high, we can infer that this ‧ 國. 學. fund changes its characteristics a lot. If the result is rather low, we can say that. ‧. two managers have the consistent style and he doesn’t change the investing. sit. y. Nat. philosophy after taking over. So we can keep our eyes on fund four, seventeen,. io. al. er. twenty-seven and fund thirty. Is there any significant change during the time. Some simple descriptive statistics of our fund data are presented in Table 1.. n. iv n C We can observe that their annualized deviations are quite similar that h e nstandard gchi U are all below 30 % but their returns vary from 305% to 51%. Top nine mutual funds its ten years return rate exceed 100%, and best one has two times performance than the second one does and even has six times performance than the last one.. 13.
(14) Table 1. 23.47 24.95 25.43 22.47 24.22 21.16 24.18 23.54 25.09 28.29 28.79 27.24 20.61 24.96 24.62 27.36 22.54 17.98 23.46 17.81 21.19 23.03 24.37 25.09 21.63 19.06 26.66 21.93 20.74 26.36. 政 治 大. Ch. engchi. y. sit er. n. 2000/4/10 1998/4/14 1998/2/4 1999/8/20 1994/4/11 1990/8/13 1996/7/19 1998/11/24 1994/3/16 1993/2/18 1995/4/8 1994/11/1 1999/11/16 1995/2/27 1995/8/9 1997/10/23 2000/6/23 2000/2/23 1997/9/11 1993/12/21 1995/11/22 1998/10/17 1999/9/10 1999/12/7 1994/11/1 1996/8/20 1994/2/18 2000/4/10 1998/7/14 1993/1/30. manager less than one year. ‧. io. al. initiated date. annualized standard deviaiton. 學. rank 1 2 3 4 5 6 7 8 9 10 11 12 13 14 15 16 17 18 19 20 21 22 23 24 25 26 27 28 29 30. 立. Nat. fund1 fund2 fund3 fund4 fund5 fund6 fund7 fund8 fund9 fund10 fund11 fund12 fund13 fund14 fund15 fund16 fund17 fund18 fund19 fund20 fund21 fund22 fund23 fund24 fund25 fund26 fund27 fund28 fund29 fund30. return(%) 305.32 155.58 145.58 142.88 140.85 124.49 118.38 117.61 115.99 95.2 91.82 91.75 91 90.98 88.99 82.48 79.11 77.59 73.28 73.27 70.07 69.62 68.99 68.68 63.63 62.04 61.87 58.37 53.06 51.82. ‧ 國. name. 10 years. i Un. v. 14.
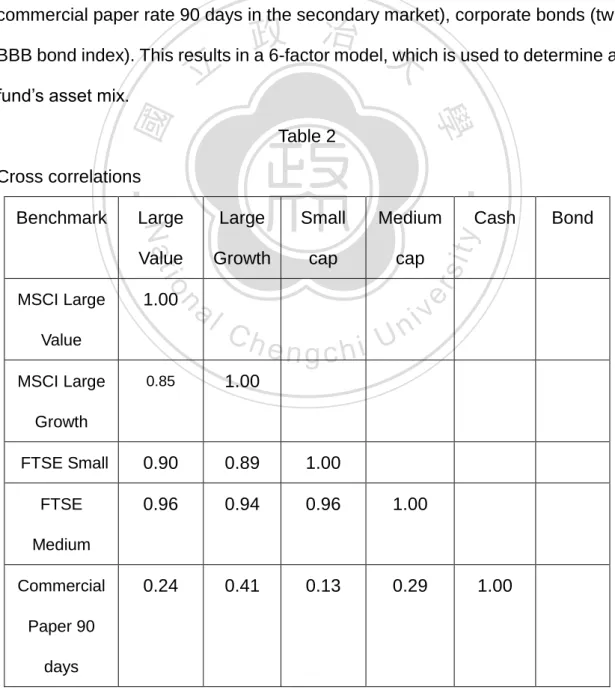
(15) As we only consider domestic equity funds, the relevant style benchmark are all Taiwan indices from Datastream. The style indices we decided to use are the regional indices provided by Morgan Stanley Capital International (MSCI) and Financial Times Stock Exchange (FTSE). We include a Taiwan large value index (the MSCI TW Large Value index), a Taiwan large growth index (the MSCI TW Large Growth index), a Taiwan small cap index (FTSE small cap TW index), a Taiwan medium cap index (FTSE medium cap TW index) and cash-equivalents (less than 3 months to maturity commercial paper rate 90 days in the secondary market), corporate bonds (tw. 學. Table 2. Cross correlations. Large. Small. Medium. Value. Growth. cap. cap. Value. Ch. engchi. i Un. sit. v. 0.85. 1.00. FTSE Small. 0.90. 0.89. 1.00. FTSE. 0.96. 0.94. 0.96. 1.00. 0.24. 0.41. 0.13. 0.29. MSCI Large. Bond. y. al. n. 1.00. Cash. er. io. MSCI Large. Large. Nat. Benchmark. ‧. ‧ 國. 治 政 BBB bond index). This results in a 6-factor model,大 which is used to determine a 立 fund’s asset mix.. Growth. Medium Commercial. 1.00. Paper 90 days 15.
(16) -0.05. BBB. 0.12. 0.01. 0.05. 0.66. 1.00. corporate bond. 4. Methodology. While it is possible to determine a fund’s investment style from a detailed analysis of the securities held by the fund, but a simpler approach that uses only the realized fund-return is also feasible. We don’t have to understand the. 治 政 大instead, return-based knowledge of the actual composition of the portfolio; 立 style analysis requires only easily obtained information.. ‧. ‧ 國. 學. I. Relation to Multifactor Models. sit. y. Nat. Multiple factor models are commonly used to characterize how industry. io. al. er. factors and economy wide pervasive factors affect the return on the individual securities and portfolios of securities. In such models a portfolio of factors is. n. iv n C used to replicate the return on ahsecurity as closely e n g c h i U as possible.. Equation (1) gives a generic n-factor model that decomposes the return on security i into different components:. Ri,t is the return on security i in period t; F1,t represents the value of factor 1; F2,t represents the value of factor 2; Fn,t represents the value of the nth factor and εi,t is the non-factor component of the return. 16.
(17) The coefficients βi,1 , βi,2 , ...βi,n represent the exposure of security i to the different set of industry and economy wide pervasive factors. In factor models the portfolio weights, βi,1 , βi,2 , ...βi,n , need not sum to 1 and a factor, Fk,t, need not necessarily be the return on a portfolio of financial assets.. II. Sharpe’s model for Return-Based Style Analysis Sharpe’s (1988, 1992) Return-based Style Analysis can be considered a special case of the generic factor model. In Return-based Style Analysis we replicate the performance of a managed portfolio over a specified time period. 治 政 as best as possible by the return on a passively managed 大 portfolio of style 立 benchmark index portfolios. ‧ 國. 學. Asset Class Model brought by Sharpe (1992) is built the foundation of. ‧. return-based approach. This model is widely-used among the investors,. io. er. requirements and convenience to operate.. sit. y. Nat. consultants or academic researches because of the minimal data. Based on the return-based analysis, it asserts that a manager’s. al. n. iv n C investment style can be decidedhby comparing the e n g c h i Ureturns of the funds to the returns of a string of the selected passive indices. Sharpe proposes the following generic econometric model:. Eq. (1) where Ri represents the return of the portfolio for t=1,2….T Fi1 ,Fi2…Fin denote the return of index F at time t bi1,bi2…bin are factor loadings that express the sensitivity of the fund return to the factor-mimicking portfolio return of index F 17.
(18) et is the excess return at time t, reflecting the idiosyncratic noise, the part that can’t be explained by the return of the N asset classes. is the particular combination (portfolio) of factors that best replicates the return Ri. The slope coefficients bi1,bi2…bin stand for that the managed portfolio average allocation among the different style benchmark index portfolios - or asset classes during the relevant time period. The sum of the terms in the square brackets is that part of the managed portfolio return that can be. 治 政 explained by its exposure to the different style benchmarks 大 and is termed the 立 style of the manger. The residual component of the portfolio return reflects the ‧ 國. 學. manager decision to depart from the benchmark composition within each style. ‧. benchmark class. This is the part of return attributable to the manger stock. sit. y. Nat. picking ability and is termed selection.. io. al. er. In order to give the factors the meaning of portfolio weights, asset. n. allocations or performance benchmarking, the factor loadings are restricted to add-up to one.. Ch. engchi. i Un. v. A second restriction is the short selling restriction, which means all the holdings should be long positions. ,i=1,2,3……N In the context of. biFnt has the denotation of the return on a passive portfolio. with the same style as the fund. The two important differences when compared to factor models are: (i) Every factor is a return on a particular style benchmark index portfolio, and (ii) The 18.
(19) weights assigned to the factors sum to unity. As before, the objective of the analysis is to select a set of coefficients that minimizes the unexplained variation in returns (i.e. the variance of et ) subject to the stated constraints. The presence of inequality constraints in (3) requires the use of quadratic programming since standard regression analysis packages typically do not allow imposing such restriction. Rearranging Equation (1) yields,. 政 治 大 portfolio returns and ∆ is the n ×1 vector of slope coefficients b ,b …b . The 立 where Χ is the T × n matrix of asset classes returns, Rp is the T ×1 vector of p. i1. i2. in. ‧ 國. 學. term on the left Ep can be interpreted as the T dimensional column vector, [ et , p , t = 1,2..], of differences between the return on the fund and the return on the. ‧. portfolio of passive benchmark style indexes corresponding to the n. sit. y. Nat. dimensional vector Δp of style benchmark portfolio weights − also referred to as. n. al. er. io. style-asset class exposures. The goal of Return-based Style Analysis is to find. v. the set of non-negative style-asset class exposures bi1,bi2…bin that sum to 1. Ch. engchi. i Un. and minimize the variance of et , p, referred to as fund’s tracking error over the style benchmark. Note that the objective of this analysis is not to choose style benchmarks that make the fund “look good” or “bad”. Rather the goal is to infer as much as possible about a fund’s exposures to variations in the returns of the given style benchmark asset classes during the period of interest. It is also important to understand that the ‘style’ identified in such an analysis represents an average of potentially changing styles over the period covered. Month-to-month deviations of the fund’s return from that of style itself can arise from selection of specific securities within one or more asset classes, rotating 19.
(20) among asset classes, or both.. III. A Six Asset Class Model Based on Sharpe(1992)’s twelve asset class model, the return of each asset index is represented by a market capitalization weighted index of the returns on a large number of securities. These indices imply a very important idea that each index can be realized as an investment strategy at lower cost by constructing an index fund. In other word, assumed that one mutual fund is classified by its mutual fund company as a growth fund, we can examine this. 治 政 statement by this model through the magnitude of大 its beta coefficient. Even it 立 has a large beta coefficient, if the return of the mutual fund is inferior to the ‧ 國. 學. passive index fund, then the investor can think about just invest in passive fund. ‧. which equally means this manager doesn’t have superior marketing ability and. sit. y. Nat. stocks selected ability. This method also enables an investor to track the. io. er. returns with little error.. al. In order to make this model to accommodate the situations against our. n. iv n C sample data – domestic mutual h funds, we replacing e n g c h i U and excluding some. indices in Asset Class Model. We remove the inappropriate indices such as Mortgaged-Related Securities Index, Non-U.S. Government Bond Index, FTA Euro-Pacific EX Japan Index, FTA Japan Index and so on; transforming to a six asset class model rather than a twelve asset class model. Table 3 descries six indices used for the associated return analysis. Table 3 Bills Cash-equivalents with less than 3 months to maturity Index: commercial paper rate 90 days in the secondary market 20.
(21) Corporate bonds Corporate bonds with ratings of at least BBB Index: tw BBB Small-capitalization stocks Index: FTSE TAIWN small-price index Medium- capitalization stocks Index: FTSE TAIWN medium-price index Large-capitalization value stocks Index: MSCI TAIWAN Large-Value - PRICE INDEX. This results in a 6-factor model.. sit. y. ‧. Nat. IV. A Rolling Window Method. 學. ‧ 國. 治 政 Large-capitalization growth stocks 大 立 Index: MSCI TAIWAN Large-growth - PRICE INDEX. io. al. er. Dybvig and Ross (1985), for instant, show how linear risk models fail to properly rank fund managers when they change their asset weights through. n. iv n C time. Connor and Korajczyk (1991) how to risk-adjust for nonlinear h econsider ngchi U portfolio strategies by mutual fund managers. Grinblatt and Titman (1993) avoid problems posed by nonlinearities by explicitly considering active strategies as the basis for a benchmark-free approach to performance measurement. While such nonlinearities present problems for style identification as well, our procedure accommodates nonlinear strategies by allowing factor loadings to change on a month-to-month basis. This is critical in the light of the fact that many fund managers actively change their exposure to market. Brown & Goetzmann (1997) find some evidence, in the form of time-varying factor loadings, that this is due to the presence of dynamic 21.
(22) management styles in the mutual fund.. V. STYLE DRIFT SCORE Style drift happens when the holdings of a mutual fund "drift" from one asset class to another class or a manager’s investment style “drift” from one particular attitude to another. In other words, style drift is the evolution of the asset class coefficients over time.(see Idzorek and Bertsch [2004]) Style drift can produce the result in changing the risk-to-rewarding characteristics of a portfolio because manager may overweight in one. 治 政 investment class and underweight in another one.大 This will mislead investor to 立 evaluate the overall optimal portfolio and misallocate their assets when they ‧ 國. 學. make decisions.. ‧. In other words, the effect of diversification may be destroyed.. y. Nat. Generally speaking, if we have more quantity of data to calculate the asset. al. er. io. sit. coefficients, the smoother the charges can see. We will use a‘rolling window’ technique to ascertain the extent of style variation over time: taking 36 months. n. iv n C as an initial time window, then the will be moved forward by 1 month h ewindow ngchi U. and drop the oldest data point, so the number of the time periods used is fixed. Idzorek and Bertsch (2004) developed a quantitative measure to measure the variability of a fund’s asset mix over time called style drift score(SDS). The SDS is calculated as the square root of the sum of the variances of the asset class coefficients derived from Eq. (1) as demonstrated by SDS = where b1,t, b2,t……bn,t represent the time series style weights obtained from the style analysis process. The SDS is the average Euclidian distance of the T 22.
(23) rolling-window asset class coefficients from the center of gravity in K-dimensional space. A fund with a high SDS will represent greater style inconsistency than a fund with a low SDS. Idzorek and Bertsch stand for the point that it is an effective, time-efficient way that comparing style consistency and eliminating the need to examine rolling window style graphs via SDS.. 5. Results. 治 政 Demonstrating the extent to which these mutual 大 funds maintain over time, 立 we estimate the SDS for each fund. Those mutual funds with higher SDS will ‧ 國. 學. be considered that have little consistent investing styles comparing with those. ‧. of have smaller SDS. In order to gain a better understanding for the range of. sit. y. Nat. style drift scores, we use a return-based style analysis for all mutual funds with. io. al. er. at least 10 years of data and examine a set of mutual funds in TEJ categorized as equity fund by Ph.D Shean-Bii Chiu and Tsun-Siou Lee.. n. iv n C Exhibit 1 displays a histogram ofhthe thirty fund managers. The average style engchi U drift score is 3.79. We can clearly see that twenty of thirty (2/3) top mutual funds over 10 years in Taiwan have SDS=0 which means manager doesn’t change his style characteristics significantly during the investing time or we can say, these managers have specific favorite preferences on some type of stocks and stick to it. One of the zero-SDS mutual funds even changed its responsible manager last year but it still has remained SDS equal to 0 so far. In other words, this successor’s investing characteristic conforms to the old one so investors don’t have to worry about this personnel change will affect their diversification or allocation. The SDS range most of the top thirty funds are 23.
(24) distributed is less than ten and centralizes at zero. EXHIBIT 1. 0. 立. 政 治 大. ‧ 國. 學. Calculating SDS of each mutual fund, we can obtain exhibit 2. Top 1 mutual fund over the 10 years has SDS equaling to 6.58 and the second place has. ‧. 1.92 and the highest SDS among thirty funds is close to 37 and rank number. y. Nat. io. sit. six. We are very curious that according that Brown and Harlow (2002). n. al. er. conclude, there is a positive relationship between investment style consistency. i Un. v. and performance − more style-consistent funds will produce higher total and. Ch. engchi. relative returns than less consistent funds. In other words, the better the performance is, the smaller the score should be. However, this claim seems not very obvious in our sample results especially for the top 1 which has the highest returns accompanied with the sixth largest SDS. But for Brown and Harlow (2004), style consistent managers are less likely to make asset allocation errors than those that try to time the market. In contrast, they consider that there is potential for underperformance with such a propensity to maintain a constant style profile and, therefore, overlook opportunities for market timing. Hence, we can consider this condition to 24.
(25) explain the phenomena for the top 1 mutual fund with SDS 6.58, this fund manager might have excellent skills for market timing and stocks selection around small group or large group and so does the manager for fund 6. we can say less conservatively, most of the top thirty mutual funds still have relatively small SDS (tend to zero) and good performance over ten years if excluding fund 6 with SDS equaling to 36.64,the biggest SDS in our sample set. At least, ‘on average’, our results somehow match with Brown and Harlow (2004)’s opinions. EXHIBIT 2. 立. 政 治 大. ‧. ‧ 國. 學. n. er. io. sit. y. Nat. al. Ch. engchi. i Un. v. Exhibit 3 displays the allocated weights of a mutual fund in each type of stocks, and the fund number represents its performance in terms of relative ranking. For example, Fund 3 represents the third in order. We can clearly see all the mutual funds spent its most part of investing proportion in small capitalization stocks (the green zone) and medium capitalization stocks (the red zone) except for the fund 29. It has larger proportion in the large capitalization stocks.. Domestic equity funds can invest. in the small, medium or large stocks without proportionate constraints as long 25.
(26) as meeting the requirement−not short selling. From the allocated maps, we find that most managers centralize much of portions in small group, accompanied with less part in medium or large stocks. The assumption we make is that the active manager declares the fund style at the beginning of each period and is engaged only in picking undervalued securities within each style benchmark asset class. It can somehow infer that fund managers have preference toward small size stocks and consider small stocks might tend to have more undervalued conditions. Sometimes, investing websites in Taiwan misclassify Domestic equity mutual. 治 政 funds as the same level as ones only allowed investing 大 in the small or mid-cap 立 equity so-called Taiwan Small/Mid Cap Category. Compared and ranked the ‧ 國. 學. performance of general domestic funds to small-cap or mid-cap funds together. ‧. that are built in the distinct investing philosophy and group may mislead. sit. y. Nat. investors’ judgment about the risk-to-reward relationship. But if we apply this. io. al. er. kind of classification, then the SDS for these funds will be smaller. In other words, we add the green and the red zone together, and only the purple area is. n. iv n C drift of allocated weights that arehinvesting in the U e n g c h i large-cap value stocks.. Therefore, fund 29 has the most serious degree of style drift over time in this classification. From 73% versus 27% for the proportion to small cap and large cap respectively at the starting day and we can see the trend decreasing for the proportion to large cap. To mention again, this classification loses its objectiveness and only applies in Taiwan. EXHIBIT 3 Portfolio Allocated Maps with Increasing Style Drift Scores. 26.
(27) 立. 政 治 大. ‧. ‧ 國. 學. n. er. io. sit. y. Nat. al. Ch. engchi. i Un. v. 27.
(28) 立. 政 治 大. ‧. ‧ 國. 學. n. er. io. sit. y. Nat. al. Ch. engchi. i Un. v. 6. Conclusion:. Style Analysis can help investors make order out of the chaos that often surrounds the investment process. Return-based Style Analysis enables investors to keep their asset allocation consistent with their investment goals 28.
(29) and evaluate the performance of fund managers against a proper benchmark. Return-based style analysis is a very convenient and useful method to grab a first impression about his investment philosophy of a mutual fund or the family it belongs to for investor. In the paper we present an application to assess a manager’s style drift based on Asset Class Model. Using a sample of Taiwan mutual funds, our primary goal was to investigate the phenomena that whether there exists style changing. To evaluate the degree of style drift over the sample period, we use Sharpe’s (1992) style technique in the form of rolling window analysis to produce a series of style weights for each fund. Although. 治 政 return-based analysis is an effective tool for analyzing 大 the sources of a 立 portfolio’s performance, there are some limitations provided by Dor & ‧ 國. 學. Jagannathan (2002). The technique relies crucially on the correct specification. ‧. of the style benchmark asset classes. Inappropriate or inadequate choice of. y. Nat. style benchmarks may lead to wrong inferences about performance and the. al. er. io. sit. level of ‘active’ management. In addition, since the data used are historical returns, it is difficult to draw any conclusions about the future risk/return profile. n. iv n C of the manager. The method also style changes slowly and at h tends e n gtocdetect hi U times may leave some style changes completely undetected. But it still provides some valuable reference frame, that is no doubt. As to the degree of style drift, the variance of these style weights can be. interpreted in the form of an SDS, and it provides a single quantitative measure of style drift over the sample period (Idzorek & Bertsch, 2004) because earlier research has only provided a qualitative method to approximately estimate. Style drift score measures the variability of a portfolio’s effective asset mix around its average effective asset mix. We provide graphical evidence that SDS is a meaningful measure of style consistency but in our sample the score 29.
(30) related to fund performance is not obvious. We find that although there is no significant trend downwards or upwards in our sample among these 30 mutual funds but SDS is still a useful tool to picture the changing procedure over time. We can clearly observe the altering distributed allocations of the portfolio and choose a fund to meet our requirement best or monitor the fund we investing in by applying the maps. From the perspective of an individual investor, this paper has several implications. To begin with, investors have to look through the surface when choosing to. 治 政 invest in a particular fund. Although funds with varying 大 style can imply that 立 managers’ inability to sustain a stead style profile over time, style drift can be ‧ 國. 學. an indicative of superior selectivity skills as well. Secondly, financial advisers. ‧. need to play a monitoring role to make reliable assessment of this for their. sit. y. Nat. clients. Finally, many funds seem to encounter from moderate cases of style. io. al. er. drift at least and investors should evaluate the extent to which conditions might be exposing them to risks with which they would not normally be comfortable.. n. iv n C Therefore, investment advisers and planners need to become aware h e financial ngchi U of the possibility of style drift in funds and seek out mechanisms by which they can monitor style changes and trends. For practical purposes, we note that importance of measuring style drift in finance has increased lately for investors. This is a useful and easy tool to get the first insight, and we strongly suggest that investors should take it into account when considering constructing their portfolios.. 30.
(31) References: Buetow, G. W., Johnson, R. R. & Runkle, D. E. (2000). “The inconsistency of return-based style analysis, The Journal of Portfolio Management. Pp.61-77. Brown, Keith C., and Harlow (2009). ”Staying the Course: The Role of Investment Style Consistency in the Performance of Mutual Funds.” University of Texas Swinkels and Van Der Sluis (2001). “Return-based style analysis with time-varying exposures.”. 治 政 Chan, Chen, Lakonishok (1999). “On mutual fund大 investment styles” NBER 立 Working paper 7215 ‧ 國. 學 ‧. Holmes and Faff (2007). “Style drift, fund flow and fund performance: new. er. io. sit. y. Nat. cross-sectional evidence.” Financial Services Review 16 55-71.. Otten and Bams(1999). “Statistical Tests for Return-Based Style Analysis”. n. al. Ch. engchi. i Un. v. Sharpe, William F(1992). “Asset Allocation: Management Style and Performance Measurement.” The Journal of Portfolio Management, Winter 1992,pp.7-19. Brown, and Goeyzmann. “Mutual funds styles” Journal of Financial Economics 43(1997) 373-399.. Idzorek and Bertsch. “style drift score” The Journal of Portfolio Management, Fall 2004,31.1:76-83 31.
(32) Barton and Siegel. “The Dimensionsof Active Management.” The Journal of Portfolio Management, Spring 2003, pp. 35-52.. Cooper M.J.,Gulen, and RAU. “Changing Names with Style: Mutual Fund Name Changes and Their Effects on Fund Flows.” Journal of Financial, DECEMBER 2005, VOL. LX, NO. 6. 立. 政 治 大. ‧. ‧ 國. 學. n. er. io. sit. y. Nat. al. Ch. engchi. i Un. v. 32.
(33)
數據
Outline
相關文件
Two sources to produce an interference that is stable over time, if their light has a phase relationship that does not change with time: E(t)=E 0 cos( w t+ f ).. Coherent sources:
In x 2 we describe a top-down construction approach for which prototype charge- qubit devices have been successfully fabricated (Dzurak et al. Array sites are de ned by
His understanding of animals can be summarized in three aspects: animals have minds of buddhas ‒ free and lucid; animals are beings that live in coexistence with humans; and
On the other hand, his outstanding viewpoint of preserving the pureness of the ch'an style of ancient masters, and promoting the examination of the state of realization by means
趣 趣、 、 、 、學習風格 學習風格 學習風格 學習風格等的不同,並有不同的學習需要。2.
However, Humanistic Buddhism’s progress in modern times has occurred in the means of reforms, thus the author believes that we can borrow from the results of the analytical
object of supreme nonconceptual gnosis = true suchness,’ ‘that which conforms to the ultimate truth = prajñā,’ and ‘the supreme object = true suchness,’ and we can see
The Hull-White Model: Calibration with Irregular Trinomial Trees (concluded).. • Recall that the algorithm figured out θ(t i ) that matches the spot rate r(0, t i+2 ) in order
