行政院國家科學委員會專題研究計畫 成果報告
整合數位浮水印與資訊安全之著作權保護管理系統
計畫類別: 個別型計畫
計畫編號: NSC92-2416-H-009-012-
執行期間: 92 年 08 月 01 日至 93 年 07 月 31 日
執行單位: 國立交通大學資訊管理研究所
計畫主持人: 蔡銘箴
報告類型: 精簡報告
處理方式: 本計畫可公開查詢
中 華 民 國 93 年 8 月 12 日
行政院國家科學委員會專題研究計畫成果報告
整合數位浮水印與資訊安全之著作權保護管理系統
計畫編號:NSC92-2416-H009-012
執行期限:92 年 8 月 1 日至 93 年 7 月 31 日
主持人:蔡銘箴 國立交通大學資訊管理研究所
電子信箱: [email protected]
Abstract
The fast development and utilization of
the Internet has dramatically transformed
the business transaction into the digital
format. However, the techniques of the
duplication and modification of digital
data are comparatively effortless.
Therefore, the copyright protection and
authentication management system is in
great demand to meet the business
applications since the buyer and the sale
identity must be verified, the ownership of
the document must be maintained.
Traditionally, network security issues
are handled through the cryptography
which involves sophisticated encryption
and decryption schemes. However,
cryptography can substantially ensures the
attributes of the confidentiality,
authenticity, and integrity only if the
message is transmitted through a public
channel, such as an open communication
network. It does not protect against
unauthorized copying after the message
has been successfully transmitted.
Therefore, watermarks embedded in the
data can uniquely identify the ownership
or usability of the document. The
watermarking provides sufficient
copyright protection. The main problem
with using watermark technology is its
reversibility, any mechanism which can
read or detect the watermark can also
remove it by inverting the watermark
process. Other approaches like digital
signal processing can also significantly
affect the integrity of the document.
The goal of this research project is to
design a digital copyright protection
management system which will elaborate
the digital watermarking technique in
conjunction with the data security
schemes to compensate the reversibility of
detectable watermark. Such mechanism
will make the authentication and
copyright protection more reliable for the
open network communication like the
Internet. We believe the proposed project
can provide a useful ownership
identification and protection framework
and more robust, reliable than pure
readable watermarking design
architecture.
Keywords: Internet, electronic commerce,
digital watermarking, data
security, digital right
management
中文摘要
網際網路的蓬勃發展已使得越來
越多的商業交易以數位化的格式來進
行, 然而數位資訊重製及改造的技術相
當容易,衍生出對所有權保護及認證技
術需求的日益迫切,交易的雙方必須對
資訊來源的真實性及使用者的身份,提
供認證。
傳統上,網路安全能夠經由密碼學
加以保障,但是密碼學僅在訊息傳輸經
過公共管道時才擔保訊息的機密性、鑑
別性與真確性,而且密碼學並不能阻止
成功傳輸卻未經授權的訊息。而數位浮
水印則是一個即使經過傳輸後也能確保
多媒體資料版權的有效方式。浮水印嵌
入在資料內,能夠有效地鑑別文件的擁
有者或經授權的使用者。然而,任何可
以閱讀或察覺浮水印的機制,可以藉由
浮水印嵌入程序的作法來反向操作去移
除嵌入的數位浮水印,或甚至用濾鏡等
數位處理的方式來破壞數位浮水印。
本計畫之主要目的,為設計發展一個
數位著作權保護管理系統,以浮水印為基
礎並結合密碼學技術,以彌補浮水印可逆
性結構的不足,達到使數位多媒體物件之
著作權管理機制能夠在 Internet 等開放網
路環境架構下順暢運行的可靠性,以保護
智慧財產權著作人的所有權。並同時使用
可測性浮水印結構,用來克服浮水印可逆
性的問題;如此的機制,可提供信賴的智
財權保護機制,並且比其他可讀性的浮水
印結構更為強韌與可靠。
壹、
文獻探討
¾ 數 位 著 作 權 管 理 系 統 (Electronic
Copyright Management Systems,
ECMS):
ECMS 可自動化管理並在開放網路
下發佈經交易的多媒體文件,並且考
慮到能夠連結網路環境、協同合作以
保護多媒體資料之智慧財產權的整體
服務。
目前有許多計畫正在發展 ECMS,
例如最新一代的 MPEG 標準 (MPEG-21)
將,在法律允許以及高可靠度的保證
下,建立合理範圍內的智慧財產多媒
體文件交易的規則或協定。
以下為建立有效 ECMS 系統的兩個
方法,這兩個方法皆需要散佈多媒體
文 件 前 之 所 有 權 認 證 工 具
(authoring tools) :
預防盜版,例如IBM的Cryptolope
(
http://www-3.ibm.com/software/s
ecurity/cryptolope
)。
追 蹤 盜 版 , 例 如 the ECfunded
Imprimatur
(http://www.imprimatur.net)。
¾ 以 密 碼 學 為 基 礎 的
ECMS
(Cryptography-based ECMSs)
在以密碼學為基礎的 ECMS 中,著
作者在著作權管理系統中將包裹的數
位物件譯為密文來整合應用。因為使
用者無法存取未經授權應用的文件,
故資料擁有者可以很容易的控制其資
料的用途,例如使用者可以在電腦螢
幕上呈現影像卻無法列印,或者可以
播放音樂但無法儲存等。
這個方法的主要缺點是難以建立
一個嵌入應用標準,而且當多媒體文
件最後傳送到終端使用者手中後(例
如顯示在個人電腦螢幕上或是播放出
來),它仍然可能未經允許而被擷取
或 複 製 。 例 如
Liquid Audio
(http://www.liquidaudio.com) 就是
一個應用於商業系統的例子。
¾ 以 浮 水 印 為 基 礎 的
ECMS
(Watermark-based ECMS)
作者 (Annie) Collecting Society (CS) 傳佈媒介 (McDarrel) 購買者 (Peter) 1 2 (3) 3 (3)
圖 1 交易的精簡模型
以浮水印為基礎的 ECMS 能夠牢固
且強韌地在已被購買的數位物件中嵌
入與智慧財產權相關的浮水印資訊,
這些隱藏的智財權資料可由著作權所
有者命名、或是由系統給定一個獨一
無二的識別代碼以辯認文件的真偽。
浮水印能夠在文件中隱藏資料傳佈者
(distributor) 或 經 授 權 購 買 者
(buyer)
之
識
別
資
訊
(identification)
或
指
紋
(fingerprinting),它能夠檢驗文件
的法律地位,而且追蹤網路上侵犯智
財權的物件散佈路徑。
目前浮水印技術的主要限制是它
的可逆性,也就是說任何可以閱讀或
偵測出浮水印的人都可以移除它。所
以雖然目前看來尚有一段很長的路要
走,但只有致力發展非對稱性浮水印
的方法才能克服浮水印技術本質上的
限制。另一方面來說,因為智財權資
料已直接嵌入數位內容本身中,故以
浮水印為基礎的智財權管理系統不需
要使用者採用特定已加入浮水印的多
媒體內容。
貳、
研究成果
我們發展了一個以浮水印為基礎並結
合密碼學的 ECMS,以補浮水印可逆性結構
的不足,來達到高可靠度的著作權保護。
在開放網路環境下交易的多媒體文件牽涉
到許多參與者 (actors):文件的著作者
(author) 或 著 作 者 群 、 編 輯 者
(editor) 、 傳 佈 媒 介 (media
distributor) 、購買者 (buyer) 等等;
這也牽涉到電子付款的議題,例如資訊安
全與顧客隱私等。為了簡化我們的描述,
我們限制了參與者的數量,並且不涉及付
款與隱私保護的問題。
貳.1 交易模型 Transaction Model
圖 1 為一個簡化的交易模型:
a. 著 作 者 (Document author or
authors):數位影像作者或智慧版
權擁有者,須向 CS/CA 申請專利。
b. 第三方認證、存證單位(CS and CA,
Collecting Society) : 公 正 第 三
方,處理平台上專利認證問題。包
括:發給各成員 PIN、著作品 CUN、
提供著作者申請 Public Key 等等,
並對於所申請之專利留下存證,以
供日後發生法律問題使用。
c. 數
位
影
像
電
子
商
店
(distributor):經過平台 CA/CS
所認證過的數位影像商務業者,可
接受著作者的作品販賣請求以及對
購買者提供數位影像販賣的服務。
d. 購買者(Buyers):數位影像最終
購買者。
e. 識別資料:
PIN(Personal Identifier
Number):個人識別號碼,對於平台
中的各個成員,CA/CS 會發給獨一的
PIN 來識別該成員。
CUN(Creation Unique Number):著
作品識別號碼,對於每一件通過專
利申請的產品,CA/CS 會發給獨一的
CUN 予以識別。
貳.2 系統建置 System Implement
系統建置
ECMS 的核心在於浮水印的嵌入與
抽取,我們將整個 ECMS 系統先縮小至
只有 Author、CS、buyer 三方,即將
販賣者與 CS 合併,這樣有助於整個系
統的建置(圖 2)。
因此在實際系統上,我們將做到
1. 可以讓 Author 註冊身份以獲得 PIN。
2. 讓 Author 能夠上傳影像,並獲得該影
像之 CUN。
3. 利用 Web 系統來嵌入浮水印到影像
裡,且讓 Author 可以下載及管理。
4. Buyer 可以瀏覽並購買喜歡的影像。
5. 系統可以讓 Author 驗證認為有問題的
影像,並判定是否有侵權問題。
這些功能可說是整個 ECMS 的核心,因此在
選擇 Middleware 上,我們選擇了兩種不同
平 台 , 一 是 由 Microsoft 提 出 的
Web-Service,另一則是由 Sun 提出的 J2EE
Platform,這兩種平台各有優缺點,所使
用的技術也不相同,我們將其都實做出
來,並比較其差異。
一、J2EE Platform
Java 是由 Sun 所提出的一個軟體平
台,其依據平台應用領域分為三個版本,
標準版本(J2SE,Java 2 Standard Edition)
用於開發個人電腦上的應用軟體,企業版
本(J2EE,Java 2 Enterprise Edition)
用於開發企業級的商用程式,如資料庫應
用軟體、ERP 系統等,以及微型版本(J2ME,
Java 2 Micro Edition)則是針對消費性
裝置的應用開發。
而我們選擇 J2EE,目的是希望提出一
個低成本、高可用性、高可靠性以及高可
擴展性的網路應用程式平台,透過這個統
一的開發平台,J2EE 降低了開發多層次網
路應用程式時所需的費用及其複雜性,同
時也對現有的應用程式提供良好的支援,
完全支援 EJB(Enterprise JavaBean),具
有良好的封裝與佈署能力,可與現有的加
解浮水印程式結合,達到我們的目的。圖 3
是我們設計的元件圖。
整個架構由幾個原件構成,User 端只
需要一般的瀏覽器,在伺服器端,又分成
兩個部分,在前端的呈現是由 JSP 與 Java
Servlet 作 為 溝 通 介 面 , 另 一 則 是 EJB
(Enterprise JavaBean) Container 中的
EJB 元件,這個 EJB 元件是負責將現有的浮
水印程式包覆起來,並藉由 JSP 或 Servlet
的呼叫來執行,並可以將執行的結果回傳
到網頁上或是直接進入 Database,相同
地,因為系統會有 Author 來註冊身份,故
同樣需要與 Database 進行直接溝通,如此
一來,有幾項優點:
Author
CS
Buyer
圖2 系統建置模型
Web Container Web Browser Web Pages User End JSP Page Service 系統介面 Servlet EJB Container EJB EJB DataBase 後端資料庫 圖3 J2EE Platform 元件圖A. 不論是 JSP 或是 Servlet,其安全性都
較高。
B. EJB 的元件可以不斷地重複使用,例如
浮水印程式一旦被包覆起來,就可以
藉由傳送參數來重複執行,且若是要
修改原程式碼也非常方便。
C. 除錯將非常快速,一旦這些元件都各
自獨立後,除錯將非常快速,有錯誤
的環節將可以很快被偵測出來,並修
改完成。
¾ 建構環境
圖 5 系統首頁
Windows 2000 Server
Tomcat
5.0(Web Server)
JSP
2.0
Servlet
1.1
Enterprise
JavaBean
MySQL
4.0(DataBase)
¾ 系統流程
圖 4 是整個網站地圖,
一旦進入首頁就會看見 Author 與 Buyer 各
自專區(圖 5)
我們可以依照網站地圖按圖索驥,不過我
們的重點將注重於 author 與 CS 之間註冊
與加解密浮水印的過程,因此,針對 Author
會有較詳盡的說明。
圖 6 Author 登入畫面
圖 6 是 Author 登入畫面,已經註冊的
author 必須輸入獲得的 PIN 作為登入帳
號,若無 Author PIN,則需註冊並獲得一
份 Author PIN,才能進入 Author 專區(圖
7)。
首頁 Buyer專區 Author 註冊 付款 獲得影像 瀏覽欲購買影像 影像管理 註冊新影像 登入 獲得具有 浮水印之影像 圖4 網站地圖圖 7 Author 功能專區
Author 專區的功能可說是整個 ECMS 的核
心功能
a. 註冊新影像:提供 Author 上傳並
註冊一份新的影像,這份影像將經
過 EJB 所包覆的浮水印程式如圖 8
這份影像將經過負責影像上傳的
Servlet 控制(圖 9-1),一旦
Servlet 接收到影像後,就會針對
影像呼叫 EJB 進行嵌入浮水印的動
作,並且嵌入之後會給予 Author
屬於該文件的 CUN(圖 9-2)。
b. 第二個部分是影像管理功能(圖
10),如圖所示,在此可以管理
Author 所註冊過的所有文件,並可
以瀏覽這些影像或是下載回去,
圖 9-2 Author 獲得該影像之 CUN
c. 第 三 個 部 分 是 檢 驗 影 像 的 合 法
性,這部分的主要目的是讓 Author
在發現某張影像未經授權時,可以
藉由此驗證區進行該影像的浮水
印驗證(圖 11-1);這畫面是要讓
使用者輸入他在網路上發現可能
未經授權之影像,以及原影像的
CUN,系統可以將這兩張影像經由
抽取浮水印的程式,進行影像驗
證。
而依照驗證的結果,系統也將
給予說明是否有侵權的問題(圖
11-2)。
d. 第四部分則是讓 Author 修改密
碼,這只是一般的資料庫存取,在
此就不多做贅述。
圖 8-1 Author 註冊新影像
圖 9-1 Author 註冊新影像
圖 10 Author 影像管理介面
e. 最後是從 Buyer 區進入,就可以看
見 Author 欲販賣的影像,並可以
信用卡付帳購買(圖 12)。
Image Container JSP C/Delphi Watermark Program Watermarked Image Original Image EJB 圖8 EJB包覆浮水印程式示意圖二、Web-Service
¾ Web Service 架構
Web Services 的觀念其實就可以
想像 Internet 上充滿了各種型式的服
務 ( www 網 頁 也 可 算 是 其 中 一 種 服
務),只要是 Internet 使用者,便可
以在 Local 端使用世界各地發表的
Web Service 。 更 清 楚 的 來 說 , Web
Service 就像是 Internet 上的元件服
務,不論使用何種系統平台、何種程
式語言所撰寫出的應用程式,都可以
將它們引用到自己的應用程式之中。
網路服務就是存在於網際網路上
面的一種應用程式,不同於本機端開
發的應用程式,每個功能模組都可以
自行定義及開發,透過網路服務的機
制,任何人可以在網際網路上面尋找
自己想要的應用程式模組,將其納入
所要開發的應用程式中,也可以將自
行開發完成的應用程式模組,經過註
冊後提供給網際網路上使用者使用。
¾ Web-Service 基本架構
所示為網路服務的基本架構概念
圖,從此圖中可以更清楚的了解網路
服務的運作機制是由三個單元組成
(圖 13)
,分別是服務提供者(Service
Provider)、服務需求者(Service
Requester)及服務註冊機構(Service
Registry),而三者之間的關係分別
存在有發行(Publish)、尋找(Find)
及聯結(Bind)。
分散式的問題藉由整個系統採用 Web
service 建置而獲得解決。Web service 的
環境,可以依賴.Net Framework 本身對於
Web service 架構的支援輕易達成。電子商
務技術及介面問題,則仰賴 ASP.NET 和 Web
service 配合資料庫所開發的網頁介面來
滿足系統需求。第三點,舊有程式與系統
整合,是整個架構在建置上比較迫切的問
題,如何讓需求者透過網頁介面來使用這
圖 12 Buyer 瀏覽欲購買之影像
圖 11-1 Author 影像驗證畫
圖 13 Web-Service 基本架構圖
圖 11-2 Author
影像驗證結
些舊有的系統或程式,不但是架構是否能
快速建置的癥結,也是日後系統能否迅速
推展的要素之一。因此,使用 wrap 的方式
把舊系統包進 web service 之中(圖 14),
如此一來,服務需求者可以藉由網頁上的
介面,透過 web service 所提供的 method,
來利用這些系統及服務。雖然架構不同,
但是畫面和功能都是相同的,因此就不做
介面介紹了。
參、研究討論
藉由這個雛形系統的建立,我們看到
了數位影像發展的未來,且也體會到
整個商務數位影像發展仍有不少難關
需要克服:
1. 兩種不同的平台所建立的網站功能
大致相同,速度上是 Web Service
佔了優勢,原因為我們使用的作業
系統是 Microsoft Windows,已針對
這方面進行最佳化,J2EE Platform
終究是多了一層,連包覆浮水印程
式都要再多一層 EJB,不若 VB.NET
直接使用。且在開發速度上也是 Web
Service 較快。但在安全性上就是
J2EE 佔了優勢,因 Web Service 在
安全協定上尚有許多未規範之處,
使得系統建立雖快,卻有許多安全
上的疑慮,不若 JSP 般穩定且安全。
2. 目前浮水印的技術仍然侷限於 RAW
格式的檔案,並非所有的格式都可
以嵌入浮水印,且影像的大小也有
所限制,例如不能小於 64×64。
3. 在我們的雛形系統中,我們只先使
用了一層浮水印,但是在整個 ECMS
的架構下,加入三層的浮水印,如
此是否會影響影像的品質,仍需要
進一步研究。
Web Service Wrap 舊有的 C/Delphi程 式 Method 1 Method 2 Service requester 圖14 以Web-Service使用舊有的程式肆、結論
在使用浮水印技術以落實著作權
法律規範應用到真實世界之前,還需
要再做更深一層的研究,除了使系統
更加強韌之外,我們還需要有更深入
的 協 定 級 分 析 (protocol-level
analysis) 才能澄清浮水印技術能達
成什麼目標、或不能夠達成什麼目標。
雖然目前浮水印技術上的彈性尚
不足以應付其實務需求,但是以數位
浮水印落實著作權的保護仍是一件非
常可行的辦法,且此技術可以用在不
同的多媒體視訊、音訊等媒體上,並
達成資訊隱藏的效果,具有不影響到
原有的訊號、強固性高等優點,由本
文的 ECMS 雛形系統就能清楚的展示浮
水印技術的潛力。
此 外 , 我 們 所 研 究 的 中 介 軟 體
上,Web-Service、J2EE 都已具備了相
當優異的平台架構,可以結合現有的
應用軟體,大大地節省了開發軟體的
時間,以及有更加的整合性,整合多
個不同的單位,加上跨平台概念的實
行,未來 PDA、行動裝置等都可以使
用,可想見數位影像的電子商務將是
明日之星。
伍、結果與討論
本研究計劃已獲得相當豐富的研究成
果,由於前一年相關計畫的前導,再加上
這一年孜孜不倦的努力,在本年內,已有
數篇英文會議論文的發表。
第 一 篇 英 文 會 議 論 文 是 發 表 在 ICE
B2003,於民國 92 年 12 月 9 日至 12 月
13 日在日本東京市舉行,論文題目是“The
Analysis of Critical Factors of E-Learning
System for E-Business”,內容請見附件一。
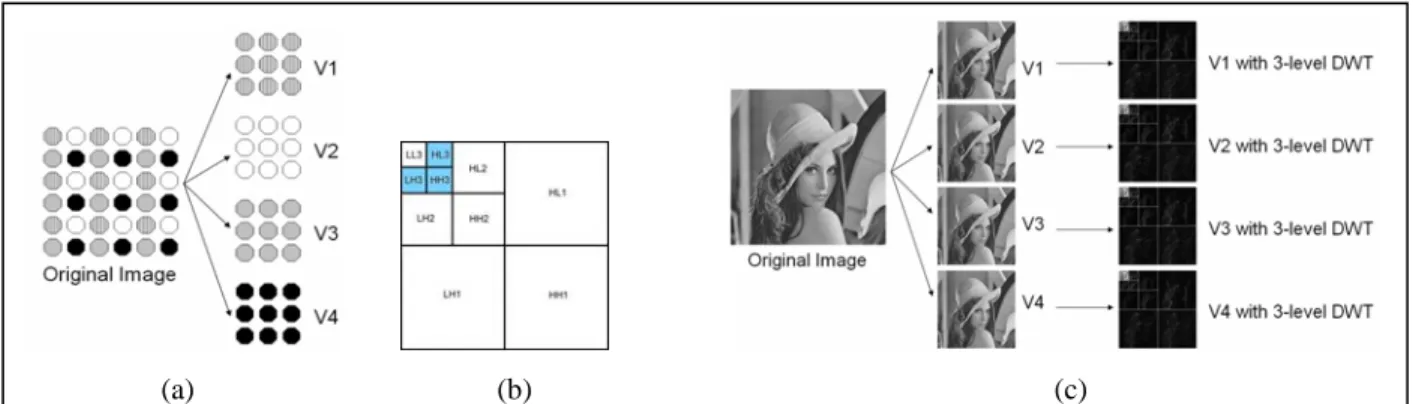
第二篇英文會議論文是發表在 ICDCS
的 MNSA workshop,於民國 93 年 3 月
23 日至 3 月 26 日在日本東京市舉行,論
文 題 目 是 “DCT and DWT-based Image
Watermarking by Using Subsampling”,內容
請見附件二。
陸、計劃成果自評
本研究計劃研究成果,已獲得相當具
體及深入的學術成果,並提供電子商務的
實際應用與數位浮水印,資訊安全之著作
權保護管理系統智財權之可延續性的研
究;在此同時,將繼續做更深入的探討外,
也努力參與相關學術研討及論文發表,以
達更專精的學術研究為目的。
柒、參考文獻
圖書
♦ Cope B. and Freeman R. Digital
rights management and content
development. Altona, Vic.:
Common Ground Publishing, 2001.
♦ Rosenblatt, B. Digital rights
management: business and
technology. New York: M&T
Books, 2002.
♦ Sander T. Security and Privacy in
Digital Rights Management. ACM
CCS-8 Workshop DRM 2001
(Philadelphia, PA, USA, November
2001). USA, New York, NY: ACM
Press, 2002.
期刊論文及技術報告
♦ Bartolini, F.; Cappellini; Piva, A.;
Fringuelli, A.; Barni, M. “Electronic
copyright management systems:
requirements, players and
technologies” Database and Expert
Systems Applications, 1999.
Proceedings. Tenth International
Workshop on , 1999. P. 896 -898.
♦ Bartolini, F.; Piva, A.; Barni, M.
“Watermarking-based copyright
protection of internet-delivered
multimedia” Web Delivering of Music,
2001. Proceedings. First International
Conference on , 2001. P. 44 -50.
♦ Berghel, H.; O'Gorman, L.
“Protecting ownership rights through
digital watermarking” Computer,
Volume: 29 Issue: 7 , Jul 1996. P.
101 -103.
♦ Burke, Dan L. and Cohen, Julie E.
"Fair Use Infrastructure for Rights
Management Systems". Harvard
Journal of Law & Technology, 15 (1),
Fall 2001: 41 - 83.
♦ Camp, L. Jean. “DRM: doesn't really
mean digital copyright management”
Conference on Computer and
Communications Security,
Proceedings of the 9th ACM
conference on Computer and
communications security. USA, New
York, NY: ACM Press, 2002. P. 78 –
87.
♦ Cappellini, V.; Bartolini, F.; Caldelli,
R.; De Rosa, A.; Piva, A.; Barni, M.;
Wada, M. “Copyright protection of
cultural heritage multimedia data
through digital watermarking
techniques” Database and Expert
Systems Applications, 2000.
Proceedings. 11th International
Workshop on , 2000. P. 935 -939.
♦ Chin-Chen Chang; Jyh-Chiang Yeh;
Ju-Yuan Hsiao. “A method for
protecting digital images from being
copied illegally” Digital Libraries:
Research and Practice, 2000 Kyoto,
International Conference on. , 2000. P.
373 -379.
♦ Chin-Chen Chang; Kuo-Feng Hwang;
Min-Shiang Hwang. “A block based
digital watermarks for copy
protection of images”
Communications, 1999.
APCC/OECC '99. Fifth Asia-Pacific
Conference on ... and Fourth
Optoelectronics and Communications
Conference , Volume: 2 , 1999. P.
977 -980 vol.2.
♦ Erickson, J. “Information Objects and
Rights Management” D-Lib
Magazine, April 2001 Volume 7
Number 4
<
http://www.dlib.org/dlib/april01/eric
kson/04erickson.html
>
♦ Gunter C.; Weeks S., and Wright A.
“Models and Languages for Digital
Rights” InterTrust Star Lab Technical
Report STAR-TR-01-04, March,
2001
<
http://www.star-lab.com/tr/star-tr-01
-04.pdf
>
♦ Hartung, F.; Kutter, M. “Multimedia
watermarking techniques”
Proceedings of the IEEE, Volume: 87
Issue: 7 , Jul 1999. P. 1079 -1107.
♦ Hartung, F.; Ramme, F. “Digital
rights management and watermarking
of multimedia content for
m-commerce applications” IEEE
Communications Magazine, Volume:
38 Issue: 11 , Nov 2000. P. 78 -84.
♦ Heun Kim; Dae-Joon Hwang. “A
study on the system call for the
protection of intellectual property
rights on Linux base” Dependable
Computing, 2001. Proceedings. 2001
Pacific Rim International Symposium
on, 2001. P. 295 -298.
♦ Horne, B; Pinkas, B.; Sander, T.
“Escrow services and incentives in
peer-to-peer networks” Electronic
Commerce, Proceedings of the 3rd
ACM conference on Electronic
Commerce (2001 , Tampa, Florida,
USA). USA, New York, NY: ACM
Press, 2001. P. 85-94.
♦ Iannella, R. “Digital Rights
Management (DRM) Architectures”
D-Lib Magazine, June 2001 Volume
7 Number 6.
<
http://www.dlib.org/dlib/june01/ian
nella/06iannella.html
>
♦ Martin M., et al. “Federated Digital
Rights Management: A Proposed
DRM Solution for Research and
Education” D-Lib Magazine,
July/August 2002 Volume 8 Number
7/8.
http://www.dlib.org/dlib/july02/marti
n/07martin.html
♦ M.J. Tsai, K.Y. Yu and Y.Z. Chen,
“Joint Wavelet and Spatial
Transformation for Digital
Watermarking”, IEEE Trans. on
Consumer Electronics, vol. 46, No. 1,
pp. 241-245, Feb. 2000.
♦ Min-Jen Tsai and Mu-Yen Chen,
“The Secret-Open Watermarking
Scheme for Ownership Verification”,
International Journal of Computer
Application in Technology (IJCAT),
2002, (accepted, SCI Expanded,EI,
SCI till 2001).
♦ Park, J; Sandhu, R. “Towards usage
control models: beyond traditional
access control” ACM Special Interest
Group on Security, Audit, and
Control. USA, New York, NY: ACM
Press, 2002. P. 57 – 64.
♦ Piva, A.; Bartolini, F.; Barni, M.
“Managing copyright in open
networks” Internet Computing, IEEE,
Volume: 6 Issue: 3 , May/Jun 2002. P.
18 -26.
♦ Sharma, R.K.; Decker, S. “Practical
challenges for digital watermarking
applications” Multimedia Signal
Processing, 2001 IEEE Fourth
Workshop on, 2001. P. 237 -242.
♦ Stamp, M. “Risks of digital rights
management” Communications of the
ACM, Volume 45 , Issue
9 (September 2002). USA, New
York, NY: ACM Press, 2002. P. 120.
♦ Valimaki, M.; Pitkanen, O. “Digital
rights management on open and
semi-open networks” Internet
Applications, 2001. WIAPP 2001.
Proceedings. The Second IEEE
Workshop on , 2001. P. 154 -155.
♦ Yang-Koo Kang; Moon-Hyun Kim.
“Real-time fingerprints recognition
mechanism-based digital contents
protection system for interaction on
the Web” Dependable Computing,
2001. Proceedings. 2001 Pacific Rim
International Symposium on, 2001. P.
304 -307.
網路資源
♦ Authena Open Source Digital Rights
Management <
http://authena.org/
>
♦ Content Wire: Digital Rights
Management
<
http://www.content-wire.com/drm/d
rm.cfm
>
♦ Cover Pages: XML and Digital
Rights Management
<
http://xml.coverpages.org/drm.html
>
♦
Digital Object Identifier
<
http://www.doi.org
>
♦
Digital Rights Management
Workshop
<
http://www.w3.org/2000/12/drm-ws
/
>
♦ EContent Management: Digital
Rights Management
<
http://www.econtentmag.com/r8/
>
♦
Internet Digital Rights Management
(IDRM) <
http://www.idrm.org/
>
♦
Interoperability of data in
e-commerce systems
<
http://www.indecs.org
>
♦
Open Digital Rights Language
<
http://odrl.net/
>
附件一
The Analysis of Critical Factors of E-Learning System for E-Business
Tzu-Hsin Yang and Min-Jen Tsai
Institute of Information Management
National Chiao Tung University
Hsinchu, Taiwan
[email protected] and [email protected]
Abstract
Many factors such as barriers, reasons, vendor consideration, success factors and challenges play important roles in implementing electronic-learning systems for e-business. In this paper, a questionnaire is used to collect respondents’ attitudes toward those factors, and the result is analyzed.
The result of chi-square test indicates that the respondents who have e-learning systems in their organizations are mostly from industries, and for those who have not tend to emphasize more on “cost and unawareness” which scored under 0.4 (i.e. low internal consistency) in reliability. However, the variance of the respondents’ attitudes toward the remaining six factors is not large.
Keywords: e-Learning, e-Business, barriers,
reasons for implementation, vendor
consideration, success factors, challenge
factors.
1. Introduction
†Problems may be encountered when
implementing e-Learning systems for
e-business; however if barriers are known in
advance, problems are easier to be solved. In
addition, reasons for implementation from
different stakeholders setup directions to be
followed for e-Learning systems. If the
expectation of an e-Learning system is known,
corporations can be more confident setting up
corresponding strategies (see Figure 1) and
†
This work was partially supported by the National
Science Council in Taiwan, Republic of China, under
Grant NSC 91-2623-7-009-016, NSC91-2416-H009-012
and NSC92-2416-H009-012.
implementation can be started. Furthermore,
suitable vendors can supply satisfactory
e-Learning solutions to corporations. Suitable
vendors which provide contents, technologies
and services help shorten the implementation
time, and guarantee a successful e-Learning
system for e-business. Success and challenge
factors are collected from related articles which
suggest actions to be taken for a better
implementation.
In sum, it is recommended to analyze the situation of the corporation as well as plan the expectations for e-Learning systems for e-business. Suitable vendors shall be chosen, and lastly success and challenge factors serve as references for their e-Learning systems.
2. Purpose
B2B e-Learning systems facilitate
enterprises’ (i.e. business-to-business) learning
mechanisms via the Internet. Some research
reports the factors of their implementations.
However, the relationships among the
responses toward these factors and whether
respondents have e-Learning systems in their
organizations are seldom observed. Why do
corporations need to understand all these
critical factors clearly? Because by doing so,
corporations save time and avoid spending
money on unnecessary places. If corporations
know exactly what different stakeholders feel
toward these items, the results will be valuable.
This research investigates implementation
factors, and provides practical advices. It
analyzes the collected data which is from the
survey of “critical factors of an e-Learning
system for e-business”, and tests such as
chi-square test, factor analysis and t-test are
used to verify whether there are significant
differences in respondents who have e-Learning
systems in their organizations, and those who
have not. Lastly, the differences and new
findings are emphasized.
Figure 1 Strategy and Stakeholders
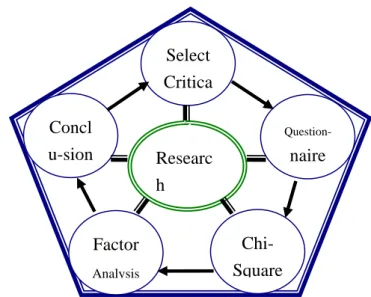
3. Methodology
The research methodology consists of “select critical factors”, “questionnaire design”, “chi-square test”, “factor analysis”, “t-test” and “conclusions” (see Figure 2). The critical factors which collected from the related literatures (see Table 1) are categorized into barriers for e-Learning, reasons for implementation, vendor consideration, success and challenge. A questionnaire which includes nine demographic questions and thirty-eight questions of critical factors is thus designed.
Chi-square test, factor analysis and t-test are conducted to examine if there are significant differences among the responses toward these factors and whether the respondents have e-Learning systems in their organizations. Lastly, the results will be well examined and feedback to the survey for advanced research.
3.1 Designing Questionnaire
Three different types of questionnaires that are web-based, e-mail and hardcopy are provided. The majority of the respondents prefer the web-based questionnaire. The questionnaire consists of six sections. Section 1 identifies the demographic information of the respondents. Questions include gender, age, career, department, position and education. Section 2 focuses on the attitudes of respondents toward the identified “four barriers”. Section 3 emphasizes their attitudes toward “reasons for implementation”.
Section 4 focuses on “vendor consideration”. Section 5 weights their viewpoints toward “success factors”, and lastly section 6 examines the attitudes toward “challenge factors”. These factors are measured using Likert-type scale which ranges from 5 to 1 with the following equivalence, “5”: “strongly agree”; “4”: “agree”; “3”: “neutral”; “2”: “disagree”; “1”: “strongly disagree”.
Figure 2 Research Methodology
Table 1 Factors Selected from Related
Literatures
Factors / Findings
Source
c Barriers
Budgetary considerations.
Immaturity of learning object
technologies.
Lack of awareness.
SRI [18]
Consulting
Business
Intelligenc
e
CEO
HR
Custom
Employ
Sales
Supplie
Vendor
Save
Financi
Competenc
Motivate
Integration with
Servic
Knowledg
Productivit
IT Dept
Researc
h
Select
Critica
Factor
AnalysisQuestion-naire
Concl
u-sion
Chi-
Square
Cost versus value.
Quality of learning content.
Internal resistance to using
technology instead of
face-to-face learning.
Forum
Corp. [9]
d Reasons
Stay nimble and innovative.
Increase customer satisfaction.
Stomp the competition.
Cut costs.
Satisfy the IT department.
Improve my skills.
Earn more money.
Lance
Dublin and
Jay Cross
[14]
e Vendor Consideration
Content, Technology and
Service.
Digital
Think [4]
Experience.
Cost.
Rosenberg
[15]
f Success
Executive stakeholders.
Be the learner.
Marketing is your friend.
Virtual project teams.
Measure everything.
Cisco [2]
Include peer interaction.
Provide mentoring.
Offer performance feedback.
David
Price
&Patrick von
Schlag [3]
g Challenge
The first seven items as
described in Section 3.2 –
Challenge Factors.
Digital
Think [4]
Perceived difficulty of using
such a system.
Forum
Corp. [9]
3.2 List of Factors under Investigation
In this survey, five main items are observed, and each of them contains sub-items The are listed below:
Factors of Four Barriers [9] [18]
B1 Cost too high
B2 Technology Immaturity B3 Solution Immaturity B4 Unawareness
Factors of Reasons for Implementation [14]
R1 Increase Competence R2 Stay Innovative R3 Support 24 x 7 Training R4 Reduce Training Time R5 New Training Technology R6 Reduce Training Cost R7 Increase Revenue
R8 Decrease Time Spending on Selling R9 Flexible Learning
R10 Win-Win Situation R11 Customer On-Line Learning R12 Enhance Customer Satisfaction
Factors of Vendor Consideration [4] [15]
V1 Content V2 Technology Integration V3 Service Quality V4 Implementation Experience V5 Implementation Cost V6 Reputation
Success Factors [2] [3]
S1 Organizational Support S2 Virtual Project Teams S3 Measure everything S4 Include Independent Learners S5 Include Peer Interaction S6 Provide Mentoring S7 Offer Performance Feedback S8 Marketing
Challenge Factors [4] [9]
C1 Correct Target Setup C2 LMS Configuration C3 Tutors and SMEs Integration C4 Content Creation C5 Multiple Modes of Learning C6 Back-End Systems Integration C7 Web Infrastructure
C8 Online Access Capability Training
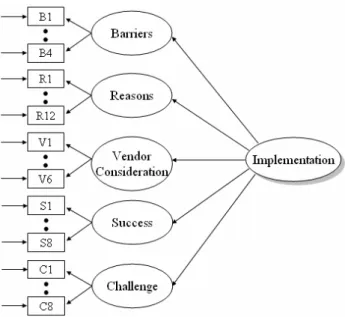
3.3 Conceptual Model
A qualitative phase of this research is conducted to identify possible factors leading to the implementation of an e-Learning system for e-Business [1]. Related literatures on e-Learning systems for e-Business are also reviewed in order to select the factors of interest. Figure 3 depicts the conceptual model of the six factors naming, “Barriers”, “reasons”, “vendor consideration”, “success” and “challenge” and “implementation”.
4. Analysis Methods
Information on the attitudes toward critical factors of e-Learning systems for e-business is gathered through survey. Four types of analysis algorithms are used for different factors. Percentage analysis is used for demographic information, and chi-square test examines the relationships among different demographic data as well as whether the respondents have e-Learning systems in their organizations. Factor analysis extracts new factors from those five critical items. New factors are verified using Cronbach’s alpha test to measure the reliabilities. T-test examines the differences among the extracted factors and whether the respondents have e-Learning systems in their organizations.
Excel 2002 and SPSS10.0 are used to compute those results. Detailed explanation and diagrams are provided and discussed in the following sections. Chi-square test contains the row and column variables of the test. Factor analysis and Cronbach’s alpha test are explained in Section 4.2 and 4.3. T-test contains one diagram of the test and grouping variables.
Figure 3 Proposed Models of Factors of Implementing E-Learning Systems for e-Business
4.1 Chi-Square Test
Figure 4 depicts the variables of chi-square test. The relationships among gender, working field, department, role, experience and whether the respondents have e-Learning systems in their organizations are carefully examined.
Gender consists of female and male. Field contains students and the respondents from industries. Department is divided into two groups: Non-IT and IT departments. Role consists of the respondents’ experiences on implementation of e-Learning systems. Lastly, experience includes those who have or have not experiences of using e-Learning systems.
4.2 Factor Analysis
According to Foster [12], factor analysis is a technique or a family of techniques which aim to simplify complex sets of data by analyzing the correlations between them. A component or a factor explains the variance in the inter-correlation matrix, and the amount of variance explained is called the eigenvalue.
A factor loading is the correlation of a variable with a factor. If a loading is higher or equal to 0.3, it is frequently taken as meaningful when interpreting a factor. In this paper, principal components analysis is recommended as the method for reducing the number of variables. In order to obtain an orthogonal simple structure rotation, varimax method is used.
4.3 Cronbach’s Alpha Test
According to Foster [12], reliability refers to the consistency of the results on different items in a test.
Cronbach’s alpha is one of the standard ways to express the reliability of a test. The value can be obtained by using SPSS10.0. A reliability coefficient of 0.8 or higher is considered as “acceptable” in most social science applications. The value should not be lower than 0.7. However, tests of personality often have much lower values, partly because personality is a broader construct.
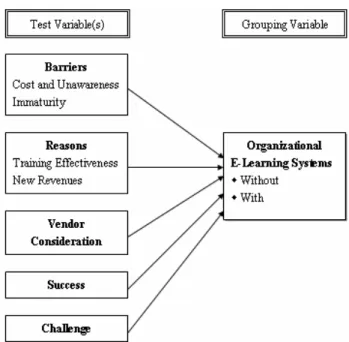
4.4 T-Test
Figure 5 depicts the test and grouping variables of t-test. The differences among “Cost and Unawareness” and “Immaturity” in barriers factor, “Training Effectiveness” and “New Revenues” under reasons for implementation, “Vendor Consideration”, “Success”, “Challenge” and whether the respondents have e-Learning systems in their organizations are carefully examined.
5. Demographic Information
The survey was conducted from May 13th to May 27th, 2003. There is a total number of 142 respondents, including 56 females (39.44%) and 86 males (60.56%) respectively (Figure 6), agreed to participate in this research. Most of them were from Hsin-Chu Industrial Science Park and National Chiao Tung University.
Figure 4 Variables of Chi-Square Test
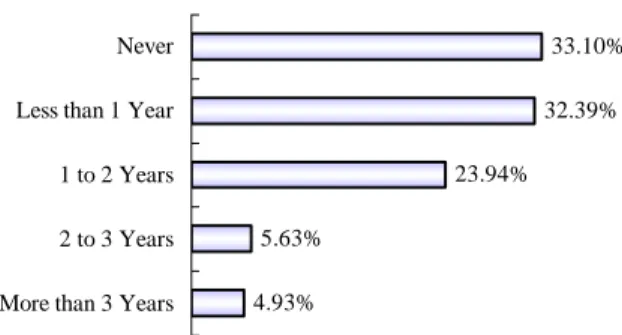
Figure 5 Test and Grouping Variables of T-Test From figure 7, it clearly illustrates that 29.58% of the respondents were students, and 23.24% of the respondents came from the information technology industries, 16.20% were from electrical and electronics, and 15.4% were from military, government and academic. After the analysis of the departments’ bar chart as shown in Figure 8, it is found that 21.13% of the respondents were from the departments of information technology, 11.27% were from management, 10.56% were from technical support, 8.45% were from research & design. 53.52% of the respondents have no e-Learning systems in their organizations (Figure 9). The respondents who have no experiences of implementing e-Learning systems accumulate 72.54% whereas the ones who have account for 27.46% (Figure 10). Lastly, Figure 11 illustrates their experiences of using e-Learning systems.
Male, 60.56% Female,
39.44%
16.20% 23.24% 1.41% 15.49% 8.45% 1.41% 29.58% 4.23%
Electric and Electronics Information Technology Finance Military, Government and
Education Manufacturing and Business
Self-Employment Student Others Figure 7 Industry 11.27% 4.23% 21.13% 8.45% 10.56% 0.70% 3.52% 0.70% 29.58% 9.86% Management Human Resource Information T echnology Research and Design T echnical Support Finance Sales Customer Service Student Others Figure 8 Department Yes 46.48% No 53.52%
Figure 9 E-Learning Systems Implemented
in Organizations
Yes 27.46%
No 72.54%
Figure 10 Joining the Implementations of E-Learning Systems 33.10% 32.39% 23.94% 5.63% 4.93% Never
Less than 1 Year
1 to 2 Years
2 to 3 Years
More than 3 Years
Figure 11 Experiences of Using E-Learning Systems
6. Chi-Square Test on Demographic Items
The chi-square test was conducted to test
whether there were significant differences
among different demographic data as well as
whether the respondents have e-Learning
systems in their organizations.
c Gender
The chi-square value is 1.087 (df=1, n=142)
and the p-value is .297 (p>0.05) which means
that there is no significant difference. Thus we
concluded that whether the respondents have
e-Learning systems in their organizations do
not have significant difference in gender.
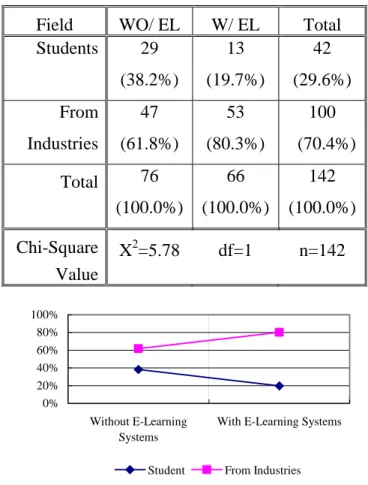
d Working Field
The relationship between the respondents’
fields and whether they have e-Learning
systems in their organizations is shown in Table
2 (Note: c WO/EL = Without Organizational
E-Learning Systems; d W / EL = with
Organizational E-Learning Systems). The
chi-square value is 5.78 (df=1, n=142) and the
p-value is .016 (p<0.05) which means that there
is a significant difference. When comparing the
percentages of the two working field groups in
Table 2, the percentage of the respondents who
are students and have e-Learning systems in
their organizations (19.7%) are smaller than
those who are from industries (80.3%). It is
obvious that the majority of the respondents
who have e-Learning systems in their
organizations are from industries rather than
students. Figure 11 depicts the line chart of
field * organizational e-Learning systems.
Table 2 Field * Organizational
E-Learning Systems Cross Tabulation
Field
WO/ EL
W/ EL
Total
Students 29
(38.2%)
13
(19.7%)
42
(29.6%)
From
Industries
47
(61.8%)
53
(80.3%)
100
(70.4%)
Total
76
(100.0%)
66
(100.0%)
142
(100.0%)
Chi-Square
Value
X
2=5.78 df=1 n=142
0% 20% 40% 60% 80% 100% Without E-Learning SystemsWith E-Learning Systems
Student From Industries
Figure 12 Field * Organizational E-Learning
Systems
e Department
The chi-square value is 2.642 (df=1, n=142)
and the p-value is .104 (p>0.05) which means
that there is no significant difference. Thus we
conclude that whether the respondents have
e-Learning systems in their organizations do
not have significant difference in non-IT or IT
departments.
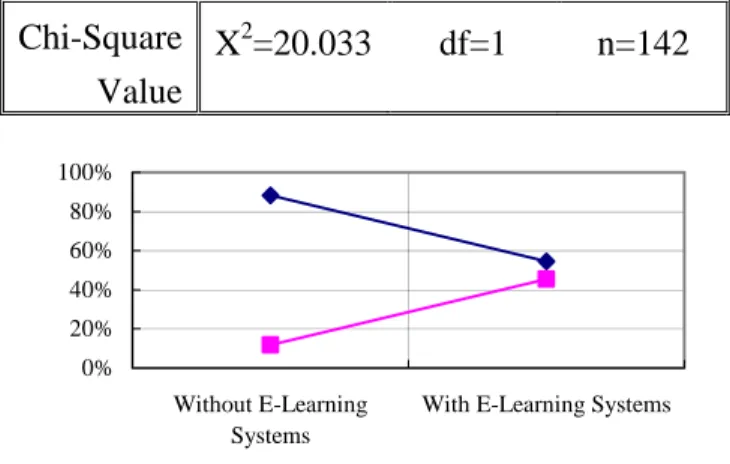
f Role in Implementation of E-Learning
System
The relationship between the respondents’
roles in implementations of e-Learning systems
and whether they have e-Learning systems in
their organizations is shown in Table 3. The
chi-square value is 20.033 (df=1, n=142) and
the p-value is .000 (p<0.001) which means that
there is a significant difference. In order to find
out which role group has more respondents, the
percentages of the two role groups in Table 3
are compared. When comparing the
respondents who have no e-Learning systems in
their organizations, it is clear that the
respondents who have no experiences of
implementing e-Learning systems accumulate
greater percentage (88.2%) than those who
have (11.8%). However, if comparing the
respondents who have e-Learning systems in
their organizations, the percentages of
respondents who have no experiences of
implementing e-Learning systems (54.5%) and
who have (45.5%) are very close. Therefore,
we conclude that most of the respondents who
have no e-Learning systems in their
organizations also have no experiences of
implementing e-Learning systems. Figure 13
depicts the line chart of role * organizational
e-Learning systems.
g Experiences on Using e-Learning Systems
The relationship among the respondents’
experiences on using e-Learning systems and
whether they have e-Learning systems in their
organizations is shown in Table 4. The
chi-square value is 24.506 (df=1, n=142) and
the p-value is .000 (p<0.001) which means that
there is a significant difference. In order to
figure out which experience group has more
respondents among those who have e-Learning
systems in their organizations, the percentages
of the two experience groups are compared. It
is obvious that the respondents with
experiences show greater percentage (87.9%)
than those who do not (12.1%). Thus we
conclude that the majority of the respondents
who have e-Learning systems in their
organizations also have experiences of using
e-Learning systems. Figure 14 depicts the line
chart of experience * organizational e-Learning
systems.
After the analysis of the chi-square test, we
conclude that only working field, role and
experience have significant differences between
the respondents who have no e-Learning
systems in their organizations and those who
have. The respondents who have e-Learning
systems in their organizations are mostly from
industries and have experiences of using
e-Learning systems. However, the majority of
the respondents who have no e-Learning
systems in their organizations also have no
experiences of implementing e-Learning
systems.
Table 3 Role * Organizational
E-Learning Systems Cross Tabulation
Role
WO/ EL
W/ EL
Total
Not Join
67
(88.2%)
36
(54.5%)
103
(72.5%)
Join 9
(11.8%)
30
(45.5%)
39
(27.5%)
Total
76
(100.0%)
66
(100.0%)
142
(100.0%)
Chi-Square
Value
X
2=20.033 df=1 n=142
0% 20% 40% 60% 80% 100% Without E-Learning SystemsWith E-Learning Systems
Not Join the Implmentation Join the Implementation
Figure 13 Role * Organizational E-Learning
Systems
Table 4 Experiences * Organizational
E-Learning Systems Cross Tabulation
Experience
WO/ EL
W/ EL
Total
Have no
Experienc
e
39
(51.3%)
8
(12.1%)
47
(33.1%)
Have
Experience
37
(48.7%)
58
(87.9%)
95
(66.9%)
Total
76
(100.0%)
66
(100.0%
)
142
(100.0%
)
Chi-Square
Value
X
2=24.506 df=1 n=142
0% 20% 40% 60% 80% 100% Without E-Learning SystemsWith E-Learning Systems
Have no Experience Have Experience Figure 14 Experiences *
Organizational E-Learning Systems
The following sections explain the results of factor analysis and Cronbach’s alpha test, which are carefully calculated using SPSS version 10.0. It uses the extraction method of principal components and varimax rotation. Additional information regarding the results is also described, such as factor loadings, eigenvalues, percentages of variance and Cronbach’s alpha values.
Every factor is labeled a new name which reflects the characteristics of the items it contains. Items are ordered according to their factor loadings (from highest to lowest) and grouped according to factors. However, if the difference between the item’s highest and second highest factor loadings is less than 0.15, the item is eliminated.
7.1 Analysis of Four Barriers
The factors analysis result of barriers indicates that there are two factors with eigenvalues greater than 1.0. A two-factor solution is suggested after examining the results (see Table 5).
Component one is labeled “Cost and Unawareness” and accounted for 33.372% of the variance. It includes “cost too high” and “unawareness”. The reliability (internal consistency) is 0.3702. Component two is labeled “Immaturity” and accounted for 30.031% of the variance. It includes “technology immaturity” and “solution immaturity”. The reliability is 0.3848.
Table 5 Factor Analysis of Barriers
Component & Factor
Loading
Item
1: Cost and
Unawareness
2:
Immaturity
B1 Cost
too
High
.811 -5.373E-02
B4 Unawareness
.682
.141
B2 Technology
Immaturity
-9.541E-02
.900
B3 Solution
Immaturity
.451
.606
Eigenvalue 1.335
1.201
% of Variance
33.372%
30.031%
Cronbach’s Alpha
0.3702
0.3848
Note. Boldface indicates highest factor
loadings.
Table 6 Factor Analysis of Reasons
Component &
Factor Loading
Item
1: Training
Effectiveness
2: New
Revenue
R3 Provide
24
x 7 Full
time
Training
.834 6.830E-02
R5 New
Training
Technology
.830
.164
R9 Flexible
Learning
.793
.289
R11 Customer
On-Line
Learning
.782
.132
R4 Reduce
Training
Time
.757
.228
R1 Increase
Competence
.738
.385
R6 Reduce
Training
Cost
.547
.378
R10Á
Win-Win
Situation
.538
.431
R8 Decrease
Time
Spending
on Selling
-7.382E-02
.886
R7 Increase
Revenue
.248
.672
R2Á Stay
Innovative
.464
.550
R12Á
Enhance
Customer
Satisfaction
.428
.507
Eigenvalue 4.796
2.457
% of Variance
39.964%
20.477%
Cronbach’s Alpha
0.9033
0.5678
Note. Boldface indicates highest factor
loadings.
Á indicates the difference
between two factor loadings is less
than 0.15.
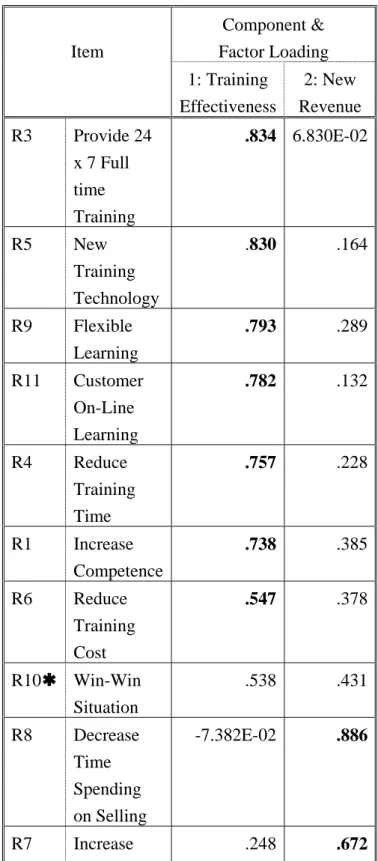
7.2 Analysis of Reasons for Implementation
The factor analysis result of reasons indicates that there are two factors with eigenvalues greater than 1.0. A two-factor solution is suggested after examining the results (see Table 6).
Component one is labeled “Training Effectiveness” and accounted for 39.964% of the variance. It includes all the sub-items about training. The reliability is 0.9033. Component two is labeled “New Revenues” and accounted for 20.477% of the variance. It includes “decrease time spending on selling” and “increase revenue”. The reliability is 0.5678.
7.3 Analysis of Vendor Consideration
The factor analysis result of vendor consideration indicates that there is one factor with eigenvalue greater than 1.0. A one-factor solution is suggested after examining the results (see Table 7).
Component one is labeled “Vendor Consideration” and accounted for 62.289% of the variance. It contains all the items in vendor consideration. The reliability is 0.8658.
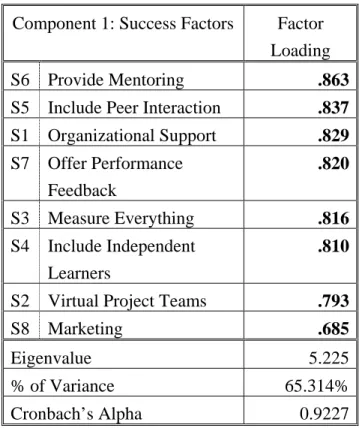
7.4 Analysis of Success Factors
The factor analysis result of success indicates
that there is one factor with eigenvalue greater than
1.0. A one-factor solution is suggested after
examining the results (see Table 8).
Component one is labeled “Success” and
accounted for 65.314% of the variance. It contains
all the items in success. The reliability is 0.9227.
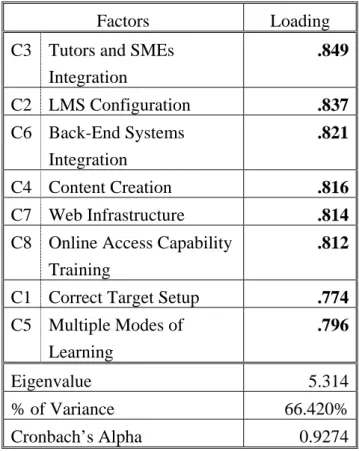
7.5 Analysis of Challenge Factors
The factor analysis result of challenge indicates that there is one factor with eigenvalue greater than 1.0. A one-factor solution is suggested after examining the results (see Table 9).
Component one is labeled “Challenge” and accounted for 66.420% of the variance. It contains all the items in challenge. The reliability is 0.9274.
Table 7 Factor Analysis of Vendor Consideration
Component 1: Vendor
Consideration
Factor
Loading
V3
Service Quality
.911
V2
Technology Integration
.892
V4
Implementation
Experience
.875
V1
Content
.840
V5
Implementation Cost
.723
V6
Reputation
.344
Eigenvalue 3.737
% of Variance
62.289%
Cronbach’s Alpha
0.8658
Note. Boldface indicates highest factor
loadings.
Table 8 Factor Analysis of Success Factors
Component 1: Success Factors
Factor
Loading
S6
Provide Mentoring
.863
S5
Include Peer Interaction
.837
S1
Organizational Support
.829
S7
Offer Performance
Feedback
.820
S3
Measure Everything
.816
S4
Include Independent
Learners
.810
S2
Virtual Project Teams
.793
S8
Marketing
.685
Eigenvalue 5.225
% of Variance
65.314%
Cronbach’s Alpha
0.9227
Note. Boldface indicates highest factor
loadings.
Table 9 Factor Analysis of Challenge Factors
Factors Loading
C3 Tutors and SMEs
Integration
.849
C2 LMS
Configuration
.837
C6 Back-End
Systems
Integration
.821
C4 Content
Creation
.816
C7 Web
Infrastructure
.814
C8 Online Access Capability
Training
.812
C1 Correct Target Setup
.774
C5 Multiple Modes of
Learning
.796
Eigenvalue 5.314
% of Variance
66.420%
Cronbach’s Alpha
0.9274
Note. Boldface indicates highest factor loadings.
8. T-Test of Seven Extracted Factors
T-test is conducted to examine whether there are significant differences between the above seven factors and whether the respondents have e-Learning systems in their organizations. The seven factors are “Cost and Unawareness” and “Immaturity” under barriers, “Training Effectiveness” and “New Revenues” under reasons for implementation, “Vendor Consideration”, “Success” and “Challenge”.
8.1 Barriers
The t-test result of “Cost and Unawareness” (t=-2.147; p<0.05) from t-test shows significant differences between the respondents who have no e-Learning systems in their organizations and those who have. However, the result of “Immaturity” (t=-.773; p>0.05) from t-test does not have significant difference. The mean value of “Cost and Unawareness” from the respondents who have no e-Learning systems in their organizations is 6.8158; while from those who have is 6.2879. It is obvious that the respondents who have no e-Learning systems in their organizations emphasize more on “Cost and Unawareness” than those who have (see Table 10).
Table 10 Group Statistics of Cost and
Unawareness
Group Mean
t-valu
e
p-valu
e
c Without
6.8158 -2.147
0.034
Organizational
E-Learning
Systems
d With
Organizational
E-Learning
Systems
6.2879
8.2 Reasons for Implementation
The t-test results of both “Training Effectiveness” (t=-.162; p>0.05) and “New Revenues” (t=.987; p>0.05) do not show significant differences between the respondents who have no e-Learning systems in their organizations and those who have.
8.3 Vendor Consideration
The t-test result of “Vendor Consideration” (t=-1.009; p>0.05) does not have significant differences between the respondents who have no e-Learning systems in their organizations and those who have.
8.4 Success
The t-test result of “Success” (t=-.683; p>0.05) does not have significant differences between the respondents who have no e-Learning systems in their organizations and those who have.
8.5 Challenges
The t-test result of “Challenge” (t=-.964; p>0.05) from t-test does not have significant differences between the respondents who have no e-Learning systems in their organizations and those who have.
At the end, we conclude that only “Cost and Unawareness” have significant differences between the respondents who have no e-Learning systems in their organizations and those who have. Furthermore, the respondents who have no e-Learning systems in their organizations obviously consider it more important than those who have. On the contrast, regardless the respondents who have e-Learning systems in their organizations or not, they do not significantly differ in the attitudes toward other remaining factors.
9. Conclusion
9.1 New Findings
The following represents the new findings of this investigation. They are gathered from the results of chi-square test, factor analysis and t-test.
c Results of Chi-Square Test
The results of chi-square test indicate that the majority of the respondents who have e-Learning systems in their organizations are mainly from industries. Most of the respondents who have not e-Learning systems in their organizations also have not experiences of implementing e-Learning systems.
d Results of Factor Analysis
From the results of factor analysis, only the two factors in barriers have reliabilities lower than 0.4 which indicates low internal consistencies. However, the other five factors have reliabilities higher than 0.7 which represents high internal consistencies.
e Results of T-Test
When examining the results of t-test, the respondents who have not e-Learning systems in their organizations emphasize more on “Cost and Unawareness” than those who have. However, whether the respondents have e-Learning systems in their organizations, they do not have significant different attitudes toward the other six factors which are “Immaturity”, “Training Effectiveness”, “New Revenues”, “Vendor Consideration”, “Success” and “Challenge”.
9.2 Contributions
The following represents the seven contributions of this investigation. They are approaches and considerations, advantages and disadvantages of e-Learning systems for e-Business, elementary concepts and understanding, useful information, examples of benefits, where corporations stand and references from other e-Learning stakeholders
c Basic Approaches and Considerations
There are some basic approaches and considerations proposed to help the corporations who are just getting started with the implementations of e-Learning systems for e-Business. d Advantages and Disadvantages of E-Learning Systems for
E-Business
It advises the decision makers what the advantages and disadvantages are. They shall balance from the situations they choose, and avoid the failures from other people’s experiences. Different stakeholders shall know their own responsibilities and jobs.
e Elementary Concepts and Understanding
The elementary concepts and understanding about the implementations of e-Learning systems are introduced. It also gives a good e-Learning guide and roadmap. No matter the reader is a beginner or an expert, this paper can enrich his / her e-Learning knowledge.
f Useful Information
All the analytical results in the study provide useful information on how the respondents rate on all the critical factors proposed. The information leads corporations to have a successful e-Learning system for e-Business.
g Benefits
If corporations know respondents’ attitudes toward the barriers, barriers are easier to be solved. By knowing the reasons for implementation, corporations can propose a sound e-Learning project. The results of vendor consideration can aid to choose an appropriate one. The rates of success and challenge factors undoubtedly give strong evidences for a better e-Learning system.
h Where Corporations Stand
With a clear understanding of these results, corporations know where they stand. Furthermore, they can setup corresponding strategies and objectives which lead them to a smooth implementation of e-Learning system for e-Business. i References from other Stakeholders
The vendors of e-Learning solutions can figure out what end-users emphasize the most when choosing suitable vendors. Different stakeholders shall consider all the perspectives. By doing so, they can understand what others feel toward a better implementation of e-Learning systems for e-Business.
9.3 Limitations
There are five points of limitations must be acknowledged. All of them are listed and explained in the following. They are time, manpower, demographic, response rate, validity, flexibility and reliability limitations.
c Time and Manpower Limitation
Due to the limited time and manpower, there are still spaces for further investigation.
d Demographic Limitation
Most of the respondents came from Hsin Chu Science Park and National Chiao Tung University, so the results are limited to these areas.
e Response Rate and Validity
As people tend to dislike questionnaires, thus a low sample size is gathered. Furthermore, the conditions under which the questionnaires are finished cannot be controlled.