HOSPITAL QUALITY INFORMATION FOR PATIENTS IN TAIWAN: CAN THEY UNDERSTAND IT?
6
0
0
全文
(2) S.-H. Cheng et al.. descriptions of Taiwan’s health care system, the NHI program, and the impact of the NHI implementation are available elsewhere [9,10]. It should also be noted that the quality of care varies significantly among health care providers in Taiwan. Medical specialist training programs and specialty certificates were started in 1988, but approximately 30% of practising physicians have not undergone any form of specialist training as yet [11]. The hospital accreditation system, which was implemented in 1978 by Taiwan’s Ministry of Education and Department of Health (DOH), issues a level of accreditation, determined by an expert team’s on-site inspection of a hospital’s size, capability, and quality of performance. There are five levels, which in descending order of size are: medical center and quasi-medical center, regional hospital and quasiregional hospital, district teaching hospital, specialty teaching hospital, and district hospital [12]. In 1999, 170 of the 700 hospitals nationwide had not been accredited. The 18 medical center hospitals together with the 51 regional hospitals provided 69.4% of the national total of in-patient services [13]. Many of the small-sized hospitals without accreditation or with a lower accredited level were considered less qualified in terms of medical equipment and/or clinical capability. A hospital’s reputation or its bed size was the only information that people could obtain in order to select a preferred hospital. In 1999, to improve the management of hospital quality, the DOH launched a project to standardize hospitals’ quality reporting systems. The project is entitled ‘Taiwan Quality Indicator Project’ [14], and its main purpose is to collect and provide quality information for hospital administrators (but not for the public). The Bureau of NHI, on the other hand, would like to produce some kind of quality information, similar to a report card system, to facilitate the selection of appropriate hospitals by consumers. However, the majority of the quality indicators under development are clinical- or expert-based indicators. It is important to know whether or not Taiwanese consumers can understand these commonly used quality indicators, and what their perceptions of these indicators represent. Answers to these questions may provide valuable insights for the future release of hospital performance information.. Methods Study setting Seven hospitals in northern Taiwan were selected for this study. Two of the seven hospitals were medical centers, four were regional hospitals, and the remaining hospital was a district teaching hospital. In order to obtain a homogeneous sample population for comparisons among hospitals, only those patients admitted into the general internal, general surgery, and gynecology departments of these hospitals were considered as potential candidates for our study. We chose patients rather than community residents because these subjects were more sensitive to. 156. and interested in quality issues concerning health care. The investigation period of six weeks ran from 24th February to 2nd April 1999. Every week, the seven hospitals provided a list of patients admitted to one study ward within each of the three departments. Study participants Patients over the age of 18 years who were on the list provided to us were selected for interview. The interviewers consisted of six students studying for a Masters degree at the Institute of Health Policy and Management, National Taiwan University. Since the nationwide average length of hospital stay was ten days, interviews were conducted in the hospital wards approximately one week after patients had been admitted. Patients who were not willing to answer or not capable of answering our structured questionnaire were excluded from the study. These patients who were excluded were more likely to be female or to have more severe conditions. Unfortunately, no detailed information for these patients was available in this study, and we could not be sure that the interviewed patients were representative of the original sample. Outcome measures We started the investigation by asking the interviewees whether they could judge the quality of a hospital’s equipment, technical competence, and medication in general. The following three questions were asked: (1) Can you tell whether the equipment in a hospital is sufficient or not? (2) Can you judge the excellence of physicians’ technical competence in a hospital? and (3) Can you judge the quality of prescribed drugs used in a hospital? If the subject’s answer was ‘yes’ to any of the questions, we then asked what this opinion was based on. Possible reasons for different opinions were collected and itemized according to answers provided in pre-tests given to 30 patients. These pre-tests took the form of in-depth interviews, while multiple-choice questions with open answers were asked in formal interviews. We then continued to explore the interviewees’ ability to understand currently used quality indicators. After considering the required items in the Taiwan Hospital Accreditation System and the characteristics of the structure– process–outcome nature, we chose seven commonly used indicators. These were: (1) degree of patient satisfaction; (2) rate of hospital-acquired infection; (3) level of accreditation; (4) percentage of specialist doctors out of total number of doctors; (5) rate of medical malpractice claims; (6) rate of unscheduled readmission; and (7) mortality rate 48 hours after surgery (see Appendix). We asked the interviewees if they could understand the meaning of each of the seven indicators. If the answer was ‘Yes’, we then asked whether that indicator could be representative of a hospital’s quality of care. Percentage comparisons and factors associated with the interviewees’ knowledge of quality information were analyzed..
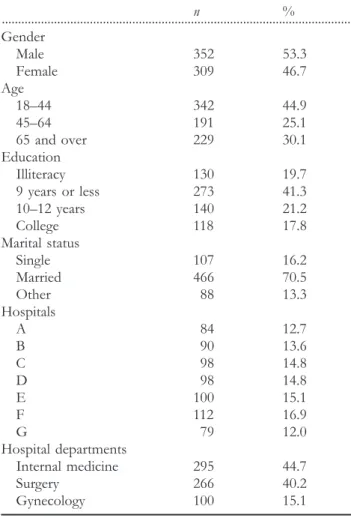
(3) Quality information in Taiwan. Table 1 Characteristics of the subjects interviewed and their distribution by hospital and hospital department (n=661). Table 2 Patients’ ability to judge medical quality and the reasons for their judgments. n % ............................................................................................................ Gender Male 352 53.3 Female 309 46.7 Age 18–44 342 44.9 45–64 191 25.1 65 and over 229 30.1 Education Illiteracy 130 19.7 9 years or less 273 41.3 10–12 years 140 21.2 College 118 17.8 Marital status Single 107 16.2 Married 466 70.5 Other 88 13.3 Hospitals A 84 12.7 B 90 13.6 C 98 14.8 D 98 14.8 E 100 15.1 F 112 16.9 G 79 12.0 Hospital departments Internal medicine 295 44.7 Surgery 266 40.2 Gynecology 100 15.1. n % ............................................................................................................ Can you tell whether the equipment in a hospital is sufficient or not? No 331 50.1 Yes 330 49.9 Basis of judgment1 1. Reports in the mass media 33 10.0 2. Hospital reputation/recommendation from family 114 34.5 3. Size of that hospital 62 18.8 4. Consult with friends who are familiar with medicine 24 7.3 5. Being referred from other hospitals 10 3.0 6. Previous experience of that hospital 164 49.7 7. Other reasons 11 3.3 Can you judge the excellence of physicians’ technique? No 329 49.8 Yes 332 50.2 Basis of judgment1 1. Recovery from illness 227 68.4 2. Second opinion from other doctors 16 4.8 3. Confidence in doctors 89 26.8 4. Own medical knowledge 14 4.2 5. Other reasons 26 7.8 Can you judge the quality of a hospital’s medication? No 453 68.5 Yes 208 31.5 Basis of judgment1 1. Self-paid medication is better than insurance-paid 13 6.3 2. Recovery after taking the medicine 169 81.3 3. Lack of side effects 44 21.2 4. Own medical knowledge 9 4.3 5. Other reasons 9 4.3. Results Characteristics of the participants The overall response rate for the interview was approximately 55.4%. Essential details of the sample population are summarized in Table 1. Of the 661 patients successfully interviewed, 46.7% were female. The mean age of the sample was 53.3 years in the largest subgroup of patients (44.9%) in the 18–44 years age group. Approximately 19.7% of the subjects were illiterate, 41.3% of them had completed nine years or less of education, and only 17.8% of them had been to college. Seventy percent of the subjects were married, while 16.2% of them were single. Although the seven hospitals varied significantly with regards to the number of beds (450–1500), only one ward from each of the three departments in every hospital was selected, in order to balance the patient source. The numbers of patients from each hospital who were successfully interviewed differed, with the proportion ranging from 12.0% (79 patients) in hospital G to 16.9% (112 patients) in hospital F. The majority of patients (44.7%) had been admitted to general internal medicine departments, 40.2% had been. 1. Multiple choice items.. admitted to general surgery departments, and only 15.1% were in the gynecology department. Ability to judge hospital quality We began our investigation by asking patients three questions about their ability to judge a hospital’s quality of care (Table 2). Firstly, they were asked whether or not they could judge the sufficiency of a hospital’s equipment. Of the 661 subjects, 49.9% of them answered ‘yes’. The most frequently provided reasons on which their judgment was based were their previous experience of that hospital (49.7%), the hospital’s reputation or recommendation from family and friends (34.5%), and the size of the hospital (18.8%). Secondly, the interviewees were asked whether they could. 157.
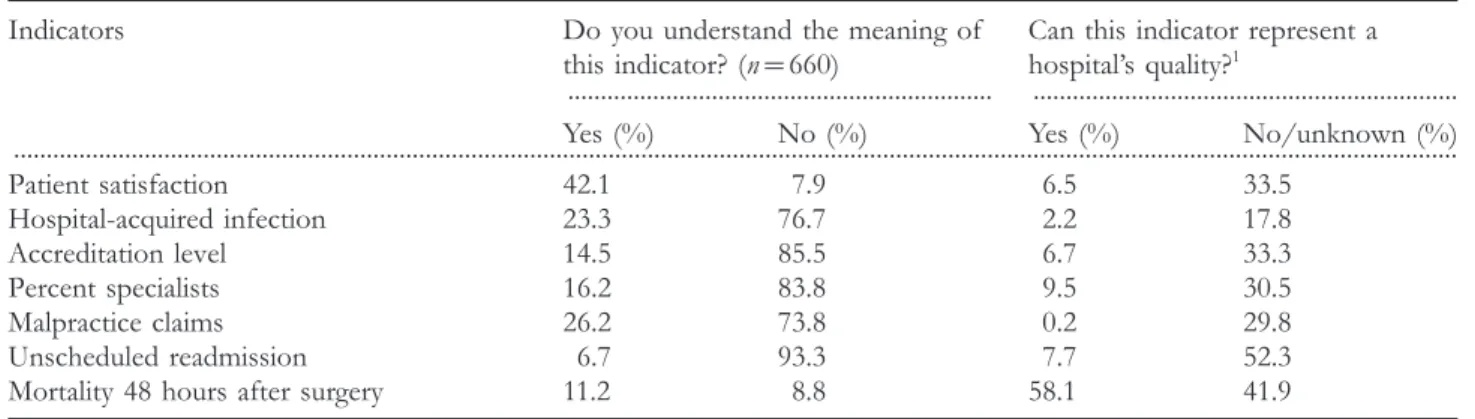
(4) S.-H. Cheng et al.. Table 3 Patients’ knowledge of commonly used quality indicators Indicators. Do you understand the meaning of Can this indicator represent a this indicator? (n=660) hospital’s quality?1 ................................................................. ................................................................. Yes (%) No (%) Yes (%) No/unknown (%) .............................................................................................................................................................................................................................. Patient satisfaction Hospital-acquired infection Accreditation level Percent specialists Malpractice claims Unscheduled readmission Mortality 48 hours after surgery. 42.1 23.3 14.5 16.2 26.2 6.7 11.2. 7.9 76.7 85.5 83.8 73.8 93.3 8.8. 6.5 2.2 6.7 9.5 0.2 7.7 58.1. 33.5 17.8 33.3 30.5 29.8 52.3 41.9. 1 Here, the numbers of subjects questioned were different for each indicator because only those persons who answered ‘Yes’ to the ‘Understand’ question were asked this ‘Represent’ question.. judge the excellence of physicians’ technical competence in a hospital. A total of 50.2% of the subjects reported ‘yes’. They based their judgment on their recovery from illness (68.4%) or on their confidence in the physician (26.8%). Thirdly, they were asked whether or not they could judge the quality of the medication they were being prescribed. Only 31.5% of the patients claimed that they were able to do this. The most important criteria upon which their judgments were based were their recovery from illness (81.3%) or the lack of side effects they experienced (21.2%). Generally speaking it was not easy for patients to judge the quality of hospital services, their opinions being based mainly on their own experiences or on those of others. When examining the factors associated with the interviewees’ ability to judge hospital quality in bivariate analyses, we found no significant factors related to judgment of the quality of technical competence or prescribed medication. However, some factors were associated with the ability of interviewees to judge hospital quality. Younger patients or those with higher levels of education tended to be better able to provide answers in an informed manner. On the other hand, subjects admitted to the internal medicine departments tended to be less able to make informed judgments. A possible explanation for this finding is the fact that patients in the internal medicine department were more likely to be older and less educated. Knowledge of commonly used quality indicators We next explored interviewees’ understanding of seven commonly used hospital quality indicators. Patients were asked whether or not they knew the meaning of each indicator. If the response to one indicator was ‘yes’, we asked the following question: can this indicator represent a hospital’s quality? Results showed that, in most cases, the subjects did not understand these indicators (Table 3). The most recognized indicator was ‘patient satisfaction’. However, only 42.1% of the subjects answered that they understood its meaning. The rest of the indicators were barely recognizable, or even unfamiliar, to the subjects. For each indicator, less than 30%. 158. of the respondents reported having any knowledge of its meaning. Two of the outcome indicators, unscheduled readmission and mortality 48 hours after surgery, were the least familiar, with only 6.7 and 11.2% of the respondents, respectively, indicating any form of understanding of the indicator terminology. Most of the indicators were considered to be representative of hospital quality by those who understood their meanings. Hospital-acquired infection had the highest consensus (81.2%) as a representative indicator for hospital quality. Unscheduled readmission was the indicator with the least agreement (47.7%) by the respondents. Most of the other indicators had consensus rates of 58.1–69.5%. The results also showed that a proportion of the subjects who understood the indicators were unsure about whether or not the indicators could represent a hospital’s quality. Personal and hospital characteristics were significantly associated with each subject’s knowledge of the quality indicators. A summary of the associations is presented in Table 4. Age and education were significantly associated with all of the quality indicators, while younger persons or those with a higher level of education were found to have a better knowledge of the indicators. Single individuals also showed a greater understanding of the indicators. Patients admitted to internal medicine departments showed poorer knowledge of quality indicators compared with patients in surgery or gynecology departments. Differences in patients’ age and education among the three departments may account for this finding to some extent.. Discussion Since no previous studies had focused on consumers’ abilities to judge hospital quality in specific dimensions, our findings provide first-hand evidence regarding this issue. Over half of the interviewees could not judge a hospital’s quality based on the sufficiency or excellence of its equipment, technical competence, or medication used. People generally made.
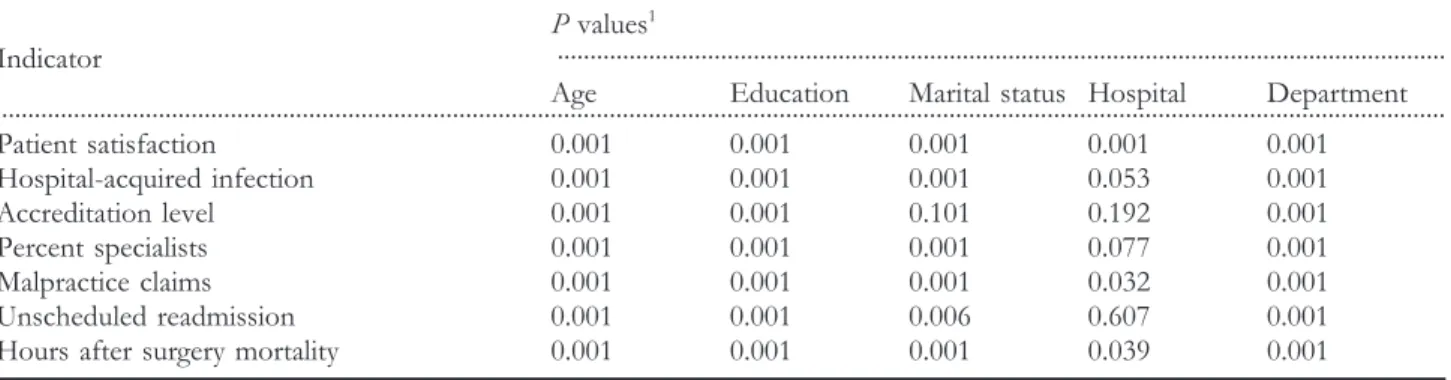
(5) Quality information in Taiwan. Table 4 Factors associated with patients’ knowledge of quality indicators P values1 ........................................................................................................................................ Indicator Age Education Marital status Hospital Department ............................................................................................................................................................................................................................. Patient satisfaction Hospital-acquired infection Accreditation level Percent specialists Malpractice claims Unscheduled readmission Hours after surgery mortality. 0.001 0.001 0.001 0.001 0.001 0.001 0.001. 0.001 0.001 0.001 0.001 0.001 0.001 0.001. 0.001 0.001 0.101 0.001 0.001 0.006 0.001. 0.001 0.053 0.192 0.077 0.032 0.607 0.039. 0.001 0.001 0.001 0.001 0.001 0.001 0.001. 1. The probabilities presented are based on Chi-square tests for associations. Gender is not associated with any of the indicators and is not presented in the table.. judgments based on their own experiences (whether or not they recovered from their condition) or on a hospital’s reputation. Some interviewees even reported that they could tell the excellence of technical competence because they had confidence in the doctors. Most of the reasons given were based on an individual’s experience rather than on statistical proof. If hospital performance data are available to the public, can individuals make use of the information? The answer is probably ‘no’. Respondents in our study had very limited knowledge about commonly reported quality indicators. Only 42.1% of the subjects understood the meaning of ‘patient satisfaction’, and less than 30% of the sample reported that they knew the meanings of indicators such as ‘hospitalacquired infection’ or ‘hospital accreditation level’. Younger people or those with a higher level of education were more likely to understand the meanings of the indicators. Public education may increase community awareness about quality indicators. However, without these additional efforts, our findings warn of the possible failure or limited impact of the release of performance information in the future. On the other hand, experience-based information from family or friends provides the major impetus for provider selection in Taiwan as well as in the US. In the US, efforts have been made to facilitate people’s selection among health plans; the HEDIS (Health Plan Employer Data and Information Set) and CAHPS (Consumer Assessment of Health Plans Study) programs are good examples [15–18]. Under Taiwan’s universal health insurance, however, people require information for choosing hospitals and physicians rather than health plans. Given the multiple dimensions of quality of care and the fact that people are unable to understand the commonly used quality indicators, it is important to develop a set of consumer-assessed quality indicators as a supplement to expert-based quality indicators [1,19–22]. The limitations of this study also need to be addressed. Knowing that quality information might be unfamiliar to the public, we purposely selected hospitalized patients as study subjects. The patients were hospitalized at the time of interview, but they might have searched for this kind of information prior to admission. In addition, the low response. rate and possibly non-representative interviewees could limit generalization of the findings to the Taiwanese population in general. We are also aware that there are pros and cons concerning the release of hospital performance data [23,24]. Accuracy and timeliness of the information provided, as well as the ‘representative’ problem of the quality indicators, are the main concerns regarding release of information. On the other hand, providing relevant information to facilitate consumer selection of hospitals is considered beneficial to health care purchasers. Only accurate and representative quality information can help people to make informed choices. This study is just the beginning of efforts to address this issue in Taiwan. To construct a better set of quality indicators that are accurate and useful for consumers is an important task for the future.. Acknowledgements The authors would like to thank Dr Robert Brook for his advice and Miss Shu-Hui Chen for her assistance. This study was supported partially by a grant from the National Health Research Institute (NHRI-GT-EX89P801P) in Taiwan.. References 1. Davies HT, Marshall MN. Public disclosure of performance data: does the public get what the public wants? Lancet 1999; 353: 1639–1640. 2. Marshall MN, Shekelle PG, Leatherman S, Brook RH. The public release of performance data: what do we expect to gain? A review of the evidence. J Am Med Assoc 2000; 283: 1866–1874. 3. Robinson S, Brodie M. Understanding the quality challenge for health consumers: the Kaiser/AHCPR survey. J Qual Improv 1997; 23: 239–244. 4. Schneider EC, Epstein AM. Use of public performance reports: a survey of patients undergoing cardiac surgery. J Am Med Assoc 1998; 279: 1638–1642.. 159.
(6) S.-H. Cheng et al.. 5. Mennemeyer ST, Morrisey MA, Howard LZ. Death and reputation: how consumers acted upon HCFA mortality information. Inquiry 1997; 34: 117–128. 6. Eddy DM. Performance measurement: problems and solutions. Health Affairs 1998; 17: 7–25. 7. Hibbard JH, Jewett JJ, Legnini MW, Tusler M. Choosing a health plan: do large employers use the data? Health Aff 1997; 16: 172–180. 8. Hsieh HS, Cheng SH, Lew-Ting CY. Demand for provider selection information of inpatients: findings from a preliminary study. Chin J Public Health (Taipei) 2000; 19: 437–445 (in Chinese). 9. Peabody JW, Yu JC-I, Wang Y-R, Bickel SR. Health system in the Republic of China: formulating policy in a market-based health system. J Am Med Assoc 1995; 273: 777–781. 10. Cheng SH, Chiang TL. The effect of universal health insurance on health care utilization in Taiwan: results form a natural experiment. J Am Med Assoc 1997; 278: 89–93. 11. Chang MS. The status and planning of specialty manpower. Presented at the Conference on Health Manpower Planning and Forecasting in Taiwan, November 28–29, 2000, Taipei, Taiwan (Conference material, in Chinese). 12. Huang P, Hsu Y-HE, Tan K-Y, Hsueh Y-SA. Can European external peer review techniques be introduced and adopted into Taiwan’s hospital accreditation system? Int J Qual Health Care 2000; 12: 251–254. 13. Department of Health, Taiwan: Statistics of hospital services volume in Taiwan, 1999. http://www.doh.gov.tw/new/focus/ org2/national/a890714–26.htm (in Chinese).. 21. Cleary PD, Edgman-Levitan S. Health care quality: incorporating consumer perspectives. J Am Med Assoc 1997; 278: 1608–1612. 22. Zaslavsky AM, Beaulieu ND, Landon BE, Cleary PD. Dimensions of consumer-assessed quality of Medicare managedcare health plans. Med Care 2000; 38: 162–174. 23. Berwick DM, Wald DL. Hospital leaders’ opinions of the HCFA mortality data. J Am Med Assoc 1990; 263: 247–249. 24. Chassin MR, Hannan EL, DeBuono BA. Benefits and hazards of reporting medical outcomes publicly. N Engl J Med 1996; 334: 394–398.. Appendix The definitions of the seven quality indicators used in the study Note: The purpose of the study was to examine the patients’ knowledge of these commonly used quality indicators in Taiwan; the definitions of these terms were not introduced to the interviewees. The definitions listed below are the meanings of the indicators we bore in mind while conducting the survey. 1. Patient satisfaction. The proportion of patients who revealed that they felt satisfied with the services provided to them during their stay in the hospital via a standardized questionnaire survey. 2. Rate of hospital-acquired infection. Numerator: the number of patients who were infected with certain kinds of pathogen after 72 hours’ stay in a hospital; denominator: the number of patients discharged from that hospital during a specified period of time e.g. one month.. 14. Liaw HS, Yang HC. Introduction of the Taiwan Quality Indicator Project. Hospital 2000; 33: 7–11 (in Chinese).. 3. Hospital accreditation level. The hospitals’ levels of providing care certified by the Department of Health, Taiwan, ROC every three years, including medical center, regional hospital, district teaching hospital, and district hospital, etc.. 15. Corrigan JM, Nielsen DM. Toward the development of uniform reporting standards for managed care organizations: the Health Plan Employer Data and Information Set (Version 2.0). Jt Comm J Qual Improv 1993; 19: 566–575.. 4. Percentage of specialist doctors. Numerator: the number of physicians who have at least one specialty certificate in a hospital; denominator: the number of all physicians (full-time employees or equivalent) in that hospital.. 16. Thompson JW, Bost J, Ahmed F et al. The NCQA’s quality compass: evaluating managed care in the United States. Health Aff 1998; 17: 152–158.. 5. Rate of medical malpractice claims. Numerator: the number of malpractice claims occurring in a hospital during a specified period of time e.g. a year; denominator: the number of in-patients and emergency patients in that hospital during that time period.. 17. McGee J, Kanouse DE, Sofaer S, Hargraves JL, Hoy E, Kleimann S. Making survey results easy to report to consumers: how reporting needs guided survey design in CAHPS. Consumer Assessment of Health Plans Study. Med Care 1999; 37: MS32–40. 18. Veroff DR, Gallagher PM, Wilson V et al. Effective reports for health care quality data: lessons from a CAHPS demonstration in Washington State. Int J Qual Health Care 1998; 10: 555–560. 19. Sisk JE, Dougherty DM, Ehrenhaft PM, Ruby G, Mitchner BA. Assessing information for consumers on the quality of medical care. Inquiry 1990; 27: 263–272. 20. Lansky D. Measuring what matters to the public. Health Aff 1998; 17: 40–41.. 160. 6. Rate of unscheduled readmission. Numerator: the number of patients who were readmitted to the same hospital for the same or related conditions within 15 days that were not scheduled at the time of the previous discharge; denominator: the number of in-patients discharged during a specified period of time, e.g. one month. 7. Mortality rate 48 hours after surgery. Numerator: the number of patients at one hospital who underwent anesthesia and died within 48 hours; denominator: the number of patients who underwent anesthesia at this hospital during a specified period of time, e.g. one month.. Accepted for publication 22 November 2001.
(7)
數據
相關文件
2 I understand that the Education Bureau (EDB) will take such measures as they consider necessary and appropriate to verify the information provided in and/or in relation to this
3.Secondary research may reduce the levels of trust between participants and researchers.. 4."One size fits all" approach also risks losing
Taiwan customer satisfaction index (TCSI) model shown in Figure 4-1, 4-2 and 4-3, developed by the National Quality Research Center of Taiwan at the Chunghua University in
In order to ensure a sufficient quality and quantity of city water, the engineering quality of relevant works must be controlled so as to comply with the designed
To response the increasing competition between banks and it variation in operation, it is an significant issue to upgrade service quality and consolidate customer satisfaction,..
According to “Hospice Medical Regulations” of Taiwan, our scheme can provide the better electronic medical service environment and it may provide patient, doctor, hospital,
Group, R.C., Convalescent plasma in patients admitted to hospital with COVID-19 (RECOVERY): a randomised controlled, open-label, platform trial.. Lopez-Medina, E., et al., Effect
In the simulated environment, his patients gain confidence to face the challenges in the real world.. Here is a successful story to demonstrate VR’s
