國
立
交
通
大
學
電子工程學系 電子研究所
碩
士
論
文
適用於可攜式三通道 ECG 遠端照護系統晶片之有
效的心跳變異率處理器設計
An Effective Heart Rate Variability Processor Design for
Portable 3-Lead ECG Monitoring System-on-Chip
研 究 生:曾少彥
指導教授:方偉騏 教授
適用於可攜式三通道 ECG 遠端照護系統晶片之有效的心跳變異率處理
器設計
An Effective Heart Rate Variability Processor Design for Portable
3-Lead ECG Monitoring System-on-Chip
研 究 生:曾少彥
Student:Shao-Yen Tseng
指導教授:方偉騏 教授
Advisor:Wai-Chi Fang
國 立 交 通 大 學
電子工程學系 電子研究所
碩 士 論 文
A ThesisSubmitted to Department of Electronics Engineering and Institute of Electronics
College of Electrical and Computer Engineering National Chiao Tung University
in partial Fulfillment of the Requirements for the Degree of
Master in
Electronics Engineering
December 2010
Hsinchu, Taiwan, Republic of China
適用於可攜式三通道 ECG 遠端照護系統晶片之有效的心跳變異率
處理器設計
研 究 生:曾少彥
指導教授:方偉騏 教授
國立交通大學電子工程學系 電子研究所中文摘要
全球年齡六十五歲以上的人口數量已被預測在 2025 年之前將回從 1990 年的 3.75 億人成長至 7.61 億人。不久,社會將面臨老年化社會所帶來的醫療照顧問題。 因此,整合型健康照護系統已成為研究人員在最近幾年的重要課題。本論文提出一 可攜式整合型心電圖監測與分析系統,並包含一心率變異性之時頻分析處理器。所 提出之主要的系統包括一個資料轉換器控制器,一心率變異性的處理器,以及一無 損壓縮引擎。系統由資料轉換器控制器從前端電路獲得心電圖的數據,並傳送至心 率變異性分析處理器做時頻分析。本論文所提出之心率變異性處理器利用 Lomb Periodogram 進行心率變異性之時頻分析。Lomb Periodogram 適合分析非平均取樣數 據之頻譜分析,並已應用於心率變異性時頻分析降低誤差。在心電數據使用 UART 輸出之前並利用無損壓縮引擎將資料以壓縮率 2.5 的比例壓縮。利用 UART 傳輸介 面,本系統可以藍牙技術等無線傳輸方式將所分析之心率變異性分析以及原始心電 數據傳送至遠端工作站供顯示或進一步分析。本論文所提之系統具有多項操作模式, 並且可以透過遠端設置。此整合型健康心電照護系統設計使用聯華電子 90 奈米 CMOS 技術下線晶片。 關鍵字:心率變異率分析、整合型生醫系統、藍芽傳輸、可攜式系統、數位信號處 理An Effective Heart Rate Variability Processor Design for Portable
3-Lead ECG Monitoring System-on-Chip
Student:Shao-Yen Tseng Advisor:Wai-Chi Fang
Department of Electronics Engineering and Institute of Electronics National Chiao Tung University
Abstract
The worldwide population of people over the age of 65 has been predicted to more than double from 375 million in 1990 to 761 million by 2025. Soon society will be faced with the problem of providing medical care for an aged population. Therefore, ubiquitous health-care systems have become an important topic of research in recent years. In this thesis, an integrated system for portable electrocardiography (ECG) monitoring with an on-board processor for time-frequency analysis of heart rate variability (HRV) is presented. The main function of the system comprises an analog-to-digital converter (ADC) controller, an HRV processor, and a lossless compression engine. ECG data acquired from front-end circuits through the ADC controller is passed to the HRV processor for HRV analysis. The HRV processor performs real-time analysis of time-frequency HRV using the Lomb periodogram and a sliding window configuration. The Lomb periodogram is suited for spectral analysis of unevenly sampled data and has been applied to time-frequency analysis of HRV in the proposed system. The ECG data is compressed using the lossless compression engine before output using UART and has a
compression ratio of 2.5. Bluetooth is used to transmit analyzed HRV data and raw ECG data to a remote station for display or further analysis. The system has many operating modes and can be configured remotely. The integrated ECG health-care system design proposed in this thesis has been implemented using UMC 90nm CMOS technology.
Keywords: ECG, Heart Rate Variability, HRV, Integrated Health-Care System, Bluetooth,
誌謝
這幾年在碩士班的求學過程中,除了修習了眾多的相關專業課程,同時也領 悟到學無止境的道理以及正確的研究態度與方法。我想在此感謝國立交通大學提供 如此完善的一個學習環境,並且很榮幸能身為電子工程所的研究生。 本論文的完成主要感謝我的指導老師方偉騏教授在研究上的指導與推動。方 老師提供了理想的研究環境與豐富的資源,使得研究能夠很快的進入狀況。除了研 究上的支持外,老師也讓我學習到諸多寶貴的經驗如團體合作的技巧與正確的研究 方法。另外,要感謝我的口試委員:林進燈教授與楊騰芳教授,特別抽空參與碩士 學位口試。 同時我也感謝實驗室的同學給予我的支持、建議、指導與協助。希望各位在 自己的研究旅途中也能像我一樣得到如此多的幫助與溫暖。Table of Contents
中文摘要 ... i
Abstract ... ii
誌謝 ... iv
Table of Contents ... v
List of Tables ... vii
List of Figures ... viii
Chapter 1 Introduction ... 1
1.1 Modern Health Care and Monitoring ... 1
1.2 Previous Literature ... 3
1.3 Scope and Contributions ... 5
1.4 Organization of the Thesis ... 6
Chapter 2 An Integrated ECG Health-Care System ... 7
2.1 The Electrocardiogram ... 7
2.2 ECG in Clinical Practice ... 10
2.3 Overview of Medical ECG Systems ... 12
2.4 Long Term Medical Care ... 13
2.5 Emergency Scenarios ... 14
2.6 Cardiovascular Researches... 15
Chapter 3 A Time-Frequency Heart Rate Variability Processor ... 16
3.1 Heart Rate Variability ... 16
3.1.1 Overview ... 16
3.1.2 Practical Applications ... 17
3.2 Spectral Analysis of HRV ... 17
3.2.1 Power Spectral Density Estimation Methods ... 17
3.2.2 Lomb Periodogram ... 19
3.2.3 Time-Frequency analysis... 20
3.3 Design of the HRV Processor ... 20
3.3.1 RR Interval Calculation Unit ... 21
3.3.2 Data Windowing and Memory Control ... 23
3.3.3 HRV Analysis Unit ... 26
3.4 Performance and Analysis of the HRV Processor ... 29
3.4.2 Spectral Analysis of HRV ... 31
3.5 Discussions... 40
Chapter 4 ECG System-on-Chip Design ... 41
4.1 Overview of System Architecture ... 41
4.2 ADC Controller ... 42 4.3 System Control ... 44 4.4 HRV Processor ... 45 4.5 Compression Engine ... 46 4.6 Wireless Communication ... 48 4.7 System Verification ... 51
Chapter 5 Chip Implementation ... 53
5.1 Chip Tape-out ... 53
5.2 Setup of the Integrated ECG Health-Care System ... 56
Chapter 6 Conclusion and Future Work ... 58
6.1 Conclusion ... 58
6.2 Future Work ... 59
List of Tables
Table 3-1 Specifications of the HRV Analysis Unit ... 27
Table 3-2 LF/HF Ratio Comparison of Artificially Generated RRI (LF/HF = 1) ... 34
Table 3-3 LF/HF Ratio Comparison of Artificially Generated RRI with Spread Frequencies (LF/HF = 1) ... 36
Table 3-4 LF/HF Ratio Comparison of Artificially Generated RRI with Spread Frequencies (LF/HF = 0.5) ... 37
Table 4-1 Specifications of the Analog Front-End Circuits & ADC... 43
Table 4-2 Specifications of the Compression Engine ... 48
Table 4-3 Comparison of Bluetooth and IEEE802.15.4 ... 50
Table 5-1 Description of the I/O Pads ... 54
List of Figures
Figure 1.1 (a) Average age of the population in Taiwan, 1906-2006 (b)
Number of people below the age of 25 in Taiwan, 1984-2006 [2] ... 2
Figure 2.1 Schematic of electrodes placed around the heart [25] ... 8
Figure 2.2 Placement of chest leads [25] ... 9
Figure 2.3 Representation of a normal ECG ... 9
Figure 2.4 Electrophysiology of the heart. [26]... 10
Figure 2.5 Application areas of ECG diagnosis [26] ... 11
Figure 2.6 Medical ECG Devices [31] ... 12
Figure 2.7 (a) Full-size wireless ECG cart from Cardiac Science (b) Portable ECG monitor from GE Healthcare (c) Wearable ECG device from Card Guard ... 13
Figure 2.8 Projected elderly, total dependency ratios based on official United Nations statistics, 1950-2050 [33] ... 14
Figure 3.1 (a) The R-peak to R-peak intervals of the ECG (b) The derived non-equidistant RR interval time series ... 18
Figure 3.2 Overall architecture of the HRV processor ... 21
Figure 3.3 Flowchart of the QRS detection algorithm by Pan and Tompkins ... 22
Figure 3.5 Flow chart for R peak detection ... 23
Figure 3.4 Structure of the derivative function ... 23
Figure 3.6 The sliding window configuration. RR intervals are divided into one minute frames. A window of data consists of two frames with one frame overlapping with the previous window. ... 24
Figure 3.7 Usage of the SRAM memory for RR intervals. Xi are the frames of
the corresponding windows. ... 25
Figure 3.8 Architecture of the memory control unit ... 26
Figure 3.9 Frequency domain sampling of the Lomb periodogram ... 27
Figure 3.10 Architecture of the HRV analysis unit. ... 29
Figure 3.11 Resulting output from each stage of the QRS detection algorithm for (a) clean ECG signal and (b) ECG signal with motion artefact. The detected output pulse corresponds to the R peak of the original ECG signal. ... 30
Figure 3.12 Beat detection of ECG signals with different types of distortion ... 31
Figure 3.13 Flow chart for artificial generation of RR intervals ... 33
Figure 3.14 Generated artificial RR interval time series ... 33
Figure 3.15 Power spectral density of artificially generated RRI using 1024 point FFT, Lomb-Scargle periodogram, and our fixed point Lomb method. The RRI time series is re-sampled at 4 Hz before FFT analysis. ... 34
Figure 3.16 (a) Distribution of the HF and LF frequencies (b) Artificial RRI time series with spread frequencies (LF/HF = 1) ... 35
Figure 3.17 Power spectral density of artificially generated RRI with spread frequencies using 1024 point FFT, Lomb-Scargle periodogram, and our Lomb method using fixed point (LF/HF = 1) ... 35
Figure 3.18 Artificial RRI time series with spread frequencies (LF/HF = 0.5) ... 36
Figure 3.19 Power spectral density of artificially generated RRI with spread frequencies using 1024 point FFT, Lomb-Scargle periodogram, and our Lomb method using fixed point (LF/HF = 0.5) ... 37
Figure 3.20 Time-frequency distribution of artificial RR interval with HF frequency sweep using the Lomb periodogram ... 38
Arrhythmia Database as calculated using 1024 point FFT, Lomb-Scargle
periodogram, and our Lomb method using fixed point. ... 39
Figure 3.22 Time-frequency HRV analysis using Lomb TFD of EKG data from the MIT-BIH arrhythmia database. ... 39
Figure 4.1 Overall system architecture for the ECG SOC. The data path is represented using red wires, and control signals are represented using black wires. ... 42
Figure 4.2 The ADC Controller module ... 43
Figure 4.3 Command packet and corresponding configuration ... 44
Figure 4.4 System control flow diagram ... 45
Figure 4.5 (a) Architecture of the HRV processor (b) Top level module view of the HRV processor ... 46
Figure 4.6 Architecture of the lossless compression engine ... 47
Figure 4.7 Photo of the IEEE802.15.4 wireless module ... 49
Figure 4.8 The flow of the round-robin scheme ... 49
Figure 4.9 Photo of the Bluetooth module ... 50
Figure 4.10 Verification of the HRV processor on FPGA ... 51
Figure 5.1 Floorplan and I/O plan ... 53
Figure 5.2 Chip layout of the ECG SOC with on-board HRV processor ... 55
Figure 5.3 Circuit schematic of the front-end sensor circuit ... 57
Chapter 1 Introduction
1.1 Modern Health Care and Monitoring
The worldwide population of people over the age of 65 has been predicted to more than double from 375 million in 1990 to 761 million by 2025 [1]. In Taiwan, the average age of the population has risen from 26 to 36 within the past twenty years and the number of people below the age of 25 is rapidly decreasing [2]. Figure 1.1 shows the aging trend in Taiwan. Within a few years, society will be faced with the problem of an aged population. The aging of the population will inevitably add to the burden of an already fragile healthcare system plaguing virtually every major government. An aged population implies a decline in the size of the working age group, producing a higher percentage of persons above 65 years of age. This trend is sure to result in a shortage of medical personnel, which, along with rising costs will leave hospitals unable to meet the medical requirements of a growing number of elderly patients. In addition, the development of long-term health care environments has lagged behind compared to advancements in medical science. Therefore, whilst life expectancy is seen to be rising, inadequacies in daily healthcare may decrease the quality of life of the aged.
Technology can assist in alleviating the burden of doctors and medical staff by introducing a shift in the healthcare infrastructure [3]. While current medical paradigms are able to provide extremely professional and precise responses to illnesses that may occur, it is fundamentally a clinic-oriented structure optimized for crisis reaction. To maintain prolonged wellness, technologies designed for healthcare can be pushed towards the home environment enabling real-time monitoring, diagnosis, and prevention. Such technologies help senior patients become more independent in terms of healthcare, and can benefit the general population by providing a ubiquitous healthcare environment.
(a) (b)
Figure 1.1 (a) Average age of the population in Taiwan, 1906-2006 (b) Number of
people below the age of 25 in Taiwan, 1984-2006 [2]
For the elderly, heart disease is a major concern in the health factor. Cardio-vascular diseases (CVD) are the leading cause of death in many countries including the United States [4]. CVD claimed 831,272 lives in the United States in 2006. Of the total deaths, 82% of the victims were above the age of 65 [5]. As the elderly population increases, death from CVD is a rising concern, thus technologies in at-home healthcare and patient monitoring products for early detection of heart disease have become more important than before.
At home healthcare technologies can enable early detection of diseases or complications resulting from diagnosed or dormant CVD. After detection, preventive steps can be taken to neutralize the problem before it develops into a life-threatening condition. Moreover, monitoring systems can provide remote observation of patients during prolonged treatment and indicate the state of recovery. Thus, whether used in formal (physician-based) or informal (user-based) applications, ubiquitous healthcare for cardiac related diseases is essential in improving the quality of life and longevity of our gradually aging population.
1.2 Previous Literature
The study and development of portable systems for wireless medical healthcare services has gained widespread interest in the last 10 years. With the recent advancements in wireless technology, many studies have been devoted to the design and implementation of a portable ECG healthcare system for a wide range of applications. In the MyHeart Project, the genres of ECG monitoring where classified into four types of concept applications. The MyHeart Project [6,7] is a project of the European Union aiming to develop intelligent systems for the prevention and monitoring of cardiovascular diseases. The classified concepts encompassed four major user scenarios: exercise sessions of the healthy (Activity Coach), those at risk for developing CVD (Take Care), sufferers from a cardiac event (Neurological Rehabilitation), and chronically ill people (Heart Failure Management). The MyHeart Project proposed the prevention and early diagnosis of CVD through the use of wearable technology for monitoring of vital body signs in these scenarios. By processing the measured data and giving (therapy) recommendations to the user of the system, complications from CVD could be reduced and general wellness can be maintained.
In many studies, the respective proposed systems correspond to the ‘Take Care’ and ‘Heart Failure Management’ frameworks classified by the MyHeart Project. In such studies, developed structures include acquisition of ECG signals and wireless transmission to a remote station for use in at-home monitoring or emergency applications. In [8] a wireless 2-lead ECG system was developed to monitor vital signs and cardiac information with ultimate deployment in intensive care units (ICU). Their system used radio frequencies in the ISM band at either 433MHz or 916MHz for wireless transmission. A 433 MHz FM/FSK transmitter was also used in [9] for wireless transmission of ECG signals. The application of wireless ECG realized a medical
biotelemetry. The use of standard wireless technologies has also been proposed in many studies. Bluetooth was used in [7,10,11,12] for wireless transmission of ECG, whereas ZigBee was used in [13,14,15,16,17].
Biotelemetry and portable ECG systems can offer a more convenient way of acquiring ECG data, however, biotelemetry alone cannot solve the crisis that an aging population poses because it keeps expensive, overburdened doctors and nurses in the loop [18]. In other words, it is limited in that a remote PC station and physician is still required for further analysis and diagnosis of data. Integrated systems with functions for online and real-time analysis can offer a better solution to ubiquitous health-care and have also been widely studied.
[19] proposed a computer based wireless system for online acquisition, monitoring and digital processing of ECG. In [20] a wireless system for ECG recordings and real-time analysis of heart rate variability (HRV) was proposed. In their system, a PDA was used to receive ECG data from Bluetooth and run the software analysis program for time-domain analysis of HRV. Such studies adopt the use of software at the backend of the system for analysis of the ECG data. Other studies, however, focus on analysis of data on-the-fly before wireless transmission by using system-on-chip (SOC) technology. By performing analysis through SOC design, the system can have more mobility and portability. [21] proposed an SOC design with embedded ECG signal processing. An ARM processor was used for system control, wireless communication, and a simple beat detection function in their design. An ECG SOC design for wearable cardiac monitoring devices was also proposed in [22] which included an online QRS detector. In [23] a heart rate variability monitoring and assessment system-on-chip was proposed where the beat-to-beat intervals were calculated and used for HRV classification. Their studies would later go on to propose an application-specific integrated circuit (ASIC) designed for digital heart rate variability (HRV) parameter monitoring [24].
Portable ECG medical devices have become more and more widespread in recent years. The potential to acquire and monitor the ECG of a patient is a prospective ability with viable applications in telemedicine, long-term health care, and various researches. However, such devices only provide a solution to wireless signal acquisition and very often a remote science station is still needed for off-line analysis of the ECG signal. For a truly ubiquitous health care system, the system should not only include basic functions for signal acquisition, but also provide the ability to perform accurate real-time analysis of the ECG data. Through SOC technology, integrated systems are able to acquire ECG data, perform real-time data analysis, and transmit data wirelessly all in a single low area and low power chip solution.
1.3 Scope and Contributions
In this thesis, a portable multi-channel ECG monitoring system-on-chip with an on-board effective HRV processor is proposed. The system includes a front-end circuit and ADC controller for acquisition of three-channel ECG. From the ECG, time-frequency analysis of HRV can be performed using a developed on-board HRV processor. A compression engine is included in the system to reduce the size of data before wireless transmission. In the proposed SOC, the UART standard is used as the method of output. This makes the system more flexible, allowing for connection with Bluetooth, ZigBee, PC, or any other device using UART.
This thesis also consists of a study on spectral estimation methods for short-term frequency domain HRV analysis as well as implementation considerations for SOC design. The capabilities of the Lomb periodogram for spectral analysis over traditional methods such as Fourier transform were compared and analyzed. A VLSI implementation of an HRV processor for time-frequency HRV analysis using the Lomb periodogram has also been proposed. Finally, the HRV processor has been integrated into an ECG SOC for
applications in portable ECG monitoring and real-time HRV analysis. The proposed ECG SOC is suitable for use in portable wireless ECG medical devices where the system is constrained by power and area issues. Through an integrated SOC design, a portable system for on-line real-time analysis of ECG data that is low-power and low-area is possible. The significance of this ECG SOC is to enable practical development of portable real-time heart monitoring and analysis systems.
1.4 Organization of the Thesis
The organization of this thesis is as follows. Chapter 2 describes the importance and characteristics of an integrated ECG health-care system. The mechanics of ECG is first described as well as uses in clinical practice in this chapter. Next an overview of medical ECG systems and application scenarios is given. In Chapter 3 the proposed HRV processor is presented from algorithm study to final VLSI design. Section 3.3 details the design considerations and architecture of the HRV processer. The performance and analysis of the HRV processor is given in Section 3.4. In Chapter 4 the design of the integrated ECG SOC from a top-down view is described. The basic modules and functions of the SOC design are presented in this chapter. Chapter 5 the details and specifications of the final chip implementation is presented. Finally, the conclusion and future work is given in Chapter 6.
Chapter 2 An Integrated ECG Health-Care System
An integrated ECG health care system differs from many commercial ECG medical devices in that the functions are not restricted to only ambulatory monitoring. Through integration, the system can provide the user with on-line real-time analysis of the acquired ECG data in addition to being compact and portable. An integrated portable system with the ability to wirelessly transmit data has the following advantages:
• Increase the mobility of patients and allow for normal routines
• Reduce the stress of patients from being attached to a medical system
• More comfort during monitoring
• Increase the applicability of ECG health-care
• Provide on-the-fly analysis for immediate reaction
• A more in-depth monitoring of heart status
• Lower cost
In this chapter, the background of an integrated ECG health-care system is described. A review of the origins of ECG and clinical applications is given first. Section 2.3 presents an overview of commercial medical ECG systems. Finally, the scenarios where applications of integrated ECG health-care systems can be vital are given.
2.1 The Electrocardiogram
In the heart muscle cell, electric activation takes place by means of the same mechanism as in the nerve cell. Following this electric activation is the mechanical contraction of the heart muscles which form a heart beat in the cardiovascular system. This electrical activity of the heart during each heart beat can be recorded through electrodes attached to the skin placed around the heart and is referred to as the electrocardiogram (ECG).
ECG can be measured by recording the electrical potential between electrodes attached to the skin. Leads are placed on the four limbs and the electric potential between the right and left arms, and the left leg is measured with the right leg acting as ground. The schematic of leads placed on the limbs, called limb leads, and the corresponding measured channels are shown in Figure 2.1. The voltage difference between the left arm and right arm is named Lead I. The voltage difference between the left leg and right arm is named Lead II. And the voltage difference between the left arm and left leg is named Lead III.
Figure 2.1 Schematic of electrodes placed around the heart [25]
To gain a better perspective of the electrical activity of the heart, six more leads are attached to the chest, called chest leads, and the voltage potential with reference to ground is measured. The placement of the chest leads is shown in Figure 2.2. In this text, different types of ECG measurements are referred to by the number of channels that are recorded, for example 3-lead, 5-lead, or 12-lead ECGs. In 12-lead ECG ten leads, or electrodes, are attached and twelve channels of bio-potential signals are recorded.
Figure 2.2 Placement of chest leads [25]
The electrical impulses that are necessary for the heart to contract originate from the sinoatrial node (SA Node) located above the right atrium. The impulse from the SA node stimulates the atrial muscles causing both atria to contract and blood to flow into the ventricles. The signal then propagates to the atrioventricular node (AV node) located at the boundary between the atria and ventricles. A natural delay occurs at the AV node before the impulse continues down nerve fibers and stimulates ventricular contraction. The composition of these electrical signals forms a normal ECG. The representation of a normal ECG is shown in Figure 2.3 and the electrophysiology is shown in Figure 2.4.
Figure 2.4 Electrophysiology of the heart. [26] 2.2 ECG in Clinical Practice
The ECG is a diagnostic measure and record of the electrical activity of the heart and can be an essential tool for identifying cardiovascular abnormalities. The ECG allows diagnosis of a wide range of heart conditions. In clinical practice, it is possible to make accurate diagnosis of many diseases from the ECG. In myocardial infarction, commonly known as heart attack, the ECG can be used to identify if heart muscles have been damaged after the attack. It can also serve as major predictor of mortality after myocardial infarction [27]. Other main applications of diagnostic ECG include the following [26]:
• The electric axis of the heart
• Heart rate monitoring
• Disorders in the activation sequence
• Increase in wall thickness or size of the atria and ventricles
• Myocardial ischemia and infarction
• Drug effect
• Electrolyte imbalance
• Carditis
• Pacemaker monitoring
Apart from the abnormalities mentioned above and shown in Figure 2.5, ECG can also serve as an indicator of many other conditions. Disorders such as epilepsy [28] and obstructive sleep apnea [29,30] can also be implied through analysis of the ECG.
2.3 Overview of Medical ECG Systems
There are many types of medical ECG devices for ambulatory ECG monitoring systems each suited for different scenarios and usages. They can generally be divided into categories such as resting ECG system, stress testing system, ECG data management system, Holter monitor system, cardiac event monitoring system [31]. Examples of different types of ECG monitoring devices are shown in Figure 2.6.
Figure 2.6 Medical ECG Devices [31]
There are a number of companies that offer medical ECG devices which can range from large scale monitoring and analysis stations to smaller wearable wireless devices. Figure 2.7 show a few examples of medical ECG devices from different companies. However, even though many commercial products for ECG monitoring are available on the market, studies involving ECG systems are still on-going. The MyHeart project is a project of the European Union aiming to develop intelligent systems for the prevention
and monitoring of cardiovascular diseases [6,7].
2.4 Long Term Medical Care
Long-term care is a variety of services that provides medical and non-medical care to people who have a chronic illness or disability. Four out of ten people above the age of 65 will use a nursing home, and many will require long-term home care and other related services [32]. The Centers for Medicare and Medicaid Services (CMS) estimates that in 2006 about nine million men and women over the age of 65 in the US will need long-term care and by 2020, 12 million people will need long-term care. Figure 2.8 shows the projected elderly dependency ratio for various countries. In addition, long-term care is not restricted to the elderly. Younger people may also require a monitored health care environment. These may include children with disabilities, people with mental health problems, Alzheimer's disease, acquired immunodeficiency syndrome (AIDS), etc. Thus long-term care is an increasingly important structure of today’s health care system.
(a) (b) (c)
Figure 2.7 (a) Full-size wireless ECG cart from Cardiac Science (b) Portable
ECG monitor from GE Healthcare (c) Wearable ECG device from Card Guard
Figure 2.8 Projected elderly, total dependency ratios based on official United Nations statistics, 1950-2050 [33]
To account for the gradually rising number of people requiring long-term health care, biomedical devices can be used to care for more patients more efficiently. Portable wearable ECG devices can provide a method of monitoring patients without restriction of mobility. The person under long-term care will not be restricted to the monitoring system and will enjoy a more flexible lifestyle.
2.5 Emergency Scenarios
Another important application of an integrated ECG system is in emergency medical scenarios where ease of use of medical equipment is crucial for saving lives. During a medical emergency, whether or not the condition is heart related, the ECG can give critical information regarding the vital signs of the patient. With an integrated ECG
system, valuable time can be saved by reducing the complexity of a setup for ECG recording and at the same time provide more mobility in case the patient needs to be immediately moved.
In emergencies related to heart disease, sudden cardiac arrest is a sudden and often deadly condition that is one of the leading causes of death in many countries. Some heart attacks may come suddenly, yet most attacks start slowly with mild pain or discomfort and gradually grow into a full on heart attack. In such situations, an immediate view of the heart can mean the difference between life and death. With the help of an integrated ECG system, whether medical attention is required can be easily determined at an early stage. The portability of such systems also allows usage in critical and dire situations. 2.6 Cardiovascular Researches
Cardiovascular disease is one of the major causes of death, and is becoming alarmingly frequent in recent years. This rise in the incidence of cardiovascular diseases can be attributed to an unhealthy lifestyle, which includes lack of exercise and increased popularity of fast food. Stress from today’s fast-moving society can also be blamed for this rise. Therefore, researches into cardiovascular disease have gained ground as an important topic.
Cardiovascular researches strive to find an understanding of heart diseases, including their underlining causes, effects, and possible cures. These researches can be disease-based or patient-based, focusing on different aspects of a certain condition. Portable technologies which offer a convenient and efficient means of acquiring ECG data from a large group of test subjects can help in the research of many cardiovascular diseases. By simplifying the chore of data acquisition and online analysis, more effort can be put on investigation towards improving the survival rate and quality of life for people with cardiovascular disease.
Chapter 3 A Time-Frequency Heart Rate Variability Processor
3.1 Heart Rate Variability
3.1.1 Overview
Heart rate variability (HRV) is a normal physiological phenomenon where the interval between successive heart beats of an individual varies over time. The term “heart rate variability” has widely become the adopted term to describe the variations of both instantaneous heart rate and RR interval [34]. To understand the implications of HRV, the origins of the heart rate and HRV are first discussed.
In the human body, visceral functions are controlled by the autonomic nervous system (ANS). These functions include heart rate, digestion, perspiration, and respiration. Whilst some actions such as breathing may be controlled through conscious thought, visceral functions are generally involuntary. This is in contrast to voluntary motor functions controlled by the somatic nervous system (SNS), which together with the ANS formulates the peripheral nervous system (PNS).
The ANS classically consists of two main systems: the parasympathetic nervous system and the sympathetic nervous system. Sometimes the enteric nervous system, which directly coordinates the gastrointestinal system, may also be considered as part of the ANS. The parasympathetic and sympathetic nervous systems can be seen as two opposing branches exerting opposite effects on various internal organs. The parasympathetic nervous system regulates a ‘resting’ mechanism and causes heart rate and blood pressure to decrease. The sympathetic nervous system, however, provides a ‘fighting’ mechanism which increases heart rate and blood flow to muscles. The complementary nature of the two nervous systems allows humans to rest when possible and to react to mentally or physically stressful situations when required. The resulting state of the autonomic system due to influences of the sympathetic and parasympathetic
nervous system has become known as the sympathovagal balance.
3.1.2 Practical Applications
As the heart rate is largely under the control of the ANS, variations in heart rhythm can reflect the influences of the parasympathetic and sympathetic nervous systems. Under resting conditions the level of activity of the parasympathetic nervous system, or vagal tone, prevails [35], and contributes to the high frequencies (HF) of HRV. Low frequencies (LF) of the HRV can be associated with sympathetic activity which occurs in response to stress, exercise, and heart disease [36].
HRV has been shown to be an important indicator of cardiovascular health [34]. As the regulation mechanism of the heart is closely governed by the sympathetic and parasympathetic nervous systems, HRV is often used as a quantitative marker of the autonomic nervous system. Studies have shown that the HRV is an important indicator in many diseases and may contribute to a better treatment [36]. Applications of HRV have been applied to many forms of medical researches including studies in sleep apnea, patient monitoring after cardiac arrest[37], and use in intensive care units [38].
3.2 Spectral Analysis of HRV
Spectral analysis can provide insight into the intrinsic periodicities of HRV over a period of time. This can prove to be an effective method of analysis since HRV is a combined signal of super-imposed components relating to the ANS. Through spectral analysis the contributions of sympathetic and parasympathetic activity can be viewed in a much clearer perspective than time-domain analysis or geometrical methods. The following section gives a discussion of various spectral analysis methods as well as its suitability for frequency-domain HRV analysis.
3.2.1 Power Spectral Density Estimation Methods
In signal processing, power spectral density (PSD) is a method of estimating how the total power of a data sequence is distributed over different frequencies [39]. The PSD
is simply the spectrum of the signal; a representation of the signal using oscillations of various frequencies.
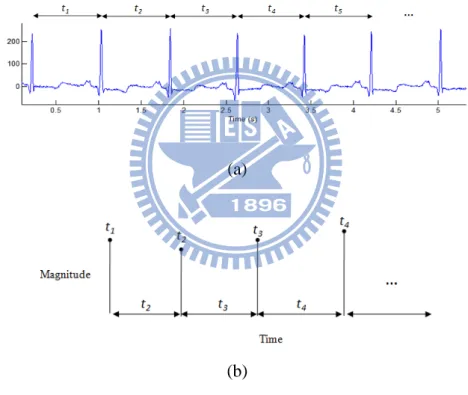
The time intervals between R-peaks, or RR intervals shown in Figure 3.1(a), formulate a time series with the intervals as the magnitudes as well as the distance to the next sample, as shown in Figure 3.1(b). In other words, it is an unequally sampled time series where the time distance to the next sample depends on the magnitude of the next sample. This results in complications in performing HRV analysis as traditional power spectral analysis methods require the data to be equidistantly sampled.
A commonly used method of estimating PSD is the Fast Fourier Transform (FFT). In order to perform spectral analysis using Fast Fourier Transform (FFT), the time series is required to be re-sampled using interpolation techniques. However, re-sampling as well as variation in usage of different interpolation schemes may cause errors to be introduced to
(a)
(b)
Figure 3.1 (a) The R-peak to R-peak intervals of the ECG (b) The derived
the final HRV analysis [40]. The main source of this error is the assumption that the RR intervals can be described by some underlying model of oscillation, whereas, in truth, it is a physiological phenomenon. Traditional spectral estimators require non-uniformly sampled data to be re-sampled or interpolated to generate an evenly sampled data series. However, even though numerous methods of re-sampling and various re-sampling frequencies have been studied [41], a universal approach has not yet been agreed upon. A method for selecting an appropriate re-sampling frequency for the RR series was proposed in [41], but different results of spectral analysis are still generated if different interpolation techniques are used [42].
To address the errors caused by re-sampling without straying from an area efficient portable solution, the Lomb periodogram is used to perform HRV analysis in our system.
3.2.2 Lomb Periodogram
Lomb developed a method for deriving the power spectral density of unevenly spaced data sets without the need for interpolation and re-sampling [43]. The Lomb periodogram has been shown to be a robust and accurate method for spectral analysis of HRV in subsequent studies [40,44,45].
The Lomb method uses least squares fitting to estimate the amplitude of a given sinusoid with angular frequency ωj over non-uniformly sampled data. In other words, the
power of the given sinusoid, PN(ωj), for a set of data points of length N is computed using
a least-squares fit to the model
𝑥(𝑡𝑖) = 𝐴𝑐𝑜𝑠�𝜔𝑗𝑡𝑖� + 𝐵𝑠𝑖𝑛�𝜔𝑗𝑡𝑖� + 𝑛(𝑡𝑖) (3.1)
for i=0,1,…,N, where n(ti)𝑛(𝑡𝑖) is noise. The Lomb transform is based on the DFT for
unevenly sampled signals given as
𝑋𝑁(𝜔) ≡ ∑ 𝑥𝑗 𝑗e−𝑖𝜔𝑡𝑗 (3.2)
time interval” basis [46], it is suitable for the analysis of non-uniform data. It is shown that in the case of equal spacing it reduces to the Fourier power spectrum [43]. The Lomb periodogram of unevenly sampled data is
𝑃𝑁(𝜔) ≡�∑�𝑥𝑗−𝜇� 𝑐𝑜𝑠 𝜔�𝑡𝑗−𝜏��
2
2𝜎2∑ 𝑐𝑜𝑠2𝜔�𝑡𝑗−𝜏� +
�∑�𝑥𝑗−𝜇� 𝑠𝑖𝑛 𝜔(𝑡𝑗−𝜏)�2
2𝜎2∑ 𝑠𝑖𝑛2𝜔(𝑡𝑗−𝜏) (3.3)
where 𝜇 and 𝜎 are the mean and variance, respectively, and 𝜏 is given as
𝜏 ≡ 2𝜔1 tan−1�∑ 𝑠𝑖𝑛 2𝜔𝑡𝑗
∑ 𝑐𝑜𝑠 2𝜔𝑡𝑗� (3.4) However, as the HRV is a reflection of physiological phenomena, it is considered to be a non-stationary signal. To monitor the changes of heart rate over a course of time, time-frequency spectral analysis is used. In our study, the Lomb periodogram is modified to be implemented as a time-frequency distribution.
3.2.3 Time-Frequency analysis
To allow better tracking ability of the time-varying components of the heart rate, the Lomb periodogram is modified to be implemented as a time-frequency distribution. Time-frequency analysis using Lomb periodogram can be performed by applying a
window 𝑤(𝑡) to the data and evaluating each segment individually. Using a sliding
window configuration 𝑤�𝑡𝑗− 𝑡� the time-frequency distribution 𝑃𝑁(𝑡, 𝜔) is obtained, giving
𝑃𝑁(𝑡, 𝜔) ≡ 𝑁�∑ 𝑥′𝑗𝑐𝑜𝑠 𝜔�𝑡𝑗��2+ 𝑁�∑ 𝑥′𝑗𝑠𝑖𝑛 𝜔(𝑡𝑗)�2 (3.5)
where 𝑥′ is the windowed zero-mean data at time 𝑡.
3.3 Design of the HRV Processor
it is crucial to decrease device size through an efficient algorithm and optimized hardware architecture. Low power and low cost is also an essential consideration when designing such systems. Therefore, a low area and low power HRV analysis processor has been designed. The real-time HRV processor comprises an RR interval calculation unit, a memory unit, and an HRV analysis unit. ECG data is sent into the processor, and the time intervals between heart beats are calculated through the RR interval calculation unit. The calculated RR intervals are stored in the on-chip memory and, using a sliding windowing scheme, time-frequency analysis of HRV is performed by the HRV analysis unit. The overall architecture of the proposed HRV processor is shown in Figure 3.2.
3.3.1 RR Interval Calculation Unit
Several QRS detection algorithms have been developed in literature [47], including detection through means of wavelet transforms [48,49], artificial neural networks [50,51], and non-linear transforms [52,53]. However, in consideration of architecture simplicity and real-time properties, the classical derivative-based QRS detection algorithm
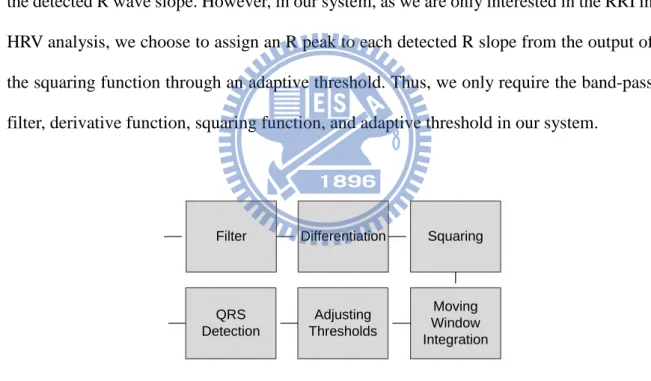
A flowchart demonstrating the signal processing steps of the Pan and Tompkins algorithm is shown in Figure 3.3. The ECG signal first passes through a set of linear processes, including a band-pass filter comprising a cascaded low-pass and high-pass, and a derivative function. Non-linear transformation is then employed in form of a signal amplitude squaring function. Finally, moving window integration is performed before an adaptive threshold is applied for detection of the QRS complexes.
The underlining principle of the algorithm is the detection of the slope of the R wave through the derivative function, amplified by the squaring function. The moving-window integration then provides wave-form feature information in addition to the detected R wave slope. However, in our system, as we are only interested in the RRI in HRV analysis, we choose to assign an R peak to each detected R slope from the output of the squaring function through an adaptive threshold. Thus, we only require the band-pass filter, derivative function, squaring function, and adaptive threshold in our system.
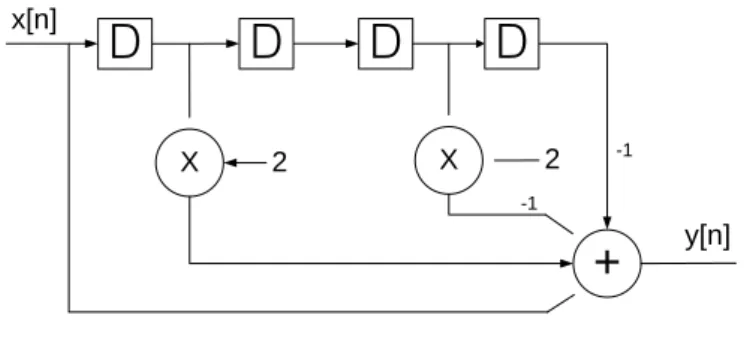
Differentiation is performed to identify the slope of the R wave in the QRS complex. The transfer function of the five-point derivative function is
𝐻(𝑧) = 1/8(−z−2− 2z−1+ 2z1+ z2) (3.6)
and the difference equation of the derivative function is
Differentiation Squaring Filter Adjusting Thresholds Moving Window Integration QRS Detection
𝑦[𝑛] = 1/8(x[n] + 2x[n − 1] − 2x[n − 3] − x[n − 4]) (3.7) The hardware implementation of the derivative function is shown in Figure 3.4.
After the derivative is calculated squaring is used to enhance the characteristics of the signal. Then a threshold is applied to the squared signal to detect the start of the QRS complex. The peak of the squared signal is identified as the R peak of the ECG data. Figure 3.5 shows the flow chart for the detection of the R peak.
Figure 3.5 Flow chart for R peak detection
3.3.2 Data Windowing and Memory Control
For evaluation of short term HRV, RR intervals of two to five minutes are suggested [34]. In our design, in order to be able to address the HF and LF components of HRV, a two minute window is adopted. Time-frequency analysis of HRV is achieved by performing spectral analysis on the RR intervals using a sliding window configuration. This produces a series of power spectra from sequential windows of data over time. To
X
D
+
X 2 2 x[n] y[n]D
D
D
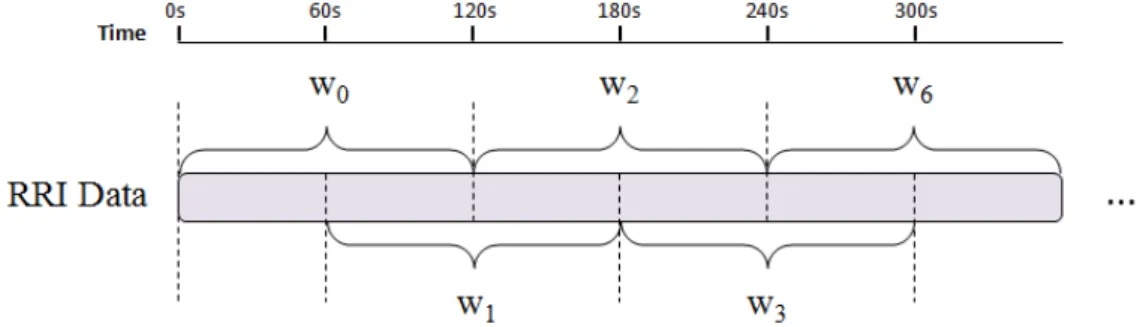
-1 -1ensure a smoother transition between windows, and to provide higher observability, the sliding window is configured to have fifty percent overlap. This implies that the window of data moves forward by one minute after every analysis of power spectra. The configuration of the sliding window is shown in Figure 3.6.
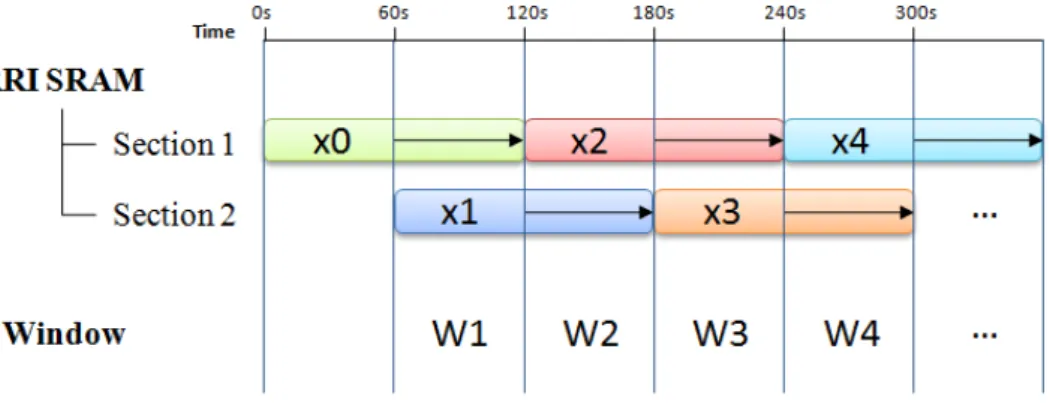
An SRAM memory is used to store the RR intervals before HRV analysis. The size of the memory depends on the maximum number of RR intervals obtainable in two minutes. As RR intervals are the time intervals between heart beats, the number of RR intervals should correspond to the number of beats. Thus, assuming that the maximum safe heart rate does not exceed 220 bpm [55], a 512 word SRAM memory is chosen. The overlap period between each window is one minute, so each minute of RR intervals, or frames, has to be stored separately. In our design, the SRAM memory is categorized into two sections to store the different frames of RR intervals so 256 words can be allocated for each minute of data. During one minute, data is stored into one section of the memory, after which the number of elements is noted and storage of data is switched to the second section using a path selector. After two minutes, the RR intervals are passed to the HRV analysis unit for spectral analysis. The scheme for SRAM memory usage is shown in Figure 3.7.
Figure 3.6 The sliding window configuration. RR intervals are divided into one
minute frames. A window of data consists of two frames with one frame overlapping with the previous window.
To output the RR intervals to the HRV analysis unit, a bank selector is employed to choose which section of the SRAM is currently active. After all RR interval data is read from one section the next section is selected. As spectral analysis requires the signal to be zero-mean, the mean of the data in each section is calculated and stored. This ensures that when the next window is encountered the overlapping section from the previous window has the correct mean value. The two mean values are summed to form the final mean of the data. Division of two is simplified to a bit-shift (or re-position of the fixed point). The architecture of the SRAM memory control unit is shown in Figure 3.8.
Figure 3.7 Usage of the SRAM memory for RR intervals. Xi are the frames of
data for one minute. The length of retention is marked by the arrows. Wi are the
3.3.3 HRV Analysis Unit
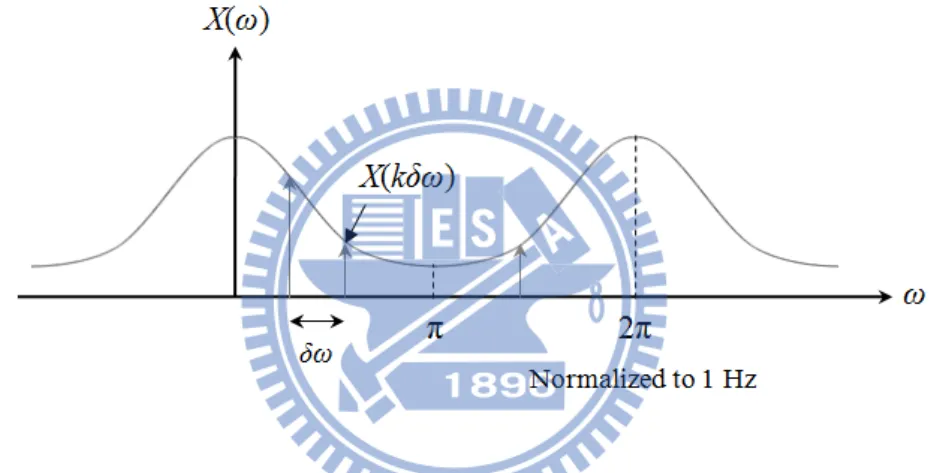
The HRV analysis unit comprises the hardware implementation of the Lomb periodogram given in (3.2). RR intervals are an aperiodic finite-energy signal and therefore have continuous spectra. This would be unrealistic in hardware implementation, so we suppose that the spectrum is periodically sampled. Considering that discrete-time sampled signals are periodic with period 2π [56], we can take N equidistant samples in the interval 0 ≤ ω < 2π with spacing δω= 2π/N. Evaluating (3.2) at ω= 2πk/N for k = 0, 1, …, N-1, we can obtain
𝑋
𝑁�
2𝜋𝑘𝑁�
= � 𝑥𝑗e−𝑖2𝜋𝑘𝑁 𝑡𝑗 𝑗 (3.8) = � 𝑥𝑗𝑐𝑜𝑠2𝜋𝑘𝑁 𝑡𝑗 𝑗 + 𝑖 � 𝑥𝑗𝑠𝑖𝑛2𝜋𝑘𝑁 𝑡𝑗 𝑗In spectral analysis of discrete-time equidistant data series, the spectrum is
normalized to the sampling rate. However, for the Lomb periodogram the time value 𝑡𝑗 is included in the calculation, therefore actual frequency values vary according to the unit of time used. In our design the RR intervals are represented using seconds, therefore, remembering that k = 0, 1, …, N-1, the spectrum is normalized to1 Hz (shown in Figure 3.9). The frequency ranges of the components in HRV are below 0.4 Hz, thus only less than half of the frequencies are required. To simplify the design, only frequencies over 0 to 0.5 Hz are analyzed. The number of points over this frequency range is selected to be 256 points which yields a frequency resolution of approximately 0.002 Hz per point.
Table 3-1 Specifications of the HRV Analysis Unit
Parameters Value
Frequency range 0 ~ 0.5 Hz
Points 256
Fixed point number of output coefficients
16
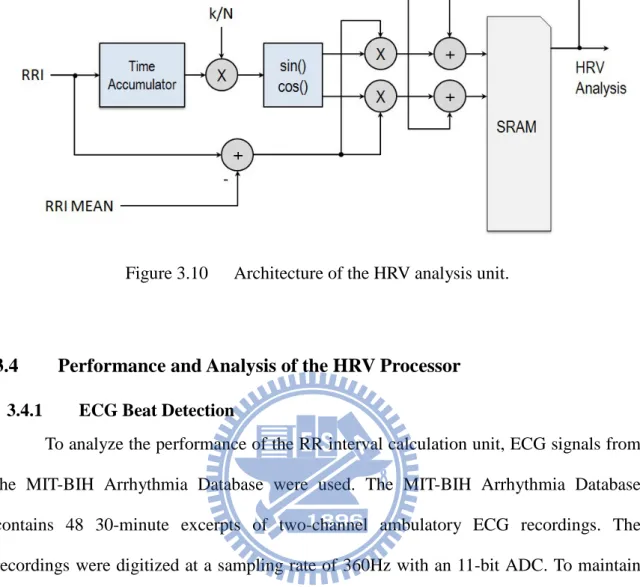
The Lomb periodogram is implemented in the HRV analysis unit using a recursive approach. The RR intervals are input into the HRV analysis unit sequentially and the HRV analysis unit calculates the Lomb coefficients recursively. The pseudo code of the hardware implementation is shown below.
To calculate the point in time of the current input, recall that RR intervals are the time intervals between beats, therefore the current point in time can be inferred from the sum of previous inputs. This is accomplished in our system using an accumulator. Inputs are added to the previous point in time to obtain the current time value. The time value is then multiplied with the index k, which is implemented by using a counter to increment 0 to N-1 for each input. Synopsys DesignWare is used to implement the sine and cosine functions before being multiplied with the RR interval inputs. The result is added to previous calculated coefficients stored in SRAM memory and updated after each calculation. To be able to read and write during the same cycle, synchronous two-port SRAM is used to store the coefficients. The architecture of the HRV analysis unit is shown in Figure 3.10
Pseudo code for hardware implementation of Lomb periodogram
for n = 1 to (Number of RR intervals) for k = 0 to 255 t = t + x[n]; x = x[n] ˗ µ; X(k) = X(k) + x * [cos(k/N * t) + i * sin(k/N * t)] ; end end
Figure 3.10 Architecture of the HRV analysis unit.
3.4 Performance and Analysis of the HRV Processor
3.4.1 ECG Beat Detection
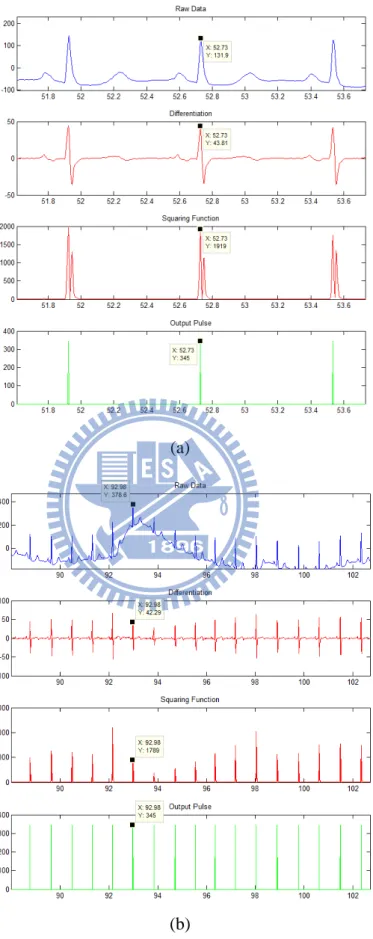
To analyze the performance of the RR interval calculation unit, ECG signals from the MIT-BIH Arrhythmia Database were used. The MIT-BIH Arrhythmia Database contains 48 30-minute excerpts of two-channel ambulatory ECG recordings. The recordings were digitized at a sampling rate of 360Hz with an 11-bit ADC. To maintain consistency with our system specification, the ECG signals were re-sampled to 256Hz with 10-bit precision before being used to test the performance of our beat detection unit. Only channel 1 (Lead II) of the two-channel ECG recording is used in our analysis.
Figure 3.11 shows the output of each stage in our beat detection unit: differentiation, squaring, and final output pulse. The output pulse can clearly pinpoint the R peak of a clean ECG signal and an ECG signal with motion artefact two within a precision of one sample. For ECG signals with various types of noise, artefacts, and distortion, the designed system is able to identify beats in most cases, as shown in Figure 3.12.
(a)
(b)
Figure 3.11 Resulting output from each stage of the QRS detection algorithm for (a) clean ECG signal and (b) ECG signal with motion artefact. The detected output
3.4.2 Spectral Analysis of HRV
3.4.2.1 Artificial RR Interval Data
To compare spectral analysis performance of different algorithms, an understanding of the underlining oscillations within the signal is required. Since this can rarely be done with real RR tachograms, an artificial signal that closely simulates the characteristics of RR intervals was generated to verify the performance.
short-term RR tachogram can be represented roughly as 0.25 Hz and 0.1Hz corresponding to the HF and LF regions respectively [57]. Thus the artificial RR signal is modelled as the oscillation of these two frequencies around the average heart rate. Assuming an average heart rate of 70 bpm, the artificial heart rate function can be modelled as
HR(t) = HR0 + AL∙ sin(2πfLt + θL) + AH∙ sin(2πfHt + θH) (3.9)
where θL and θH are initially assumed to be 0, HR0 = 70, AL=1, AH=1, fL = 0.095, and
fH= 0.275.
The heart rate function is used to iteratively calculate the RR intervals. The RR interval is calculated by dividing one minute by the instantaneous heart rate. Starting with an initial interval, the next interval can be calculated from the heart rate function using this initial interval as the time. The calculated interval is then added to the previous used time to generate the next interval from the heart rate function. In short, the sum of previous intervals is used as the next point in time to calculate the next interval from the heart rate function. The pseudo code for generation of artificial RR intervals is shown below.
The flow chart of the artificial RR interval calculation is shown inFigure 3.13.
Pseudo code for generation of artificial RR intervals
RR0 = 60/HR0 current_time = RR0 while(current_time < end_time) RRi = 60 / Heart_Function (current_time) current_time = current_time + RRi end
Figure 3.13 Flow chart for artificial generation of RR intervals
The generated artificial RR interval is shown in Figure 3.14. There are 256 points analyzed in our implementation of the Lomb periodogram, so to produce a fair comparison, the results are compared with those that have the same number of points. As we interpolate using a re-sampling rate of 4Hz, to produce 256 points between 0 to 0.5 Hz requires 1024-point FFT. The resulting PSD of the artificial RRI using Lomb periodogram compared with results using 1024 point FFT is shown in Figure 3.15.
Figure 3.15 Power spectral density of artificially generated RRI using 1024 point FFT, Lomb-Scargle periodogram, and our fixed point Lomb method. The RRI time series is
re-sampled at 4 Hz before FFT analysis.
The LF/HF ratio is calculated for each method and the error percentage is compared in Table 3-2.
Table 3-2 LF/HF Ratio Comparison of Artificially Generated RRI (LF/HF = 1)
LF/HF Ratio Value Error
Actual 1 -
FFT 1.095631 9.563104%
Lomb-Scargle 0.983035 1.696541%
This work 1.003755 0.375486%
Artificial Data with Spread Frequencies
To achieve a more realistic signal, the LF and HF frequency components are spread around the central frequencies with the Gaussian distribution
y = 1 σ√2πe −(x−µ)2 2σ2 � (3.10)
The distributions of the frequencies and the resulting RRI time series are shown in Figure 3.16. The PSD of the artificial RRI compared with results using 1024 point FFT and the Lomb-Scargle periodogram is shown in Figure 3.17. The LF/HF ratio is
calculated for each method and the error percentage is compared in Table 3-3Table 3-2.
(a)
(b)
Figure 3.16 (a) Distribution of the HF and LF frequencies (b) Artificial RRI time series with spread frequencies (LF/HF = 1)
Figure 3.17 Power spectral density of artificially generated RRI with spread frequencies using 1024 point FFT, Lomb-Scargle periodogram, and our Lomb method
Table 3-3 LF/HF Ratio Comparison of Artificially Generated RRI with Spread Frequencies (LF/HF = 1)
LF/HF Ratio Value Error
Actual 1 -
FFT 1.701217 70.121653 %
Lomb-Scargle 1.482163 48.216342%
This work 1.510836 51.083625 %
Artificial Data with Spread Frequencies (LF/HF = 0.5)
Next, the LF/HF is set to be 0.5 with AL=1 and AH=0.5. The generated RR
intervals are shown in Figure 3.18. The PSD of the artificial RRI compared with results using 1024 point FFT and the Lomb-Scargle periodogram is shown in Figure 3.19. The LF/HF ratio is calculated for each method and the error percentage is compared in Table 3-4.
Figure 3.19 Power spectral density of artificially generated RRI with spread frequencies using 1024 point FFT, Lomb-Scargle periodogram, and our Lomb method
using fixed point (LF/HF = 0.5)
Table 3-4 LF/HF Ratio Comparison of Artificially Generated RRI with Spread
Frequencies (LF/HF = 0.5)
LF/HF Ratio Value Error
Actual 0.5 -
FFT 0.676603 35.320624 %
Lomb-Scargle 0.530713 12.659493%
This work 0.524123 18.541998 %
Finally, to simulate time-varying properties, the central frequency of the HF is configured to sweep linearly from 95% to 105% of the original value over the course of generation. The resulting time frequency distribution using the Lomb periodogram is shown in Figure 3.20.
Figure 3.20 Time-frequency distribution of artificial RR interval with HF frequency sweep using the Lomb periodogram
3.4.2.1 Data from PhysioBank
In addition to simulation using artificial RRI, data from PhysioBank’s online ECG database has been used to verify the HRV processor design. Databases including the MIT-BIH Arrhythmia Database and the MIT-BIH Normal Sinus Rhythm Database have been used to compare results. Figure 3.21 shows the PSD of a single window compared with results using 1024 point FFT and the Lomb-Scargle periodogram. A time-frequency distribution of HRV is shown in Figure 3.22.
Figure 3.21 Power spectral density of RRI data from the MIT-BIH Arrhythmia Database as calculated using 1024 point FFT, Lomb-Scargle periodogram, and our Lomb
method using fixed point.
Figure 3.22 Time-frequency HRV analysis using Lomb TFD of EKG data from the
3.5 Discussions
The Lomb-Scargle periodogram has previously been demonstrated to be a good PSD estimator of unequally sampled data. Although the errors due re-sampling are difficult to perceive using real bio-signals, as it is impossible to obtain the original components, it is important to note how efficient the Lomb periodogram is at performing PSD analysis of un-equally sampled data. When compared to traditional TFDs using FFTs of approximately the same area size (or total number of points), the Lomb periodogram yields higher frequency resolution within the frequencies of interest. Due to the need to re-sample RR intervals at higher frequencies for FFT analysis, only a portion of the FFT outputs are within frequencies of interest. The Lomb periodogram, however, maps all points to the frequencies of interest. This is due to the fact that the Nyquist rate is not well defined for unequally spaced data and we are able to obtain information from well above the Nyquist frequency [58]. With a higher re-sampling frequency, the number of required points for FFT becomes unrealistic for hardware implementation, whereas there is no need to consider re-sampling frequency when using Lomb periodogram. Therefore, the Lomb periodogram has been proven to be a hardware efficient method of performing PSD analysis of HRV.
A time frequency distribution using Lomb periodogram for HRV analysis has been developed. The algorithm has been implemented in an HRV processor for processing raw ECG data and performing HRV analysis. The HRV processor has been implemented as an ECG system for portable ECG monitoring and HRV analysis system. The proposed system, integrated with an HRV processor using windowed Lomb periodogram, is suitable for portable and low power medical devices for ECG monitoring and TFD HRV analysis.
Chapter 4 ECG System-on-Chip Design
As discussed in Chapter 1, providing adequate healthcare for the gradually aging population in light of reduced personnel and rising costs is a problem the modern world is currently faced with. Portable medical systems developed for bringing healthcare to the average user as well as the elderly is a rising trend which can benefit the entire social healthcare infrastructure. To enable practical employment of ubiquitous healthcare devices for portable medical applications, an experimental ECG system-on-chip prototype has been developed. This chapter describes the architecture of the proposed ECG SOC as well as the means of system verification.
4.1 Overview of System Architecture
The designed ECG SOC can serve as a portable solution to 3-lead ECG acquisition and remote monitoring. An on-chip HRV processor is also included in the system for time-frequency analysis of HRV using the Lomb periodogram. To communicate with a remote station, a universal asynchronous receiver/transmitter (UART) module has been implemented to interface with a Bluetooth module or a PC. The final ECG SOC has been implemented using UMC 90nm CMOS technology.
The system architecture of the ECG SOC is shown in Figure 4.1. The system includes an ADC controller to retrieve three-channel ECG from the 10-bit ADC in front-end circuits. An onboard beat detection unit and HRV analysis engine is used to perform time-frequency HRV analysis using a windowed Lomb periodogram. Finally, a lossless ECG compression engine compresses data before wireless transmission using Bluetooth to a remote station for display or further diagnosis. As UART is used for the communication interface, the system is able to interface with other devices that have UART, such as ZigBee modules or a PC.
4.2 ADC Controller
The ECG SOC is interfaced with an analog front-end IC designed for biomedical applications. The analog front-end IC comprises multi-channel amplifiers and filters for acquisition of up to 7 channels of ECG; however in our system only 3 channels are activated. An ADC is also included in the IC for data conversion. The specifications of the analog front-end circuits and ADC are shown in Table 4-1.
The AIC is interfaced to the designed system via the ADC controller module. 10 KHz and 1.2 MHz clocks are generated and provided to the AIC. After the front-end circuits in the AIC, there is a time-multiplexed ADC. ADC_CHSEL is used to select the channel into the ADC. The maximum master clock rate for the ADC is 1200 KHz. Analog-to-digital conversions are triggered by the ADC_START signal. The ADC requires constant 12 cycles to finish one conversion including the one which
Figure 4.1 Overall system architecture for the ECG SOC. The data path is
ADC_START raises. After the conversion is done at the twelfth cycle, the End-of-Conversion (EOC) signal will raise for one cycle, and at the same cycle the digitized sample of the bio-medical signal is ready to be read on the ADC_OUT[9:0] bus. For the digital integrated SoC, the end-of-conversion (EOC) signal can be directly used as an INPUT_VALID signal.
Figure 4.2 The ADC Controller module
Table 4-1 Specifications of the Analog Front-End Circuits & ADC
Parameters Value
ECG Channel Number 3
Sample Rate (Hz) 256
LPF cut-off freq. (Hz) 150
Gain (dB) 40
Output Range (V) 0.3~1.5
ADC Resolution 10
4.3 System Control
The system control unit (SCU) is responsible for initialization of the system, decoding of the current configuration, and generating control signals decoded from the current configuration to corresponding modules. The ECG SOC receives configurations from a remote station via the UART interface to startup the system. In addition, a trigger signal is employed to enable a manual start so that the system can reset to a default mode without the need of configuration commands from the remote station. The command packet and corresponding configurations are shown in Figure 4.3.
Figure 4.3 Command packet and corresponding configuration
After receiving a configuration command, the SCU decodes the command and if system re-configuration is required issues an internal reset to all modules. The system then restarts with the new control signals and the configuration is loaded. The control flow diagram of the SCU is shown in Figure 4.4.
Figure 4.4 System control flow diagram 4.4 HRV Processor
A VLSI hardware implementation of an HRV processor that is power efficient and analytical accurate has been presented in this thesis. The architecture of the HRV engine was discussed in Chapter 2 and the overall architecture is shown in Figure 4.5(a). The HRV processor is implemented The HRV engine performs time-frequency HRV analysis on a heart rate window of two minutes with fifty percent overlap. Spectral analysis using the Lomb periodogram is calculated using a novel low area fixed-point hardware design. The HRV processor can operate in various modes, shown in Figure 4.5(b), and has gated clocks to turn off the processor when HRV calculation is not performed. The proposed HRV engine is cost-effective in obtaining accurate time-frequency domain HRV analysis without the need for microprocessors or software on remote stations.
4.5 Compression Engine
It is well-known that wireless data communication takes up a large share of the total power consumption in most portable wireless devices or systems, with power dissipation proportional to the amount of data transferred.
With the energy consumption of today’s wireless transceivers ranging between 0.6 nJ/bit to 75 nJ/bit depending on modulation scheme, protocol, data rate and transmitter power output [59,60], data compression performed in a submicron technology domain is expected to result in overall power savings. For example, a microcontroller-based lossy
(a)
(b)
Figure 4.5 (a) Architecture of the HRV processor (b) Top level module view of
compressor [61] can already achieve an energy consumption of 31 pJ/bit, which is an order of magnitude lower. For our ECG processor, a lossless compression technique was chosen instead of lossy in order to avoid the possibility of losing ECG artifacts of potential diagnostic value.
The architecture of the compression engine, shown in Figure 4.6, comprises a precision adjust unit, a context determiner, a differential pulse code modulation (DPCM) predictor, a context-based k-parameter estimator, a prediction memory array (3ch ECG), a set of context variable upkeep modules, a remap to unsigned unit, a Golomb-Rice entropy coder and a 40-bit multi-stream packer/multiplexer. To enhance the compression performance, each ECG sample was classified according to a context rule based on a finite number of previous samples[62], with the Golomb-Rice k-parameter estimated for each context and particular sample. To minimize area and latency, the need for sample buffers was eliminated by employing an adaptive k-parameter estimation algorithm [63]. The compression unit also accepts RR interval and HRV coefficient data, which, together with compressed or raw ECG data are packetized and multiplexed onto a single data stream.
Table 4-2 shows the specifications of the compression engine compared to previous works.
Table 4-2 Specifications of the Compression Engine
Parameters This work [64]
Max. Oper. Frequency 32 MHz 32 MHz
Data Type EKG EEG
No. of Channels 3 4
Sample Bit Precision 8, 10, 12, 16, 20 8, 10, 12, 16
Memory Size 3,168 bits 4,224 bits
Header Support Yes No
Compression Ratio 2.50 1.70
Technology 90nm CMOS 90nm CMOS
4.6 Wireless Communication
As the UART standard is used for output of data, many forms of communication protocols can be utilized. Through UART, the system can be interfaced with a wireless chip solution, a PC, or any other device with UART. To verify the capabilities of various output methods, wireless transmission using the IEEE 802.15.4 standard as well as the Bluetooth standard were implemented in this study.
The IEEE 802.15.4 is a standard which specifies the physical layer and media access control for low-rate wireless personal area networks and is the basis for protocols such as ZigBee. In this thesis, a Jennic-JN5121 chipset was used for development of the IEEE802.15.4 compliant wireless protocol. The IEEE802.15.4 compliant module is shown in Figure 4.7.
![Figure 2.4 Electrophysiology of the heart. [26]](https://thumb-ap.123doks.com/thumbv2/9libinfo/8742730.204465/22.892.162.742.112.717/figure-electrophysiology-heart.webp)
![Figure 2.8 Projected elderly, total dependency ratios based on official United Nations statistics, 1950-2050 [33]](https://thumb-ap.123doks.com/thumbv2/9libinfo/8742730.204465/26.892.160.730.114.724/figure-projected-elderly-dependency-official-united-nations-statistics.webp)