行政院國家科學委員會專題研究計畫 成果報告
仿生太陽能電池元件及其光電能量轉換機制研究--仿生太
陽能電池元件及其光電能量轉換機制研究(子計畫一)(3/3)
研究成果報告(完整版)
計 畫 類 別 : 整合型 計 畫 編 號 : NSC 98-2627-M-009-008- 執 行 期 間 : 98 年 08 月 01 日至 99 年 07 月 31 日 執 行 單 位 : 國立交通大學生物科技學系(所) 計 畫 主 持 人 : 吳東昆 計畫參與人員: 碩士級-專任助理人員:胡禕庭 碩士班研究生-兼任助理人員:歐書涵 碩士班研究生-兼任助理人員:詹欣芳 碩士班研究生-兼任助理人員:張世穎 博士班研究生-兼任助理人員:張晉豪 博士後研究:張程翔 博士後研究:王裕國 處 理 方 式 : 本計畫可公開查詢中 華 民 國 99 年 10 月 29 日
行政院國家科學委員會專題研究計畫 成果報告
仿生太陽能電池元件及其光電能量轉換機制研究--仿生太陽能電池元件及其
光電能量轉換機制研究(子計畫一)(3/3)
研究成果報告(完整版)
計 畫 類 別: 整合型
計 畫 編 號: NSC 98-2627-M-009-008-
執 行 期 間: 98 年08 月01 日至99 年07 月31 日
執 行 單 位: 國立交通大學生物科技學系(所)
計畫主持人: 吳東昆
處 理 方 式:
本計畫可公開查詢
中 華 民 國 99 年 10 月 06 日
1. Introduction
1.1 Global Demand for Energy
Abundant energy is indispensable for modern civilizations. But the energy crisis has become the most important issue in nowadays. In the next 50 years, the needs of earth for energy will be at least double and the stage is set for a major shortage of energy supply unless renewable sources can cover the substantial deficit that fossil fuels can no longer provide. Nobel laureate R. Smalley at a recent conference in Washington cited energy as the top problem that mankind will face in the near future (Fig. 1-1).1 The alternative energy source is needed urgently. Alternative energy we need is not based on the burning of fossil fuels or the splitting of atoms which will cause undesirable effects of pollution, such as greenhouse effect and nuclear waste, etc. Fortunately there are many means of harnessing energy which have less damaging impacts on our environment. Therefore, there are many scientists who strive for opening up and developing new substitution energy in different research fields.
The idea of converting light to electric power or chemical fuels has infatuated mankind for many centuries. The sun is the most obvious energy source, providing more energy to the Earth in one hour (4.3 x 10²⁰ J/hour) than all the human-related energy consumption on the planet in a year (4.1 x 10²⁰ J). The dream is to capture the energy that is freely available from sunlight and turn it into the valuable and strategically important asset that is electric power or to generate directly chemical fuels, such as hydrogen.
To date photovoltaic has been dominated by solid state junction devices, usually in silicon, crystalline or amorphous, and profiting from the experience and material availability resulting from the semiconductor industry. The development of new types of solar cells is promoted by the increasing public awareness that the earth’s oil reserves will run out during this century.
Figure 1-1 Top ten problems mankind will face during the next 50 years according to Nobel laureate Richard
Smalley
1.2 Light Energy Converted to Electric Energy: Solar Photovoltaic Cells
Solar photovoltaic cells, capable of directly converting sunlight into electrical power, are one of the most promising devices in the search for sustainable and renewable sources of clean energy. The progress of solar cell can be separated into three stages basing on the different of materials and working mechanism. There are (1) 1st generation (crystalline solar cells), (2) 2nd generation (Thin film solar cells), and (3) 3rd generation (Dye-Sensitized Solar Cells) of solar photovoltaic cells.
Dye-sensitization solar cell (DSSC) is one of new types of solar cells. The working principle of DSSCs are
(Fig. 1-2)1: (1) In general the components of DSSCs setup can be separated into photoactivated-dye, mesoporous nanocrystalline inorganic semiconductor (usually TiO2), electrolyte (usually I-/I3- in acetonitrile),
conducting glass (usually ITO) and cathode (usually Pt). A wide band-gap, mesoporous nanocrystalline inorganic semiconductor is deposited on an electrode and covered with a monolayer of photoactivated-dye and immersed in a redox mediator. (2) The dye is excited by incoming light production of an excited state (electron + hole); the electron is injected into the conduction band of the semiconductor, while the hole remains on the dye, which gets into an oxidized state (missing an electron). (3) The redox electrolyte provides the missing electron to the dye, and gets oxidized in turn. (4) The electron in the semiconductor is injected into the anode. (5) An electron flows from the cathode to reduce the oxidized electrolyte, and close the circuit.
Figure 1-2 The working principle of dye-sensitization solar cells (DSSCs). Photoexcitation of the sensitizer
(S) is followed by electron injection into the conduction band of an oxide semiconductor film. The dye molecule is regenerated by the redox system, which itself is regenerated at the counter electrode by electrons passed through the load. Potentials are referred to the normal hydrogen electrode (NHE).
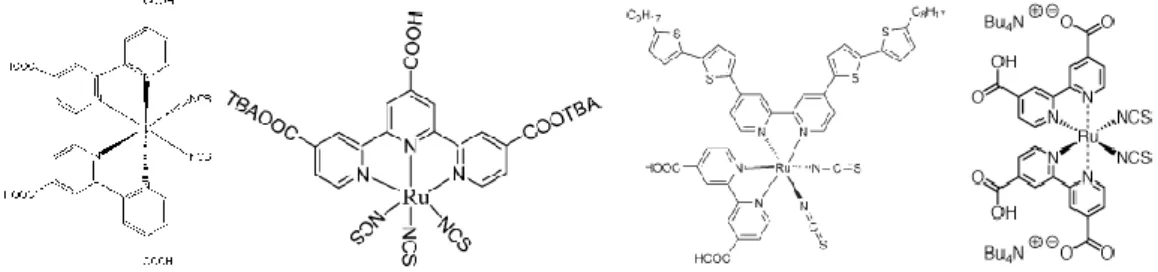
A breakthrough occurred in recent years when M. Grätzel and B. O'Regan reported a photochemical solar cell using nanoparticle TiO2 sensitized by a more efficient and stable Ru(II)-complex dye.2 The standard dye
used in reported solar cell was RuL2(NCS)2 (L = 4,4’dicarboxy-2,2’-bipyridine) (absorption peak at 550 nm)
which was known as N3-dye (Fig. 1-3); this system showed conversion efficiencies (η) of 7.7% under standard solar conditions.3 A recent new "black" dye (4,9,14-tricarboxy 2,2'-6,6'-terpyridyl Ru(II) trithiocyanate) (Fig. 1-3) had recently been reported by Grätzel that produces an efficiency of nearly 11%.4 Chen et al. synthesized a new ruthenium photosensitizer CYC-B1 (Fig. 1-3) in which one of the dcbpy ligands in N3 was replaced with abtpy, a bipyridine ligand substituted with alkyl bithiophene groups.5 It showed conversion efficiencies of 8.54% higher than N3-dye but lower than black dye. Grätzel et al. used N3-derived (Bu4N)2[Ru(dcbpyH)2(NCS)2], N719 (Fig. 1-3) as photosnesitizer and got a best efficiency of
Figure 1-3 Chemical structure of N3, black dye, CYC-B1 and N719 (from left to right).
Further, we summarize the advantage and disadvantage of 1st generation, 2nd generation and 3rd generation solar cell. (Table 1)
Table 1 Comparsion of solar cell
Although the study of solar cell are divided into 1st, 2nd and 3rd generation solar cell, base on the development stage of these solar cells, many scientists are trying to investigate the possibility and feasibility of new generation solar cell because of the efficiency saturation of 1st, 2nd and 3rd generation solar cell (Fig.
Bio-Sensitized Solar Cells (BSSC) is a new generation of solar cell which is basing on the conception of bionics integrates the bio-material and nano-component. It is a real green energy: the bio-material can be decomposed by nature without environment pollution. Base on the mechanism of 3rd generation solar cell, it has low cost in materials and equipments and higher potential in promotion of photon-electron conversion efficiency.
Many biomaterials such as natural dyes extracted from plants,7 cyanobacteria cells,8 living whole-cell photosynthetic micro-organisms9 and protein with solid-state electronics.10,11 have been tested in making bio-sensitized solar cells (BSSC).12 Tsujimura et al.13 used the whole cells of Synechococcus sp. PCC7942 as a biocatalyst and 2,6-dimethyl-1,4-benzoquinone (DMBQ) as a mediator to produce a photosynthetic bioelectrochemical cell with a photoconversion efficiency ~2% under illumination from a desktop fluorescent lamp. Lam et al.14 demonstrated a microelectromechanical system (MEMS) photosynthetic electrochemical cell (μPEC) that harnesses the subcellular thylakoid photosystems isolated from spinach cells to convert radiant energy into electricity; the device produced VOC =470 mV and ISC =1.1 μA cm−2 with a
photoconversion efficiency 0.01%. Lu et al.15 entrapped the bacterial photosynthetic reaction center (RC) from Rb. Sphaeroides strain RS601 on three-dimensional worm-like mesoporous WO3-TiO2 films to develop
versatile bio-photoelectric devices; the ISC was detected near 30 μA cm−2 with a maximal incident conversion
efficiency of photons to current (IPCE) ~11% (about 800 nm). Among those biosensitizers, the most promising are derivatives of metalloporphyrins, of which the porphyrins are integrated with metals of various types.
Renugopalakrishnan et al. also proposed a bio-sensitized solar cell (BSSCs) which was constructed by
bacteriorhodopsin (bR) and nanomaterials (TiO2-P25).16 The bR immobilized nanocrystalline TiO2 film
electrode solar cell produced a short-circuit photocurrent density (JSC) of 0.089 mA/cm2, and the open-circuit
photovoltage (VOC) of 0.35 V under an excitation intensity of 40 mW/cm2. Among those biosensitizers, the
most promising are derivatives of metalloporphyrins, of which the porphyrins are integrated with metals of various types.
1.3 Light Energy Converted to Chemical Energy: Photoelectrochemical Solar Cells
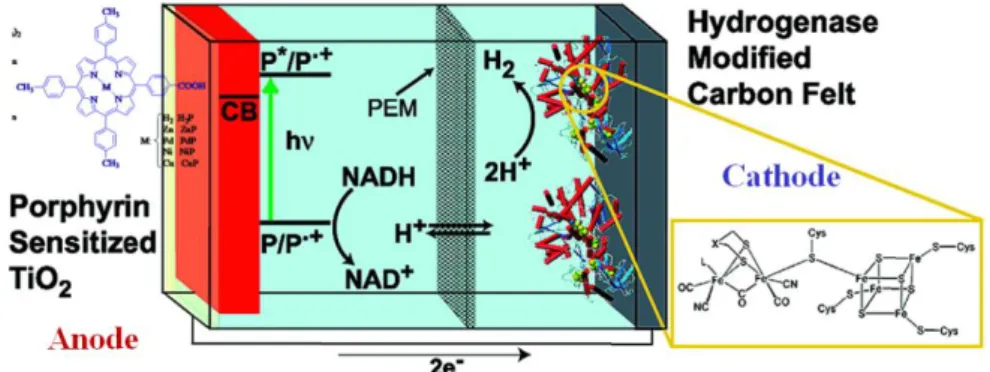
Although practical methods for conversion of sunlight to electricity exist, solar-generated electricity currently does not compete successfully with that from fossil fuels. In addition, the diurnal nature of solar radiation, the fluctuation of sunlight intensity at the earth’s surface as a function of the season and weather conditions, and the diffuse nature of solar energy which makes it impractical for powering land vehicles require mechanisms for solar energy storage. This in turn will necessitate either great advances in batteries or other devices for storing electricity, or generation of fuels from sunlight. For example, hydrogen has been widely discussed as a fuel, and hydrocarbons have the advantages of very dense energy storage and well-established technologies for storage, distribution, and use. Following the biological blueprint, an artificial photosynthetic fuel production system requires antenna/reaction center complexes to harvest sunlight and generate electrochemical potential, catalysts for oxidation of water or other electron sources, and catalysts for reduction of precursors to hydrogen or reduced carbon. Moore et al. has presented that the Clostridium
acetobutylicum [FeFe]-hydrogenase HydA has been investigated as a hydrogen production catalyst in a
photoelectrochemical biofuel cell. (Fig. 1-5)17
The cell uses a dye-sensitized nanoparticulate TiO2 photoanode, supported on a transparent, conductive
reminiscent of molecular reaction centers.20 Photon absorption, by the sensitizer porphyrin (P), leads to a porphyrin excited singlet state (P*), which relaxes via electron transfer to the TiO2 conduction band (CB).
This process occurs in parallel at multiple sites along the porphyrin-TiO2 interface. The resulting radical
cations (P‧+), residing on surface-bound dye molecules, oxidize NADH through two stepwise, one electron processes, regenerating ground-state porphyrins for further rounds of light excitation. The accumulation of NAD+ in the anode solution is able to drive the NAD-linked enzymatic oxidation of an appropriate biofuel substrate.21 The injected electrons, residing in the TiO2 conduction band, provide reducing equivalents to the
cathode, where hydrogen production occurs.18,22 Small cations exchange across the proton exchange membrane (PEM) to balance charge. Productive electron transfers are in competition with nonproductive recombination reactions occurring between TiO2 conduction band electrons and oxidized species at the
photoanode surface. The potential of the cathode influences the electron density in the TiO2 conduction band
and, hence, the rate of recombination.23 The overall function of this device is to photochemically reform biomass to H2.
Figure 1-9 Schematic drawing of the photoelectrochemical cell used in Moore’s system.
Many biomaterials were also used as metal cage or photosensitizers by co-incubated with Pt colloid to produce H2 under photoirradiation. Kang et al. used the modified Dps (DNA binding protein from starved
cells) from the Gram-positive bacterium Listeria innocua as a Pt cage to encapsulate the Pt0 nanoparticles and co-incubated with [Ir(ppy)2(bpy)]+ under photoirradiation to demonstrated the hydrogen production.24 Matsuo et al. reconstituted an artificial zinc porphyrin with apo-Mb as a photosensitizer when a sacrificial electron reagent (TEA), electron mediator (MMBP+) and Pt-colloid existed, it would proceed photoinduced H2
generation reaction.25 Komatsu and his co-workers reconsitiuted wild type and mutated human serum albumin (rHSA) with Zn(II)-protoporphyrin IX (ZnPP) as a photosensitizer also co-incorporated with a sacrificial electron reagent (TEOA), electron mediator (MV2+) and Pt-colloid to investigated the photoproduction of H2.26
The above-mentioned photoinduced H2 generation systems all can use GC-TCD to detect the production of
H2. It seems like that the reconstituted artificial protein is a good model to be applied in photo-chemical
energy conversion study.
1.4 Myoglobin, Porphyrins and Their Application in Photoinduced Electron Transfer
and Energy Conversion Study
Porphyrins which integrate with metal are named ―metalloporphyrins‖, and they also play important roles in nature. The capability of porphyrins to adsorb visible light in regions 400–450 nm (Soret or B band) and
7.1% has been achieved with a DSSC based on Zn porphyrin,31 but a serious limitation arises from the tendency of the porphyrin to aggregate, which competes with electron injection and yields a decreased overall efficiency of power conversion in the device. Because the planar structure of porphyrin, it does not easily exist in a monomer form. The structure of porphyrin is macrocycle which is considered as a rigid hydrophobic box, and it has a particular packing character. The aggregation is a geometry which places the pyrrole ring of one porphyrin directly above the π-cavity at the center of the other; such an arrangement minimizes π-π repulsion and maximizes attraction between the σ-framework around the inner edge of the π-cavity of one porphyrin with the an-electrons of the pyrrole ring immediately above. The role of the metal enhances porphyrin aggregation resulting from metalation places a large positive charge in the central cavity of the porphyrin which leads to a favorable interaction with the π-electrons of the pyrrole of the other porphyrin, and it dimerizes with a lateral shift. The aggregation forms of porphyrins contain two types:face-to-face arrangement to form H -aggregate (causes hypsochromically shift (blue shifts)) and head-to-tail to form J-aggregate (causes bathrochromically shift (red-shifts)).32,33 In order to solve the problem of porphyrins aggregation, myoglobin which can be overexpressed and has a natural cavity for the porphyrin structure is used as a model protein. The aggregation of porphyrins can be successfully suppressed on encapsulation within apomyoglobin (apoMb).
The study of photoinduced long-range electron-transfer and energy-transfer reactions within hemoproteins which have metalloporphyrins as prosthetic groups can transport the light initiating electron and energy have brought about significant attention in the field of both chemistry and biochemistry.34-38 Because the heme pocket of hemoproteins is a natural cavity for the porphyrin structure and keeps the porphyrin stable at physiological conditions, many artificial photoinduced electron-transfer systems have been constructed by replacing heme with chemical modified prosthetic groups, such as an artificial heme bearing polycarboxylic acid groups, metallo-protoporphyrin IX modified with bipyridinium groups and ruthenium complex.25, 39-44 Until now, many achievements on the study of intermolecular photoinduced electron transfer reactions by using zinc-porphyrin reconstituted hemoproteins have been reported, because their photoexcited triplet states has longer lifetime for several milliseconds and can act as strong reductants.45-49 Although, in nature, the essential role of Mb is oxygen storage, semi-synthetic reconstitution of apo-myogloin (apo-Mb), the most realized model in hemoproteins, with artificial cofactors has been investigated recently to functionalize and apply myoglobin on intermolecular photoinduced electron-transfer system.49-51 Myoglobin (Mb) is a suitable protein model to investigate the electron-transfer (ET) reaction because the protein cage can stabilize the reduced and oxidized state of prothetic group and form the long-lived excited state. A serious of organic and inorganic substrates such as methylviologen,52 quinones,53,54 inorganic complexes55,56 and nicotinamide adenine dinucleotide (NAD+) related compounds has been utilized by co-incubated with reconstituted zinc-porphyrin-Mb to study the photoinduced electron-transfer function.57,58
Hu et al. constructed a protein-based semisynthetic photoreaction center which used Mb as model protein to study photo-induced electron transfer processes (ET).44 The system have been constructed in a protein by cofactor reconstitution, which mimic the function of photosynthetic organisms to convert light energy to chemical potential in the form of long-lived charge-separated states. Takashima et al. have designed and synthesized a variety of chemically modified viologens which have optically active [1-(1-naphthyl)-, 1-phenyl-, 1-cyclohexyl]carbamoylmethyl and binaphthyl groups to examine the stereoselective photoinduced electron-transfer (ET) reactions with ZnPP-Mb by flash photolysis.53 Satoh et al. have used fourier transform
electron paramagnetic resonance (FT-EPR) technique to investigate the photoinduced electron transfer reaction between ZnPP-Mb and 1,4-benzoquinone (BQ) in aqueous solution. They successfully observed the ZnPP cation and BQ anion radicals, which provided direct evidence that the electron transfer occurs from the triplet porphyrin moiety to BQ.54 Tsukahara et al. have co-incubated ZnPP-Mb with inorganic complexes such as potassium ferricyanide (K3Fe(CN)6) and hexamineruthenium(III) chloride (Ru(NH3)6Cl3) to study
photoinduced electron-transfer (ET) reactions mechanism.56,57 Nishiyama et al. reported that a simple photoinduced electron-transfer model for photosystem I, wherein reduced nicotinamide adenine dinucleotide phosphate (NADPH) was produced by photochemical reduction using zinc protoporphyrin reconstituted myoglobin (ZnPP-Mb) as a sensitizer and enzyme.58,59 When the assay was proceed by photoirradiated for a short time (5.5 hr), an increase in the absorbance at 340 nm, attributed to NADPH formation was occurred in the consist of 1 M triethanolamine (TEA), 50 mM NADP+ and 20 µM ZnPP-Mb under photoirradiation. There was 40% of NADP+ converted to NADPH in 5.5 hours and approximately 70 % in 7 days.
Figure 1-10 Energy diagram for photoreduction of NADP+
Base on these studies, we can know that myoglobin is not just a myoglobin, by protein engineering, integrated with inorganic and organic material, and combined the analysis in photo/chemistry and photo/electrochemistry; the study of myoglobin could be further improved.
2. Results and Discussion
2.1
Obtain wild type apo-myoglobin (horse)
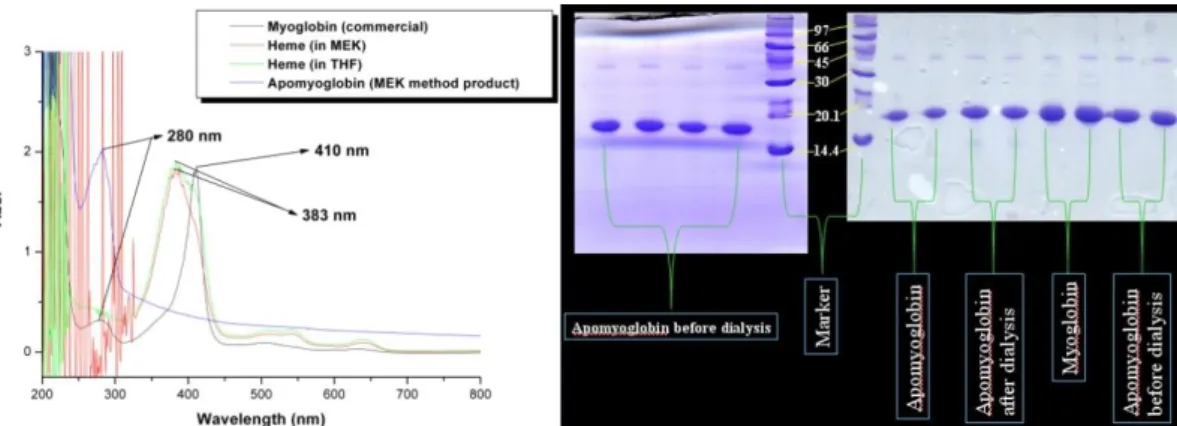
The results of using MEK method60 to get the apo-myglobin (horse) are shown in figure 2-1 (a). The absorption spectrum of wild-type myoglobin shows absorption maximum of protein band at 280 nm and Soret band at 410 nm in buffer solution. The absorption spectrum of heme shows absorption maximum of Soret band at 383 nm in MEK and THF. Apo-myoglobin which is separated heme by MEK method has only protein band at 280 nm, and there is no Soret band. It has been proved that the heme group has been departed from myoglobin and got the apo-myoglobin. The existence of myogloin is confirmed by SDS-PAGE to make sure that the apo-myoglobin does not disappear in each step. (Fig. 2-1 (b))
Figure 2-1 (a) UV-Vis result: To confirm that heme has been removed by MEK method. (b) SDS-PAGE result:
To confirm apoMb in each steps: apoMb doesn’t disappear in each step.
2.2 UV-Vis and fluorescence analysis results of reconstituted metallo-porphyrin-Mbs
Scheme 2-1 shows the reconstitution of metallo-protoporphyrin into apomyoglobin followed the modified method of Axup et al.61
Scheme 2-1 Preparation of apomyoglobin (apoMb) and reconstitution of apomyoglobin (apoMb) with
metallo- protoporphyrin (MtPP) and metallo-carboxyphenylethynyl porphyrin (MtPE1).
The absorption spectra of MtPP-Mbs and MtPE1-Mbs all consist of two branches, the Soret (or B) band in
the higher energy region and weak Q bands in lower energy region, traditionally identified as the S0→S2
(n→π*
) and S0→S1 (π→π*) transitions, respectively.
We compare the steady-state spectra of ZnPP/ZnPE1 in organic (THF), aqueous (100 mM KPi buffer), and
protein (apo-Mb heme pocket) in buffer solution. The absorption spectra of ZnPP/ZnPE1 in different
environment for the range of 300-700 nm is displayed in figure 2-2: reconstituted ZnPP-Mb/ZnPE1-Mb in 100
mM KPi (pH 6.8) shows a solid curve, ZnPP/ZnPE1 in THF shows as a dashed-dotted curve, and ZnPP/ZnPE1
THF at 417, 545, and 583 nm and ZnPE1 in THF at 439, 576, and 628 nm are assigned as B(0,0), Q(1,0), and
Q(0,0), respectively; the number of quanta shown in parentheses represents the dominant Franck-Condon active vibrational modes.61,62 The Soret band of both ZnPP/ZnPE1 in KPi buffer became much broader than
that of ZnPP/ZnPE1 in THF and reconstituted ZnPP-Mb/ZnPE1-Mb in KPi buffer. There is a little red-shift
and no appreciable change of the Q bands for ZnPP in KPi buffer64 but it is much red-shift and became abnormal shape for ZnPE1 in KPi buffer. Also, the chemical shift of Soret band for ZnPP/ZnPE1 in KPi buffer
is different by comparing with ZnPP/ZnPE1 in THF. For ZnPP in KPi buffer, the broad and blue-shift spectral
features of Soret band is generally attributed to the formation of ZnPP aggregates for H type in aqueous solution.65-70 In contrast, the broad and red-shift spectral features of Soret band for ZnPE1 in KPi buffer are
generally attributed to a side-by-side aggregation (J type aggregation) of ZnPE1 aggregates in aqueous
solution. Ribo et al. discussed in detail the formation of H- and J-aggregates, which are characterized by face-to-face and side-by-side arrangements of the porphyrins, respectively.71 In the case of J-aggregates, a red shift of the Soret band is expected.65,71 The putative red-shifted Q-band absorption peaks signify that the assembly consists of side-by-side aggregates (J-aggregates).72-74 For both reconstituted ZnPP-Mb and ZnPE1-Mb in 100 mM KPi buffer, the Soret and Q bands represent a red-shift spectral feature. It has been
known that the increasing of solvent polarity would cause the decreasing of energy for a typical π-π* state in porphyrins,75 so the energy gap of the S0 → S1 transition for ZnPP-Mb/ZnPE1-Mb in buffer is smaller than
that of ZnPP/ZnPE1 in THF. Therefore, it is consistent with the red-shift of Q band for ZnPP-Mb/ZnPE1-Mb
in buffer comparing with ZnPP/ZnPE1 in THF. The same is true of the red-shift in Soret band for
ZnPP-Mb/ZnPE1-Mb in buffer (11 nm for ZnPP-Mb and 5 nm for ZnPE1-Mb) because the smaller energy gap
of the S0 → S1 transition than ZnPP/ZnPE1 in THF. Base on our results, the sharp shape of Soret band for
reconstituted ZnPP-Mb/ZnPE1-Mb in buffer demonstrates that the pocket of Mb can keep porphyrin structure
in mono-form stably and prevent the porphyrin aggregates formation in aqueous environment.
Figure 2-2 (a) and (b) Normalized steady-state absorption spectra of ZnPP/ZnPE1 in THF (- .), KPi buffer
(- -), and reconstituted inside the heme pocket of apomyoglobin (——)
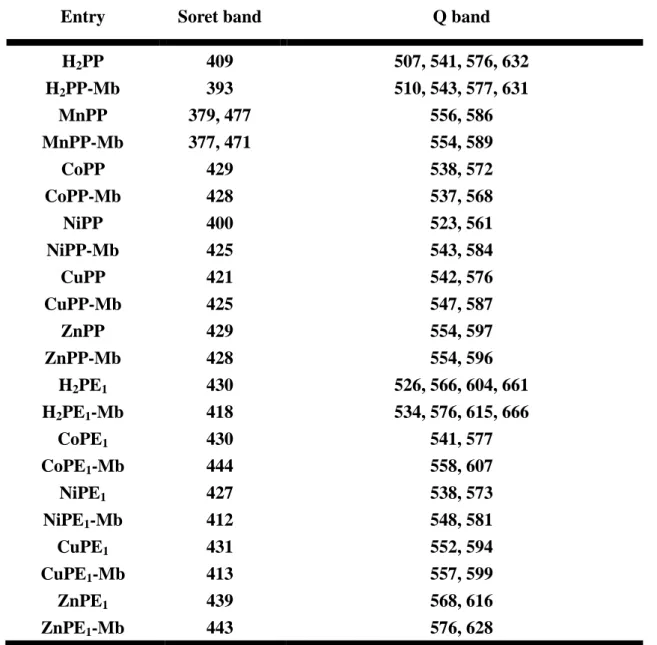
We also have successfully reconstituted various metallo-porphyrin-Mbs and the steady-state spectra characteristics of them are summarized in Table 2-1.
Table 2-1 Absorption maxima (in nm)of MtPP/MtPE1 (in pyridine/THF) and
MtPP/MtPE1-Mbs (in 100 Mm KPi)
Entry Soret band Q band
H2PP H2PP-Mb MnPP MnPP-Mb CoPP CoPP-Mb NiPP NiPP-Mb CuPP CuPP-Mb ZnPP ZnPP-Mb H2PE1 H2PE1-Mb CoPE1 CoPE1-Mb NiPE1 NiPE1-Mb CuPE1 CuPE1-Mb ZnPE1 ZnPE1-Mb 409 393 379, 477 377, 471 429 428 400 425 421 425 429 428 430 418 430 444 427 412 431 413 439 443 507, 541, 576, 632 510, 543, 577, 631 556, 586 554, 589 538, 572 537, 568 523, 561 543, 584 542, 576 547, 587 554, 597 554, 596 526, 566, 604, 661 534, 576, 615, 666 541, 577 558, 607 538, 573 548, 581 552, 594 557, 599 568, 616 576, 628
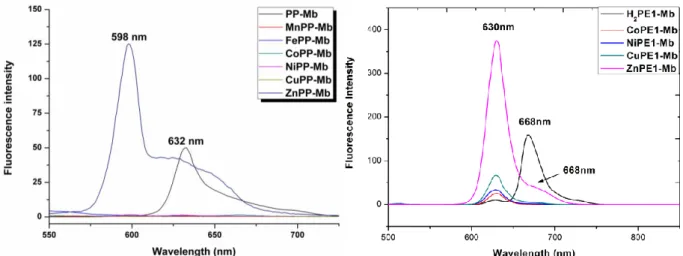
The fluorescence emission spectra of ZnPP-Mb and ZnPE1-Mb in 100 mM KPi are shown in figure 2-3. It
exhibits a typical mirror image of the Q band of the corresponding absorption spectrum shown in figure 2-2. Accordingly, the fluorescence maxima of Q bands are assigned as Q(0,0)/Q(0,1): 597/650 nm for ZnPP-Mb and Q(0,0)/Q(0,1): 630/668 nm. This spectral feature provides strong evidence for the ZnPP/ZnPE1 monomer
reconstituted with the apoMb to form ZnPP-Mb/ZnPE1-Mb in buffer solution – the bathochromic shift in the
Figure 2-3 Normalized steady-state fluorescence spectra of ZnPP-Mb and ZnPE1-Mb.
We also investigated steady-state emission fluorescence spectra of reconstituted various metallo-porphyrin-Mbs by exciting at 435 nm. (Fig. 2-4) Because of the quenching effect of transition metal ions (Mn, Fe, Co, Ni and Cu)76 there was no emission fluorescence detected for MtPP-Mbs besides reconstituted Zn-protoporphyrin Mbs (Zn with filled d orbital) and H2PP-Mb (no metal in porphyrin). The
emission spectrum of H2PE1-Mb showed emission maxima at 630, 668 and 730 nm, and MtPE1-Mbs (Co, Ni,
Cu, Zn) at 621 and 670 nm. By Comparing with ZnPE1-Mb, the fluorescence intensity of other MtPE1-Mbs
(Co, Ni, Cu) was relatively weak.
Figure 2-4 The emission spectra of reconstituted ZnPP-Mb and ZnPE1-Mb in 100 mM KPi.
2.3
Picosecond fluorescence decays and anisotropy dynamics of ZnPP-Mb/ZnPE
1-Mb
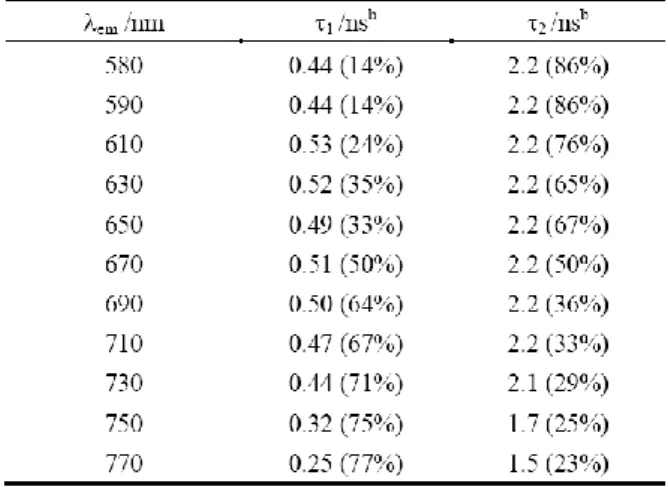
Figure 2-5 shows the four typical fluorescent decays which were observed at λem (nm) = 590, 650, 710 and
770 of the ZnPP-Mb in 100 mM KPi. A bi-exponential decay function and two decay coefficients τ1 and τ2 are
used to fit these fluorescence transients, and these fitted time coefficients and the corresponding relative amplitudes are summarized in Table 2-2.
The λem from 580 to 710 nm was with almost constant in τ1 ~0.5 ns and τ2 = 2.2 ns, but when λem > 710 nm
both τ1 and τ2 were decreased. The relative amplitudes of τ1 and τ2 were highly depending with λem, i.e., the
slow-decay component (τ2) is the major part of the transient at shorter wavelengths whereas the rapid-decay
component (τ1) becomes dominant at longer wavelengths.
Figure 2-5 Picosecond fluorescence transients of reconstituted ZnPP-Mb in buffer solution with λex = 435 nm
at λem /nm = (A) 590; (B) 650; (C) 710; (D) 770. Two decay components served to describe the transients
with a parallel kinetic model and the corresponding fitted time parameters as indicated; those of other wavelengths are listed in Table 2-2.
Comparing with the lifetime τ = 2.07 ns of a monomeric ZnPP in THF,77 the τ2 = 2.2 ns of ZnPP-Mb in 100
mM KPi was the S1→T1 intersystem crossing (ISC) of the monomeric ZnPP inside the heme pocket of apoMb.
The τ1 with short lifetime and becoming significant at longer wavelengths was surmised that it was
contributed by free ZnPP molecules out of the Mb in the form of ZnPP aggregates in buffer solution.
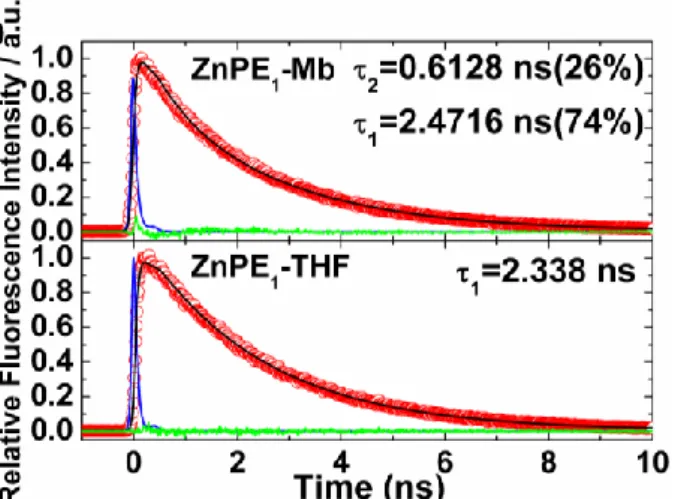
Picosecond fluorescence measurements of ZnPE1-Mb in KPi at 295 K, excitation at λex = 435 nm and
emission at λem = 630 nm, also showed a biexponential decay function and two time constatnts of τ1 = 0.6 ns
in ZnPE1-Mb could be reasonably assigned to the S1-T1 intersystem crossing (ISC) of the ZnPE1 inside the
heme pocket of apoMb.
Figure 2-6 Picosecond fluorescence transient of ZnPE1-Mb complex in KPi with λ ex = 435 nm and λ em =
630 nm. For ZnPE1 in THF, the λ ex = 435 nm and λ em = 623 nm.
The time-resolved fluorescence anisotropy obtains the depolarization kinetics for the rotational Brownian motion of the fluorophore in various biological environments. In a TCSPC experiment, the fluorescence anisotropy decay is evaluated with this equation,78,79
VV VH VV VH I (t) G I (t) (t) I (t) 2 G I (t) r (1)
in which r(t) is the anisotropy at time t, the G factor compensates for the polarization dependence of the monochromator grating, optics and detector. By definition, G = IHV/IHH, in which IHV and IHH represent the
time-dependent intensities of fluorescence excitation with horizontal polarized light and monitoring at vertical and horizontal polarizations, respectively. Analogously, IVV and IVH represent the intensities of fluorescence
excitation with vertically polarized light monitored at vertical and horizontal polarizations, respectively. The fluorescence anisotropy decay curves of ZnPP in THF, ZnPP-Mb in buffer, ZnPE1 in THF and
ZnPE1-Mb in buffer at 25 oC appear in figure 2-7. The observed time-dependent anisotropy curves in figure
all decay to zero background at long times and they are well described with a single-exponential (free isotropic rotation) decay function with the rotational time coefficients. The a single-exponential decay function describes the decay feature of r(t)
r(t) = r0e-t/τ (2) in which the time constant τr represents the rotational correlation period of the system. We found the rotational
correlation periods to be 0.2 ns for ZnPP in THF and 11 ns for ZnPP-Mb in buffer. For ZnPE1 in THF, the
rotational time coefficient is 0.25 ns, whereas for ZnPE1-Mb in buffer, the rotational time coefficient increases
to 10 ns. The single-exponential decay feature of the system indicates a purely isotropic orientation relaxation that reflects the size of the system, as discussed next. When the ZnPP/ZnPE1 molecules are well-dispersed in
THF solution, the free ZnPP/ZnPE1 molecules can reorientate freely; the reorientational period is the observed
0.2 ns for ZnPP and 0.25 ns for ZnPE1. The slightly longer reorientational period for ZnPE1 comparing with
was inhibited, however, and depolarization of ZnPP/ZnPE1 in its excited state might occur when the whole
ZnPP-Mb/ZnPE1-Mb complex made a movement in buffer solution. For the ZnPP-Mb system, depolarization
occurs on the time scale of 10 ns, which is 100 times that of the ZnPP/THF system. The same is true for ZnPE1-Mb, the time of depolarization is 10 ns, which is also 100 times that of ZnPE1/THF system. According
to Perrin’s equation, the rotational correlation time coefficient (τ ) for a spherical molecule is proportional to the hydrodynamic molecular volume of the fluorophore (V) and can be represented with79
V RT
(3)
in which η is the viscosity of the medium, T is the temperature and R is the gas constant. As a result, the ratio of hydrodynamic radii (assuming 4 3
3
V r ) of ZnPP-Mb/ZnPP and ZnPE1-Mb/ZnPE1 are estimated to be
2.98 and 2.68 water/ηTHF = 0.48 at 298 K. This ratio is approximated to true value by comparing
size between porphyrin and crystallized Mb. Maiti et al. have measured the time-resolved fluorescence anisotropy of ZnPP within various micelles in aqueous solution and described complicated dynamical feature with two exponential decay functions.77 A wobble-in-cone model was considered to interpret such an observation (i.e., the fluorescence depolarization occurs on both rotational diffusion of ZnPP inside the micelle and the tumbling of the micelle).77 Based on our results, only a single-exponential decay feature was observed for the fluorescence depolarization of ZnPP/ZnPE1 encapsulated inside apo-Mb, indicating that the
ZnPP molecule was tightly bound to apo-Mb and stably reorientates with the entire protein molecule.
Figure 2-7 (a) Picosecond fluorescence anisotropies of ZnPP in THF (△) and reconstituted within apomyoglobin in buffer solution (○) obtained at λem = 590 nm with excitation at λex = 430 nm. (b)
Picosecond fluorescence anisotropies of ZnPE1 in THF (◇) and reconstituted within apomyoglobin in buffer
solution (□) obtained at λem = 655 nm with excitation at λex = 635 nm.
2.4 Reconstituted Metallo-porphyrin Mb Based Light-chemical Energy Conversion
The intermolecular energy and electron transfer reactions between NAD(P)H and ZnPP-Mb/ZnPE1-Mb has
been investigated in photoinduced redox reaction. In photoinduced reduction reaction, our simple artificial photosynthetic system has been constructed by four major parts: light source (419 nm), photosensitizer (reconstituted metalloprotoporphyrins-Mb), substrate (NADP+) and sacrificial electron donor (TEA). The hypothetical mechanism of photoinduced NADPH reduction is supposed that photosensitizer and sacrificial electron donor are photoirradiated to form some unknown catalysts which can further donate electron to substrate to cause the reduction reaction. Using reconstituted ZnPP-Mb/ZnPE1-Mb as a model photosensitizer,
we firstly investigate the photoirradiated duration effect (Fig. 2-8 (A) and (B)) and electron donor effect (Fig. 2-8 (C) and (D)). It concluded that 6 hours photoirradiation and dark reaction for 5 days with 1 M TEA has the best conversion efficiency.
Figure 2-8 (A) Absorbance of 340 nm change for the solution containing ZnPP-Mb (25 μM), TEA (1 M), and
NADP+ (2.5 mM) irradiated by different duration (0 (■), 0.5 (●), 1 (▲), 2 (▼), 3 (◀), 4 (▶), 5 (◆) and 6 (★) hours) then kept in dark. (B) Absorbance of 340 nm change for the solution containing ZnPP-Mb (25 μM), TEA (1 M), and NADP+ (2.5 mM) under continued photoirradiation for 36 hours (●); 6 hours photoirradiation and dark reaction for 5 days (■); 6 hours photoirradiation (without NADP+) and dark reaction for 5 days (with NADP+) (▲), and continued dark reaction for 5 days (▼). (C) Absorbance change of photoirradiation by using ZnPP-Mb (25 μM) as a model photosensitizer, ethanolamines (MEA, DEA, and TEA, 1M) as sacrificial electron donor, and NADP+ (2.5 mM) as substrate was irradiated for 6 hours then kept in dark. (D) Absorbance change in the solution containing 25 μM of ZnPP-Mb, 2.5 mM of NADP+, and 0 (■), 1 (●), 10 (▲), 100 (▼), 250 (◀), 500 (▶) and 1 M TEA (◆) was irradiated for 6 hours then kept in dark.
The results of photoinduced NADP+ reduction by using various MtPP-Mbs/MtPE1-Mbs as photosenitizer
were also investigated and summarized in table 2-3 and 2-4. For MtPP-Mbs, it contained 1 M TEA, 2.5 mM NADP+ in 100 mM KPi (pH 9.0), 25 μM MtPP-Mbs. For MtPE1-Mbs, it contained 1 M TEA, 2.5 mM NADP+
in 100 mM KPi (pH 9.0), 10 μM MtPE1-Mbs. By comparing metal ion effect, ZnPP-Mb/ZnPE1-Mbs showed
the best conversion efficiency in each group.
Table 2-3 Summary of photosensitizer effect in light-chemical energy conversion system (MtPP-Mbs).
Table 2-4 Summary of photosensitizer effect in light-chemical energy conversion system (MtPE1-Mbs)
The highest light-chemical energy conversion efficiency was obtained with optimal concentrations, which contained 1 M TEA, 5 mM NADP+ in 100 mM KPi (pH 9.0), 10 μM ZnPE1-Mb or 25 μM ZnPP-Mb,
photoirradiated for 6 hours and then kept in the dark for 5 days. Figure 2-9 shows the visible spectra change upon photoirradiation and in the dark. Upon photoirradiation, the absorbance at 340 nm, assigned to NADP+ reduction, increased along with the decrease and blue shift of the Soret band of ZnPP-Mb from 428 to 413 nm and of ZnPE1-Mb from 443 nm to 426 nm, respectively. The decrease of Soret band absorbance could be
attributed to conformational change of protein structure and release of ZnPE1 out of protein active site pocket.
Interestingly, the absorbance at 340 nm increased with time even in th dark. After 5 days, approximately 90% and 44.6% of NADP+ was photochemically reduced by ZnPE1-Mb and ZnPP-Mb, respectively. Further,
when ZnPE1-Mb/TEA was first photoirradiated for 6 hrs before adding the NADP+ and kept the whole system
simultaneously added at the beginning. These results indicated that the NADP+ was reduced not photochemicaly but rather chemically following photoirradiation of the solution, consistent with the results previously reported by Nishiyama et al.58,59
Figure 2-9 Change of Uv-vis absorption spectra for (A) ZnPP-Mb and (B) ZnPE1-Mb co-incubated with TEA
and NADP+ under photoirradiation for 6 hr and then kept in the dark for 5 days. [ZnPP-Mb]= 25 μM, [ZnPE1-Mb]= 25 μM, [TEA]= 1 M, [NADP+]= 2.5 mM.
We next compared the effect of protein concentrations on catalytic velocity of ZnPP-Mb and ZnPE1-Mb,
respectively. Figure 4-10 shows the comparison of catalytic velocity for 10 and 25 μ M of ZnPP-Mb/ZnPE1-Mb, respectively, co-incubated with TEA and NADP+ under photoirradiation for 6 hrs. The
arthimetically catalytic velocity of 10 and 25 μ M ZnPP-Mb is 0.08 and 0.125 mM/hr, whereas that of the 10 and 25 μ M ZnPE1-Mb is 0.245 and 0.223 mM/hr, respectively. No apparent reactivity could be detected for
5 mM NADP+ and/or 1 M TEA reacted with apoMb. Interestingly, the catalytic velocity of ZnPP-Mb increased with higher ZnPP-Mb concentration, whereas a decline of catalytic velocity was observed for higher ZnPE1-Mb concentration. Moreover, an approximately two-fold catalytic velocity for ZnPE1-Mb is consistent
with the photo-chemical energy conversion efficiency, indicating the constant life-time of the intermediate.
Figure 2-10 Effect of protein concentration for catalytic kinetics at photoirradiation. 2.5 mM NADP+ with 1 M TEA were reacted with 25 μM (○) , 10 μM (□) of ZnPP-Mb and 25 μM (▽), 10 μM (△ ) of ZnPE1-Mb
under photoirradiated in 100 mM KPi, pH 9. 2.5 mM NADP+ with 1 M TEA reacted without reconstituted Mb (◇) was used as control.
The reduction of NADP+ can occur either by two successive one-electron transfer to form 4,4-(NADP)2 and
4,6-(NADP)2, or by a single-step transfer of two-electron and one hydride to form enzymatically active
1,4-NAD(P)H or inactive 1,6-NAD(P)H.80-83 Either case can cause the increase of absorbance at 340 nm. To elucidate the ZnPP-Mb/ZnPE1-Mb photoirradiated reaction pathway and product identity, we performed
enzymatic anlysis using alcohol dehydrogenase, which catalyzes the two electrons conversion of acetaldehyde to ethanol when NADPH is present, and cytochrome c which acts as single-electron acceptor to reduce ferricytochrome c into ferrocytochrome c.80-83 Figure 2-11 (A) shows the absorbance change of NADPH upon enzymatic reactions. Unexpectedly, when alcohol dehydrogenase was incubated with the photoirradiated product, no apparent decrease of absorbance at 340 nm was observed. In contrast, when photoirradiated product was added to cytochrome c, a characteristic change of Q band from oxidized form at 530 nm into reduced form at 523 and 550 nm was observed (Fig. 2-11 (B)).84 These results indicated that the photoirradiated product may be a (NADP)2 dimer but not an enzymatically active NADPH monomer.
Figure 2-11 The enzymatic analysis of photoinduced reducing product reacted with (A) alcohol dehydrogenase and acetaldehyde (NADPH (□) and photoinduced reducing product (○)), and (B) cytochrome c.
2.5 Reconstituted Metallo-porphyrin Mb Based Light-chemical Energy Conversion
System: Photoinduced Oxidation of NADH
In photoinduced oxidation reaction, the reactive conditions are similar with photoinduced reduction system but the substrate is changed to reducing form of nicotinamide adenine dinucleotide (NADH). The NAD(P)+ and its reduced form NAD(P)H play critical roles in biological system. In addition, Moore et al. recently constructed a photoelectrochemical biofuel cell which incorporates aspects of both enzymatic biofuel cell and dye-sensitized solar cells.17 When porphyrin-sensitized n-type semiconductor photoanode was photoirradiated to induce charge separation, the porphyrin radical cation could be reduced by NAD(P)H, which transfers two electrons to the photoanode and generates NAD(P)+ as substrate for subsequent hydrogenase enzyme oxidation. Based on the homologous catalyzed-reactions between ZnPP/ZnPE1 and ZnPP-Mb/ZnPE1-Mb, we
also attempted to characterize whether NAD(P)H can be oxidized by ZnPP-Mb/ZnPE1-Mb under
photoirradiation and its potential in constructing a self-regenerative photo-chemical energy conversion system. Figure 2-12 shows the UV-vis spectra change of ZnPP-Mb + NADH, ZnPP-Mb + TEA + NADH, ZnPE1-Mb
continued photoirradiation for 36 hr. Photoirradiation of ZnPP-Mb + NADH and ZnPE1-Mb + NADH resulted
in rapid decrease of absorbance at 340 nm, with a steep slope for the former. Conversely, no apparent change at 340 nm was deteced for NADH and NADH + TEA under photoirradiation, indicating the light-dependent NADH oxidation reaction in the ZnPP-Mb and ZnPE1-Mb complex. Interestingly, photoirradiation of
ZnPE1-Mb + NADH in the presence of TEA showed that the abosrbance at 340 nm decreases rapidly for the
first 2 hours and then reduces the reaction rate for the NADH oxidation. Conversely, the absorbance at 340 nm initially decreased but reversely increased after the first 2 hours when ZnPP-Mb + NADH was photoirradiated in the presence of TEA. Moreover, the absorbance decay at 340 nm is slower for ZnPE1-Mb +
TEA + NADH than that of ZnPP-Mb + TEA + NADH. The NADH absorbance profile difference between ZnPP-Mb + NADH and ZnPP-Mb + TEA + NADH suggested that NADH undergoes oxidation to form NAD+ which in the presence of TEA the produced NAD+ is reduced to form (NAD)2 dimer with higher reaction rate
than that of the NADH oxidation. This in turn caused the reverse increase of absorance at 340 nm until the reaction reach equilibrium between oxidation and reduction. For ZnPE1-Mb, the rate of oxidation is faster
than that of the reduction, even in the presence of TEA to catalyze the reduction of NAD+. Therefore, in the presence of TEA, the generated NAD+ can only be partially reduced to (NAD)2 dimer, which can counteract
the oxidation reaction of NADH.
Figure 2-12 Summary of the absorbance change at 340 nm for ZnPP-Mb + NADH (■), ZnPP-Mb + TEA +
NADH (□), ZnPE1-Mb + NADH (●), ZnPE1-Mb + TEA + NADH (○), NADH (▲), and NADH + TEA (△) by
comparing with continued photoirradiation and dark reaction. [ZnPP-Mb] = 25 μM, [ZnPE1-Mb] = 25 μM,
and [TEA] = 1 M and [NADH] = 2.5 mM. All in 20 mM HEPES (pH 8.5).
Furthermore, detailed comparison of the Soret band decay between ZnPP-Mb/ZnPE1-Mb with and without
TEA showed that the presence of TEA in the reaction solution causes blue-shift and decrease of the Soret band whereas no shift was observed in the absence of TEA (Fig. 2-13).
Figure 2-13 UV–visible spectral change under continued photoirradiation for 36 hr. (a) ZnPP-Mb + NADH,
the absorbance at 340 nm was rapidly decrease and the Soret band at 428 nm was also decrease rapidly and a little blue-shift to 421 nm. (b) ZnPP-Mb + TEA + NADH, the absorbance at 340 nm was decrease at first two hours and then increase and Soret band at 428 nm was decrease and blue-shift to 413 nm. (c) ZnPE1-Mb +
NADH, the absorbance at 340 nm was rapidly decrease and the Soret band at 443 nm was decrease gradually and no shift. (d) ZnPE1-Mb + TEA + NADH, the absorbance at 340 nm was slowly decrease and the Soret
band at 443 nm was decrease gradually and blue-shift to 426 nm. [ZnPP-Mb] = 25 μM, [ZnPE1-Mb] = 25 μM,
and [TEA] = 1 M and [NADH] = 2.5 mM. All in 20 mM HEPES (pH 8.5).
To confirm the identity of NAD+ produced by the photoirradiation of ZnPP-Mb or ZnPE1-Mb in the
absence of TEA, the enzymatic oxidation using alcohol dehydrogenase and ethanol as enzyme and substrate, respectively, was performed. Alcohol dehydrogenase can catalyze reversible oxidoredox reaction of ethanol and acetaldehyde, depending on the added NAD+ or NADH in the solution, repectively. When ethanol was oxidized to acetaldehyde, the electron was used to reduce NAD+ into NADH and lead to the absorbance increase at 340 nm. Figure 2-14 shows the comparison of the absorbance change at 340 nm when NAD+, photoirradiated reactant, and photoirradiated product, were used as cofactor for the alcohol dehydrogenase-catalyzed ethanol oxidation. As expected, no absorbance was observed for photoirradiated reactant on alcohol dehydrogenase-catalyzed oxidation reaction, suggesting that NADH cannot be used in alcohol oxidation. On the other hand, the absorbance at 340 nm gradually increased when NAD+ or photoirradiated product was added to the alcohol dehydrogenase-catalyzed oxidation reaction. These results demonstrated the feasibility of ZnPP-Mb/ZnPE1-Mb as photoexcited photosensitizers to oxidize NADH and
Figure 2-14 The enzymatic analysis of alcohol dehydrogenase-catalyzed ethanol oxidation, in the presence of
NAD+ (●), photoirradiated reactant (▲), and photoirradiated product (■). Ethanol and NAD+ reactant were co-incubated for 60 seconds before adding the enzyme and the absorbance change at 340 nm was recorded for every 30 seconds with a total detection time of 5 mins.
2.6
Light-Electric Energy Conversion Study: Myoglobin-Based Bio-Sensitized Solar
Cells
Myoglobin (Mb), reconstituted zinc protoporphyrin-apomyoglobin (ZnPP-Mb), and eosin-modified ZnPP-Mb (Eo-ZnPP-Mb) were used as photosensitizers to functionalize TiO2 nanocrystalline films for
biosensitized solar-cell (BSSC) applications. Reconstitution of ZnPP-Mb and modification of ZnPP-Mb by Eosin was prepared followed the modified method of Zahavy et al (scheme 2-2).63
Scheme 2-2 Reaction to form reconstituted ZnPP-myoglobin (ZnPP-Mb) and Eosin-modified reconstituted
ZnPP-myoglobin (Eo-ZnPP-Mb)
The steady-state absorption and fluorescence spectra of (a) Mb, (b) ZnPP-Mb, (c) Eo-ZnPP-Mb, and (d) Eosin in KPi solution (Fig.2-15) were analyzed. The absorption spectrum of Mb features a broad line at ~410 nm (Fig.2-15 (a)), which originated from the Soret band of the heme (iron-containing porphyrin) prosthetic group in the center. For ZnPP-Mb (Fig.2-15 (b)), the absorption spectrum is consistent with our previous result,85 in which the maxima at 428, 555 and 595 nm are attributed to B(0,0), Q(1,0) and Q(0,0) bands of ZnPP, respectively; the emission maxima are assigned as Q(0,0) and Q(0,1) at 600 and 650 nm, respectively. For Eo-ZnPP-Mb (Fig.2-15 (c)), absorption of Eosin in Eo-ZnPP-Mb is slightly red-shifted (521vs.528 nm) because of the formation of chemical binding between Eosin and Mb moieties. The emission spectrum of
Eo-ZnPP-Mb features the characteristic emissions of both ZnPP and Eosin, indicating no efficient occurrence of energy transfer between those two chromophores.
Figure 2-15 Steady-state spectra of (a) Mb, (b) ZnPP-MB, (c) Eo-ZnPP-Mb and (d) Eosin in KPi buffer with
concentrations of all compounds fixed at 10 μM. The absorption and emission spectra are shown as solid and dashed curves, respectively (excitation wavelength 428 nm for Mb, ZnPP-Mb, and Eo-ZnPP-Mb, but 510 nm for Eosin).
Figure 2-16 (a) and (b) show the picosecond fluorescent decays of Eosin and Eo-ZnPP-Mb in buffer, respectively. To avoid the interference of ZnPP, we fixed the excitation wavelength at 510 nm and set the probe wavelength at 550 nm, which corresponds to the emission maximum of Eosin. After deconvolution with the instrument response function (shown as blue traces), we determined the fluorescence lifetime of free Eosin to be 1.1 ns, consistent with a typical period for S1→T1 intersystem crossing (ISC) of Eosin reported in
the literature.86 For Eo-ZnPP-Mb (Fig.2-16 (b)), the fluorescence transient exhibits a bi-exponential decay with two time coefficients determined to be 0.38 and 1.94 ns. The rapid component of Eo-ZnPP-Mb (0.38 ns), absent from free Eosin, is assigned to result from energy transfer between Eosin and the amino acid of the protein. The slow component of Eo-ZnPP-Mb decayed much more slowly than that of free Eosin (1.94 ns vs. 1.1 ns); we expect that the Eosin moiety was located in a rather hydrophobic environment relative to free Eosin in buffer. Moreover, the rigidity of Eosin bound to protein might be considered to be a factor yielding a greater lifetime. To provide further spectral evidence to prove that Eosin was bound to ZnPP-Mb in Eo-ZnPP-Mb as indicated in Scheme 2-2, we measured the temporally resolved fluorescence anisotropy of free Eosin and Eo-ZnPP-Mb with the same excitation and probe wavelengths.
Figure 2-16 Picosecond time-resolved fluorescence decays of (a) Eosin and (b) Eo-ZnPP-Mb in KPi buffer;
excitation and probe wavelengths fixed at 510 and 550 nm, respectively. The raw data and fitted curves are shown as red and black traces, respectively; the instrument response functions (IRF) are shown as blue traces. The fluorescence decays were deconvoluted with the IRF and the corresponding time coefficients as indicated.
Figure 2-17 shows the corresponding fluorescence transients of Eo-ZnPP-Mb; the time-dependent fluorescence anisotropies of Eosin and Eo-ZnPP-Mb are shown in the inset for comparison. For Eosin alone, the timeresolved fluorescence anisotropy was fitted with a single exponential decay function with a time coefficient less than 0.8 ns, limited by the broad instrument response function (FWHM = 0.75 ns), but the time-resolved fluorescence anisotropy of Eo-ZnPP-Mb persists into the ns time scale. These results indicate that the rotational motion of the Eosin moiety was suppressed in Eo-ZnPP-Mb; Eosin seems to have been firmly bound to ZnPP-Mb as proposed in Scheme 2-2.
Figure 2-17 Fluorescence transient components recorded at various polarizations to construct the
time-dependent anisotropy of Eo-ZnPP-Mb in KPi buffer. The inset shows a comparison of the constructed fluorescence anisotropies of Eosin and Eo-ZnPP-Mb in KPi buffer. F or Eosin (green trace), the decay of the
anisotropy was instrument-limited; for Eo-ZnPP-Mb (black trace), no decay was observed within 0–3 ns. Figures 2-18 (a, b, and c) show absorption spectra of Mb, ZnPP-Mb and Eo-ZnPP-Mb-sensitized TiO2
films (solid curves) and the corresponding absorption spectra in buffer solutions (dashed curves). For Mb-sensitized TiO2 film, apart from the scattering caused by TiO2 nanoparticles, the absorption spectrum
resembles that in buffer solution. The result indicates that the aggregation and the solvation of the Heme porphyrin were suppressed by the surrounding apomyoglobin moiety. In contrast, the hypsochromic shift of the Soret bands in ZnPP-Mb and Eo-ZnPP-Mb-sensitized TiO2 films indicate that ZnPP might reside in a
relatively hydrophobic site.
Figure 2-18 Absorption spectra of (a) Mb, (b) ZnPP-Mb and (c) Eo-ZnPP-Mb immobilized on TiO2 films
(solid curves) and in KPi buffer (dashed curves).
The measured photovoltaic parameters are summarized in Table 2-5; the corresponding I–V curves are demonstrated in figure 2-19. For comparison, the I–V curves of blank TiO2 films before sensitization were
measured as references. For ZnPP-Mb, ISC increased from 43 μA cm−2 for a blank TiO2 film to 55 μA cm−2
for a sensitized TiO2 film, with VOC concurrently increasing significantly from 0.1 V to 0.47 V and FF
increasing from 0.31 to 0.58. The overall efficiency of power conversion was effectively increased from 0.001% for a blank TiO2 film to 0.015% for a ZnPP-Mb-sensitized film. These substantial increases of both ISC and VOC indicate that the electrons in the excited state of ZnPP are efficiently injected into the conduction
band of TiO2 through the surrounding apomyoglobin. For Eo-ZnPP-Mb, the increment of the current density
was even more substantial: ISC increased from 34 μA cm −2
for a blank TiO2 film to 64 μA cm −2
for an Eo-ZnPP-Mb-sensitized TiO2 film, which is more than twice that for the ZnPP-Mb sensitized film. As the
absorbance of the Soret bands of ZnPP were similar in these two films (~0.16), the increase density of photo-induced current reflected the contribution of the Eosin moiety, but the filling factor of the BSSC device made of the Eo-ZnPP-Mb-sensitized film was not great (FF = 0.51), which yields an overall efficiency of power conversion the same as that of the ZnPP-Mb-sensitized film (ε = 0.015%). In contrast, ISC decreased
from 26 μA cm−2 for the blank TiO2 film to 13 μA cm −2
for the Mb-sensitized TiO2 film even though its VOC
increased from 0.16 V to 0.24 V.
Table 2-5 Photovoltaic parameters of bio-sensitized solar cells under illumination (AM 1.5, power 100 mW
blank TiO2 films measured before sensitization.
Figure 2-19 Photovoltaic characteristics of (a) Mb-, (b) ZnPP-Mb- and (c) Eo-ZnPP-Mb-sensitized solar cells,
performed under illumination at AM 1.5, and 100 mW cm−2. For comparison, the IV-characteristics of individual blank TiO2 films before sensitization are shown as dashed curves
3. Conclusion
In conclusion, for the study of light-chemical energy conversion, we have constructed a bifunctional photo-induced oxidoredox system which, upon irradiation, can transfer electrons from NAD(P)H or to NAD(P)+, depending on the presence or absence of sacrificial electron donor. The ZnPP-Mb or ZnPE1-Mb
protein pocket can prevent the quenching aggregate and extend the lifetime of charge separation. In addition, the efficiency of the NADP+ reduction using ZnPE1-Mb is approximately two-fold greater than that of the
system using ZnPP-Mb. In parallel, the ZnPP-Mb/ZnPE1-Mb artificial photosynthetic system carried out a
step-to-step one electron transfer mechanism upon photo induced charge transfer. Finally, the ZnPP-Mb/ZnPE1-Mb artificial photosynthetic system can be realized as a potential bio-photosentizer and
our reliance on fossil fuels.
In the study of light-electric energy conversion, we characterized three bio-sensitized solar cells (BSSCs) fabricated with myoglobin (Mb), reconstituted zinc protoporphyrin-apomyoglobin (ZnPP-Mb), and eosin-modified reconstituted zinc protoporphyrin-apomyoglobin (Eo-ZnPP-Mb) as photosensitizers.The Mb-sensitized SC exhibits a poor cell performance because of the internal electron transfer that reduces Fe(III) to Fe(II) so that a small photocurrent is observed.For both ZnPP-Mb- and Eo-ZnPP-Mb-sensitized SCs, the efficiencies of power conversion were found to be enhanced ten times those of their unsensitized counterparts (blank TiO2 SC), through efficient electron injection from the proteins to TiO2 that improves the charge
separation between TiO2 and the sensitizer and decreased current leakage between TiO2 and the
electrolyte.The present work provides the first practical example of BSSC devices made with artificial proteins as potential photosensitizers. Relative to a typical DSSC, the power conversion efficiency of a BSSC was still too small because the extent of immobilization of the proteins on the surface of TiO2 was too
slight.Work is in progress to improve the cell performance of BSSC under investigation by increasing the adsorption of the proteins on TiO2 films and by seeking more appropriate bio-related electrolytes.
4. Experimental Materials and Procedures
4.1 Materials
Protoporphyrin IX was obtained from Sigma-Aldrich. Metal-chloride was obtained from Fluka, Merck and Sigma-Aldrich. 5-(4-carboxy-phenylethynyl)-10,20-biphenylporphinato zinc(II) (ZnPE1) was a gift and
synthesized by C. Y. Lin lab (Chi Nan University, Department of Applied Chemistry, Taiwan). Nicotinamide adenine dinucleotide (NAD+) and nicotinamide adenine dinucleotide phosphate (NADP+) was obtained from Fluka. Triethanolamine (TEA), ethanol and actealdehyde was obtained from Merck. Zinc protoporphyrin (ZnPP), myoglobin (Mb) from horse heart muscle, alcohol dehydrogenase from saccharomyces cerevisiae, and cytochrome c form horse heart were purchased from Sigma and used without further purification. The nanocrystalline TiO2 films are kindly supplied by Eric W.-G Diau Lab. All other chemicals were analytical
grade and obtained from Merck and Sigma-Aldrich.
4.2 Methyl Ethyl Ketone Method- Obtain Wild-type Apo-myoglobin from Myoglobin
Apo-Mb was prepared by the modified butanone method of heme extraction.61 In brief, to extract the heme prosthetic group we dissolved horse-heart myoglobin (100 mg) in PBS buffer (ice-cold, salt-free, 30 mL) and adjusted to pH 2.0 with HCl (0.1 M). The denatured protein solution was treated with ice-cold methyl-ethyl ketone (an equal volume) and shaken well until a hazy, pale yellow, protein layer separated from the dark brown, heme-containing layer. To remove residual heme from Mb we washed the aqueous phase further with ice-cold methyl-ethyl ketone (three portions). The resulting aqueous layer was dialyzed twice against ddH2O
and then repeatedly against a phosphate buffer solution (10 mM, pH 6.8). The resulting apo-Mb solution was divided into parts and preserved at −20 ℃ until use.
4.3 Reconstitution of Apo-myoglobin with Metallo-protoporphyrins
Reconstitution of metallo-protoporphyrin into apomyoglobin followed the modified method of Axup et al.61 Briefly, a 1.5-fold stoichiometric amount of metallo-protoporphyrin in 100 mM KPi/pyrimidine (1/1, v/v,
500μl) solution (1.66 mg) was dropwisely added to an apomyoglobin solution in 100 mM KPi/DMSO (4/1) buffer pH 12 (7.5 mL) cooled in an ice bath. After incubation for 15 min, the solution was adjusted to pH 6.8 and slowly stirred at 4℃ for additional 6 hrs. The solution was transferred into a dialysis membrane against ddH2O, with two changes of ddH2O to remove organic solvent, followed by additional dialysis against
100 mM KPi buffer pH 6.8 for overnight. The solution was then filtrated with 0.2 μ m cellulose membrane before applied to a Sephadex G-25 column, equilibrated with 100 mM KPi buffer pH 6.8, and eluted with the same buffer at 4℃. The protein band was collected and stored at -20℃ for later experiments.
4.4 Steady-state Spectral Measurements
UV/visible absorption spectra of reconstituted metallo-protoporphyrin and reconstituted metallo-protoporphyrin myoglobin were recorded with a standard spectrophotometer (Cary 50, Varian). Emission spectra were measured with a composite CCD spectrometer (USB2000FLG, Ocean Optics). The excitation source contains a pulsed diode-laser head (LDH-P-C-400, PicoQuant) coupled with a laser-diode driver (PDL-800B, PicQuant) that produces excitation pulses at 430 nm with an average power ~300 μW.
4.5 Time-Resolved Fluorescence Measurements
To measure lifetimes on a picosecond scale and anisotropy, we used a time correlated single-photon counting spectrometer (TCSPC, Fluo-Time 200, PicoQuant), with excitation from either a femtosecond laser system (Verdi-V10 and Mira 900D, Coherent) at 430 nm (doubled from a 860 nm beam output) or a picosecond laser system (LDH-P-C-440 and PDL-800B, PicoQuant) at 435 nm; the instrument response is ~30 ps with the femtosecond laser system but increases to ~80 ps with the picosecond laser system. The experiment to measure the femtosecond up-conversion is described elsewhere.62 Briefly, the femtosecond laser system generates output pulses at 860 nm with a duration ~150 fs at a repetition rate of 76 MHz. The frequency of the laser at 860 nm was doubled for excitation (λex= 430 nm). The emission was collected with
two parabolic mirrors and focused onto a crystal (BBO type I); the gate pulse was also focused onto the BBO crystal for sum-frequency generation. On varying the temporal delay between gate and excitation pulses via a stepping-mirror translational stage, we obtained a temporal profile. The polarization between pump and probe pulses was fixed at the magic angle 54.7°.
4.6 Photoinduced Reduction of NADP
+and Oxidation of NADH
Figure 3-2 Photo chemical reactor
Photoirradiation reaction was carried out in a photochemical reactor PR-2000 (PANCHUM, Kaohsiung, Taiwan) at room temperature (25 oC) using two RPR 4190 Å lamps that show an emission maximum at 419 ± 15 nm at half bandwidth. The light intensity at the cell is 6 mW/cm2. For photoreduction reaction,
photoirradiation was carried out in a final volume of 1 mL of 100 mM phosphate buffer (pH 9.0) containing 25 μ M ZnPP- 1-Mb), 2.5 mM of NADP+, and 1 M TEA. For photooxidation reaction,
25 μ M of ZnPP-Mb or ZnPE1-Mb and 2.5 mM NADH were used, but TEA was omitted from the reaction
solution. The reaction solution was photoirradiated at 419 nm for 6 hrs and the change in the absorbance at 340 nm, which attributed to (NADP)2 or NAD+ formation, was recorded.
4.7 Preparation of Eosin-Modified ZnPP-Mb
ZnPP-Mb was modified with eosin-5-isothiocyanate (Eosin) following the modified method of Zahavy et
al.63 Eosin reacts with amino and sulfhydryl groups on proteins to form a covalent bond according to these reactions:
Eosin-N C S+H2N-protein→Eosin-NH-CS-protein Eosin-N C S+HS-protein→Eosin-NH-CS-S-protein
To prepare the concentrated solution (1 mg ml−1) Eosin was first dissolved in phosphate buffer (0.1 M, pH 8). The freshly prepared ZnPP-Mb was first adjusted to pH 7.5 before adding the prepared eosin reagent.The molar ratio of protein:eosin was 1:3.5. Following the addition of eosin reagent, the solution was stirred for 20 h at 4 ℃ in the dark. The resulting solution was dialyzed twice (each dialysis was conducted for 3 h) against KPi buffer (1 L, pH 8).The eosin-modified ZnPP-Mb (Eo-ZnPP-Mb) solution was purified through gel filtration on a column (Sephadex G-10, 2×5 cm), using KPi buffer (10 mM, pH 8) as eluent. The Eo-ZnPP-Mb fraction was identified spectrometrically (wavelength 524 nm). The modification efficiency was calculated assuming an absorption coefficient of Eosin ε = 83,000 M−1 cm−1.The modification efficiency of eosin to protein was observed between 1:1 and 2:1.
4.8 Protein Immobilization on TiO
2Films
The factors that let redox proteins adsorb on a TiO2 film are an electrostatic interaction between protein and
film and a covalent binding between a cationic site on a metal surface (Ti) and oxygen of the carboxylate group. The isoelectric point of TiO2 has been shown to be in a region 6.1–6.3; the surface charge of TiO2 film
became negative when the pH was adjusted above 6.3. As the isoelectric point of Mb was 7.2, the pH of the buffer solution was adjusted to 7, so that the protein surface was positively charged while the TiO2 surface
was negatively charged Mb, ZnPP-Mb, and Eo-ZnPP-Mb protein samples (20 μL, 0.1 mM) were individually dropped onto TiO2 films and incubated at 4 ℃ for four days. After protein adsorption, the TiO2 films were
rinsed with KPi buffer (10 mM, pH 7.0) to remove the non-immobilized protein. The protein-immobilized TiO2 films were dried with N2 and subsequently subjected to spectral and photovoltaic measurements.
4.9 Photovoltaic Measurements
The performance of a DSSC device was examined through measurement of an I–V curve with a solar simulator (AM 1.5, Newport-Oriel 91160). The solar simulator uses filters and other optical components to mimic a solar radiation with an air mass 1.5 spectrum; the output intensity is evenly distributed to illuminate a large area. When the device was irradiated with the solar simulator, the source meter (Keithley 2400, computer-controlled) sent a voltage V to the device; photocurrent I was read at each step controlled with a computer via a GPIB interface. The solar simulator was calibrated with a Si-based reference cell (S1133, Hamamatsu) and an IR-cut filter (KG5) correct the spectral mismatch of the lamp. The actively illuminated area was 0.16 cm2 for all measurements.