Factors Associated with Free Adult Preventive Health Care Utilization among Physically Disabled People in Taiwan: Nationwide Population-based Study
Suh-May Yen1, 2 Pei-Tseng Kung3 Wen-Chen Tsai1*
1. Department of Health Services Administration, China Medical University, Taichung, Taiwan 40402, R.O.C.
2. Department of Chinese Medicine, Nantou Hospital, Nantou, Taiwan, R.O.C.
3. Department of Healthcare Administration, Asia University, Taichung, Taiwan 41354, R.O.C.
Suh-May Yen: [email protected] Pei-Tseng Kung: [email protected] Wen-Chen Tsai: [email protected]
*Corresponding author:Professor Wen-Chen Tsai, Dr.PH
Address:No. 91 Hsueh-Shih Road, Taichung, Taiwan 40402, R.O.C Tel:886-422073070; fax:886-4-22028895
Abstract
Background: Few previous studies have specifically addressed the health care utilization situation of the physically disabled. This study aimed to investigate the utilization of free adult preventive health care for physically disabled people and it’s affecting factors.
Methods: The data was obtained from three nationwide databases from 2006 to 2008. This study comprised 329,264 physically disabled people in Taiwan above the age of 40 who had eligible health checks during 2008. We employed descriptive statistics to analyze the use and rate of free preventive health care use by physically disabled adults. Logistic regression analysis was used to explore the factors that affect physically disabled adults’ use of free adult preventive health care.
Results: 16.37% of the physically disabled adults used free adult preventive health care. Women (17.66%), married (17.16%), a junior high education level (17.89%), and mildly disabled adults (18.77%) had the highest use rate among various participant subgroups. The variables that significantly influenced the use of free adult preventive health care by the physically disabled included gender, age, education, marital status, urbanization of the residence areas, monthly payroll, aboriginal status, catastrophic illnesses status, relevant chronic diseases, and severity of disability.
Conclusions: Physically disabled using preventive health care tend to be low. Governments should use the media to reinforce propagation and education of these services to specific,
low-utilization groups, and encourage doctors to actively provide preventive health care to communities.
Keywords: physical disability, disability, adult health examination, preventive health care
Background
2] , depression[3] , and other complications, these patients lack the motivation to participate in various activities. Physically disabled people often have a sedentary lifestyle, leading to become overweight and obese [4-6]. Being overweight and obese cause changes in the modes of carbohydrate metabolism, increasing the prevalence of diabetes, hyperlipidemia,
hypertension, and cardiovascular disease [7, 8]. A 2002 study showed that people with disabilities in their lower extremities are 2.5 times the overweight and obesity ratio of average persons, and 40% of people with chronic spinal cord injuries are overweight or obese[9].
Nosek et al. (2008) found that physically disabled women had 4 times the likelihood of suffering from diabetes, and 2 times[10] the likelihood of suffering from hypertension than do average women. Studies have shown that those with spinal cord injuries have a higher
prevalence of diabetes and coronary heart disease [11-13].Poliomyelitis patients have a higher hyperlipidemia occurrence than the average person, and typically have two or more coronary artery disease risk factors [14]. Until the end of 2011, Taiwan’s physically disabled population (386,217 people) accounted for 1.66% of the total population, and constituted the group with the most people (35.09%) [15, 16]with mentally or physically disabilities
(handicapped).
The disabled population has increased annually, consuming the government’s health care and long-term care resources and producing a significant financial burden and challengefor society[17-20].Maciosek et al. (2010) believed that if the government expanded the
promotion of free preventive health care utilization for all population, it would save US $3.7 billion annually in medical care expenditures[21]. Increasing the utilization of free preventive health care can delay disease progression, reduce the severity of the disease, and effectively reduce medical expenses derived from complications [22-25]. Eliminating the inequities of disabled persons in health and medical care is the goal of the US Healthy People for 2020[26].
Besides the cancer screening, Taiwan Health Promotion Administration provides at least six free preventive health care programs, including mammography, pap smear test, prenatal examination for pregnant women, children preventive health services, adult preventive health services, and children dental examination with fluoride varnish. The adult free preventive health care includes physical examinations, health education, and blood and urine tests. Adults aged 40 and above are legible this free service, but different age groups have varying frequency limits.
Because of the low mobility of physically disabled people, their medical care time is lengthened. Difficulties in receiving free preventive health care among the disabled people would lead to delay in receiving appropriate medical care. Previous studies showed gender, marital status[16], educational level, age, income, health status, severity of disability, and urbanization level would influence the utilization of preventive health services for the disabled people[27]. Much of the literature related to the disabled people focused on the
secondary conditions of the disability, leaving a scarcity of research on the preventive health care needs of this disabled population. Few previous studies have specifically addressed the health care utilization situation of the physically disabled. This study used physically disabled people as participants to explore their free adult preventive health care utilization and its related factors, and to serve as a reference for adjusting preventive health policies for disadvantaged groups.
Methods
Data Source and Participants
The premise for the use of free adult preventive health care includes (1) people suffering from poliomyelitis and older than 35 years (use once a year), (2) people aged between 40 to 64 years (once every three years), and (3) people aged 65 or older (once a year). The data were obtained from three national databases, and all three national databases were managed by the government. The Disabled People Registry File (2008) obtained from the Ministry of the Interior, the free preventive health care file (2006 to 2008) provided from the Health Promotion Administration and the National Health Insurance Research Database (2006 to 2008) released by the Ministry of Health and Welfare.
This study comprised 329,264 physically disabled people in Taiwan above the age of 40 who had eligible health checks during 2008. Among these, 153,117 were mildly disabled, 128,201 were moderately disabled, 44,097 were severely disabled, and 3,849 were extremely
severely disabled. Among the 35 to 39 year-old disabled adults, since there was no way to distinguish who were poliomyelitis persons in the Disabled People Registry File and we could not analyze the utilization rate and likelihood of using preventive health care, this group was excluded when the analyses were conducted.
In the present study, demographic characteristics and severity of disability were obtained from the Disabled People Registry File (2008). Socioeconomic status, health status, and the environmental factor were merged from the National Health Insurance Research Database, which is publicly available. The information of using the free adult preventive health care among the physically disabled people was identified from the free preventive health care file (2006 to 2008).
After we applied and were approved to use these three databases, the personal
identifications including ID number and name were used to exactly match all people’s data or information in these three databases in the Statistics Center of the Ministry of Health and Welfare, Taiwan. All personal information could be completely linked among these three national databases. All individual’s identification information has been deleted and personal privacy was protected in using these data. This study was approved by the research ethics committee of China Medical University and Hospital (IRB No. CMU-REC-101-012). Variables Description
The variables in this study were (1) demographic characteristics (i.e., gender, age, marital status, education, aboriginal status); (2) socioeconomic status (i.e., monthly insured payroll); (3) health status (i.e., catastrophic illness/injury, type of chronic illnesses including
15 comprehensive categories of chronic diseases such as cancer, endocrine and metabolic disease, mental illness, disease of nervous system, disease of circulatory system, disease of respiratory system, disease of digestive system, disease of urinary system, disease of skeletal and muscular system and connective tissue, disease of eyes and auxiliary organs, infectious disease, congenital malformation, skin and subcutaneous tissue disorders, disease of blood
and blood-forming organs, and disease of ear and mastoid process), severity of disability (i.e., very severe, severe, moderate, and mild); and (4) environmental factors (i.e., urbanization level of residence area,URA; eight levels: Level 1 being the highest urbanized areas, and Level 8 being the lowest). The dependent variable that whether the physically disabled persons used the adult preventive health care was identified in the year 2008 for those aged 65 or older(once per year) and identified in the period of 2006- 2008 for those aged between 40 and 64 (once every three years). The other relevant independent variables, including
demographic, socioeconomic, health status, severity of disability, and environmental factors were obtained in the year 2008 from three national databases. The chronic disease groups used in this study were based on “the Range of Chronic Diseases” in the National Health Insurance Research Database. The chronic diseases listed in the Range of Chronic Diseases were defined by the Bureau of National Health Insurance in Taiwan, which consisted of 16 categories of chronic diseases. Since the “others” category had very few patients in the disabled people, this study excluded the “others” category in our analysis.
Statistical Analysis
This study used descriptive statistics analysis, chi-squared test, and multiple logistic
regression analysis to explain the relationship between the variables. The first step used
descriptive statistics to analyze the physically disabled people’s free adult preventive health care utilization quantity and ratio, focusing on their demographic characteristics,
socioeconomic status, health status, environmental factors, and other variables. The second step used the chi-square test to compare the difference in physically disabled people’s use of free preventive health care. Since all variables had a p value < 0.05 in the chi-squared test in table 1, we placed all variables into the logistic regression analysis to explore the factors that affected the use of free adult preventive health care among the physically disabled people. Under the criteria for assessing model fit, the log-likelihood statistics for the fitted model indicated the model fitted well. This study used statistical software package SAS version 9.3 as an analysis tool. Statistics less than P <0.05 were significant.
Results
Physically Disabled People’s Basic Information
Table 1 showed that there were 329,264 physically disabled people during 2006 to 2008. Over half of these were male (58.2%; n = 191,566). In the age category, most participants were older than or equivalent to 70 years of age (34.2%; n = 112,521), followed by
married (58.5%; n = 192,456). Participants with education levels less than or equivalent to elementary school accounted for the majority (51.1%; n=168,180), followed by junior high level (14.9%; n = 49,103). Regarding monthly insured payroll, the insured dependent
population accounted for the majority (i.e., children and spouses; 34.0%; n = 111,998). There were few people of aboriginal status, only accounting for 2.2% (n = 7,105). Mildly disabled (46.5%; n = 153,117) was the largest group in the physical disability severity level category. Physically Disabled People’s Free Preventive Health Care Utilization
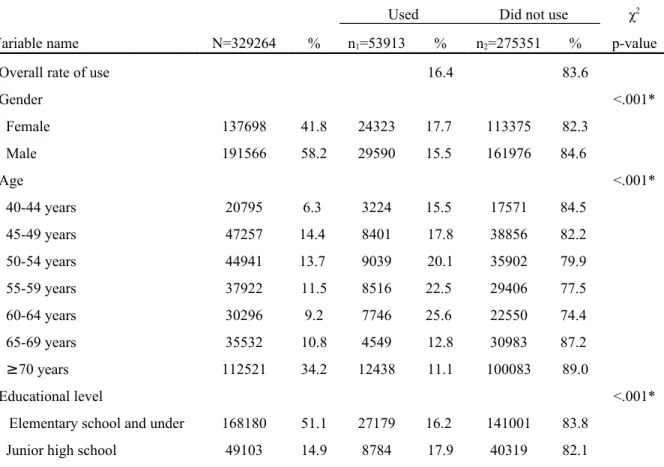
In this study, 16.4% (n = 53,913) of the physically disabled utilized free adult preventive health care (Table 1). Men and women’s utilization rates were 15.5% and 17.7% (P < 0.05), respectively. The men’s utilization rate was slightly lower than the women’s. Regarding age distribution, the 50 to 64 year-old group had the higher physically disabled utilization rate, more than 20%. The 60 to 64 year-old group had the greatest utilization (25.6%). Married people had a higher utilization rate (17.2%) than did the others (15.2% - 15.7%, P < 0.05).
For education, junior high and senior (vocational) high school had greater utilization rates: 17.9% and 17.1%, respectively. Those with URA Level 8 had the greatest utilization rate (19.1%), and Level 1 had the smallest (10.9%). For income, those with a monthly insured payroll of NT $30,300 to 36,300 (22.3%) had the highest rate. Those with aboriginal status had higher utilization rates (24.1%) than did non-aborigines (16.2%, P < 0.05). In the relevant chronic diseases category, people with "diseases of the ear and mastoid process" (21. 2%) had
a higher utilization rate, and utilization rate for those with cancer (13.1%) was less than those without cancer (16.5%, P < 0.05). Regarding severity of disability, those with mild disability had the highest utilization rate (18.8%) (P < 0.05).
Factors Related to Use of Free Adult Preventive Health Care
As shown in Table 2, this study found that gender, age, education, marital status,
urbanization of residence area (URA), monthly insured payroll, aboriginal status, catastrophic illnesses status, relevant chronic diseases, and severity of the disability had significant effects on the use of free adult preventive health care by the physically disabled (P < 0.05).
The logistic regression analysis showed that physically disabled men had a slightly lower free adult preventive health care utilization rate, only 0.82 times that of women (95%
CI=0.80-0 84). In the age aspect, using 40 to 44 year olds as a reference group, the 60 to 64 age group’s utilization rate was 1.41 times greater than the reference rate (OR=1.41, 95% CI=1.34-1.48). The lowest rate was among those older than or equivalent to 70 years, which only had 0.46 times that of the 40 to 44 age group (OR=0.46, 95% CI=0.44-0.48). There were significant differences between urban and rural life. Utilization by those in Level 8 areas (rural) was 1.72 times higher (OR=1.72, 95% CI=1.63-1.82) than by those in Level 1 areas (urban). Using the lowest monthly insured payroll (i.e., less than NT $15,840) as a reference, the NT $30,300 to 36,300 group had 1.27 times the utilization rate of the reference group (OR=1.27, 95% CI=1.21-1.33).
Those with aboriginal status had a higher utilization rate, which was 1.21 times higher than that of non-aborigines (OR=1.21, 95% CI=1.14-1.28). Those with junior college or university educations or above had a utilization rate of only 0.95 times that of those with elementary school educations and below (OR=0.95, 95% CI, 0.91-0.99). Those who were married had 1.11 times the utilization rate (OR=1.11, 95% CI=1.07-1.15) of those who were unmarried. Those with a catastrophic illness/injury had a lower utilization rate, only 0.86 times (OR=0.86, 95% CI=0.83-0.89) that of those without catastrophic illness/injury.
Relevant chronic diseases (except for cancer, diseases of the nervous system, and diseases of the urinary system, which had less utilization than those who were not afflicted), had a higher utilization rate than those not suffering from relevant chronic diseases. Those with “severe” disability had the lowest utilization rate among the severity of disability categories, which was 0.8 times (OR=0.80, 95% CI=0.78-0.83) that of the “mild” category.
Discussion
Comparing Taiwan’s disabled people’s utilization of free adult preventive health care, mental illness was the highest, being 1.47 times that of the physically disabled (OR=1.47, 95% CI=1.37-1.45); second was that of the hearing impaired (OR =1.22, 95% CI=1.19-1.24), which was 1.22 times[16] that of the physically disabled. Compared to the free preventive health care utilization rate of all population (34.2%), the physically disabled had a much
lower utilization rate (16.37%)[28].
This study found that women had a higher free preventive health care utilization rate than did men. This was consistent with the results of previous studies [29-31]. It is possible that women are more concerned with health-related messages, and therefore have a higher utilization rate [32]. For age, the group with the lowest utilization rate was the above-70 group. Whether this was related to elderly handicapped persons mostly living in nursing homes and other institutions [33] or because they have geriatric chronic diseases that cause them to frequently visit hospitals or clinics and not necessary for preventive care remains a valuable topic for future research.
For area of residence, the free preventive health care utilization rates among the physically disabled living in URA Levels 5, 6, 7, and 8 were higher than those living in Levels 1, 2, 3, and 4. Preventive health care utilization rates were higher in rural areas than in urban areas. Although urban areas have closer proximity to care, there are no designated personnel to encourage the public to conduct health checks. Rural areas have a slower pace of living, and people like to participate in free preventive health care with their neighbors. In addition, Taiwan’s government has attached importance to the medical gap between urban and rural areas, regularly sending medical patrol vehicles to remote areas to provide medical care and to strengthen publicity. Therefore, those in rural areas have higher preventive health care
Regarding socioeconomic status, previous studies have shown higher income earners have higher preventive health care utilization rates [34-36]. The study results showed that those with a monthly insured payroll higher than NT $15,840 (except for NT $48,200 to 57,800) have a higher utilization ratio than those earning less than NT 15,840, which was consistent with previous study results. Those with aboriginal status had a higher utilization rate than did non-aborigines. These results implied that since the majority of aboriginal people live in remote areas, the government assigns medical patrol vehicles to regularly provide medical care and preventive health care in remote areas, and then the aborigine’s utilization rate was increased, which reflected the efforts of decreasing the health disparity between residents in urban areas and residents in remote areas. The utilization rate for education level decreased with increases in education. Those with junior college or university or above had the lowest rate. In recent years, various high-end, self-paying preventive health care programs have increased in popularity. Those with junior college or university educations or above and those with monthly insured payroll of NT $48,200 to 57,800 have been selecting these high-end, self-paying preventive health care programs because of their higher social economic statuses.
For marital status, married people had a higher adult preventive health care than did unmarried people. These results support the study conducted by Doescher et al. (2004)[29]. Married people tend to have more fixed residence and places of medical care than do unmarried people. They have more opportunities to become familiar with health care
professionals and are more likely to accept preventive health care through their
recommendations or to be informed by health care messages. In addition, married people have stronger social network (e.g., family members, relatives, and friends) support than do
unmarried people, serving as a reminder for their health-promoting behaviors [37, 38]. For health status, those with a catastrophic illness/injury had a lower utilization rate than did those who did not have a catastrophic illness/injury. This result differed from that of the American behavioral risk factor surveillance system (BRFSS)[39].Whether this was due to the physically disabled people’s catastrophic illnesses/injuries making them weak and less mobile is unknown. Regarding the suffering from related chronic diseases category, those with diseases of the digestive system appeared most frequently. This was similar to the results that 58% or more of the patients suffered from constipation, one-third had regular abdominal pain, and 62% had irritable bowel syndrome in a 1998 study on spinal cord injury (SCI)[40]. Regarding the severity of the disability, the greater the level of severity, the lower the
probability of preventive health care used. The finding is consistent with that in the study conducted in the United States (2004) [39]. The disabled individuals with higher severity of physical disability would highly depend on assistance of caregivers and leaded to low participation in the preventive health care.
Generally speaking, if the physically disabled people regularly receive free preventive health care, the disease could be early diagnosed and be early treated. If the disease is a
miinor problem, it could be improved through changes in health behaviors, lifestyle or diet pattern besides necessary medical care received. For the aged people with physical
disabilities, if they have chronic diseases, they should visit physicians regularly to treat and control their illnesses. Both regularly receiving preventive health examinations and treating existent diseases are important for the aged and physically disabled people.
Limitations
In the present study, in order to understand the specific diseases or illness systems influencing the use of preventive health care among the physically disabled people, we included 15 types of chronic diseases as the variable instead of chronic diseases index such as Elixhauser. Thus, this study could not examine the relationship between uses of preventive health care and severity of chronic diseases. In addition, the database did not contain the lifestyle, health beliefs and behaviors of the participants, making further analyses difficult. These were the limitations of this study.
Conclusions
The study results indicated that the factors that primarily affect physically disabled people’s use of preventive adult health care are gender, age, and education, urbanization of the residence area, income, aboriginal status, catastrophic illness and severity of disability.
There is room for improvement regarding free adult preventive health care for
catastrophic illness/injury, among those living in urban areas, unmarried people, those with higher education levels, and seniors who are physically disabled. According to these findings,
this study recommends the following: (1) to increase accessibility and convenience, medical institutions should strengthen barrier free space planning. Designated service windows, parking, and bathroom facilities should establish for those who are physically disabled to enhance their mobility. (2) Encourage physicians to actively provide preventive health care services for communities and to take the initiative, reminding handicapped people to obtain regular checkups and follow-ups. (3) Preventive health care for handicapped people requires extra time, labor, and costs than for the public. The government should improve the payment of physicians who conduct preventive health care among handicapped people. Their pay should be increased according to the severity of the patient’s disability to increase the willingness [41] of physicians to perform preventive health care for handicapped people. (4) The extension of media-based publicity and education for the public and medical institutions for the handicapped is recommended. A study in Taipei in 1998 found that 70% of those who had not received adult preventive health care did not know about this service[42].
List of abbreviations
BRFSS: behavioral risk factor surveillance system; CI: Confidence interval;
NT$: New Taiwan Dollar; OR: Odds Ratio;
SC I: spinal cord injury;
URA: urbanization level of residence area;
Competing interests
The author(s) declare that they have no competing interests.
Authors’ contributions
WCT and PTK conducted the study design. SMY drafted the manuscript. PTK and SMY conducted the statistical analysis. WCT is supervisor of the study and revised the manuscript critically for important intellectual content. All authors read and approved the manuscript.
Authors' information
1. Department of Health Services Administration, China Medical University, Taichung, Taiwan 40402, R.O.C.
2. Department of Chinese Medicine, Nantou Hospital, Nantou, Taiwan, R.O.C.
3. Department of Healthcare Administration, Asia University, Taichung, Taiwan 41354, R.O.C.
Acknowledgements
This study was supported by grants (100-asia-21, CMU101-ASIA-14, DOH100-TD-B-111-004) from China Medical University, Asia University and the Department of Health. The
preventive health care files were obtained from the Bureau of Health Promotion, Department of Health in Taiwan. We are also grateful for use of the National Health Insurance Research Database provided by the Department of Health, Taiwan. The interpretations and conclusions contained herein do not represent those of the Bureau of Health Promotion in Taiwan.
Reference
1. Sjolund BH: Pain and rehabilitation after spinal cord injury: the case of sensory spasticity? Brain Res Brain Res Rev 2002, 40(1-3):250-256.
2. Ravenscroft A, Ahmed YS, Burnside IG: Chronic pain after SCI. A patient survey. Spinal Cord 2000, 38(10):611-614.
3. Martz E, Livneh H, Priebe M, Wuermser LA, Ottomanelli L: Predictors of
Psychosocial Adaptation Among People With Spinal Cord Injury or Disorder Archives of Physical Medicine and Rehabilitation 2005, 86(6):1182-1192.
4. Balboa-Castillo T, Guallar-Castillon P, Leon-Munoz LM, Graciani A, Lopez-Garcia E, Rodriguez-Artalejo F: Physical activity and mortality related to obesity and functional status in older adults in Spain. Am J Prev Med 2011, 40(1):39-46. 5. Chen Y, Henson S, Jackson AB, Richards JS: Obesity intervention in persons with
spinal cord injury. Spinal Cord 2006, 44(2):82-91.
6. Santiago M, Coyle C: Leisure-time physical activity and secondary conditions in women with physical disabilities. Disability and Rehabilitation 2004, 26(8):485-494. 7. Capewell S, Buchan I: Why have sustained increases in obesity and type 2 diabetes
not offset declines in cardiovascular mortality over recent decades in Western countries? Nutr Metab Cardiovasc Dis 2012, 22(4):307-311.
8. Cascio G, Schiera G, Di Liegro I: Dietary Fatty acids in metabolic syndrome, diabetes and cardiovascular diseases. Curr Diabetes Rev 2012, 8(1):2-17. 9. Anson CA, Shepherd C: Incidence of secondary complications in spinal cord
injury. International Journal of Rehabilitation Research 1996, 19(1):55-66.
10. Nosek MA, Robinson-Whelen S, Hughes RB, Petersen NJ, Taylor HB, Byrne MM, Morgan R: Overweight and obesity in women with physical disabilities:
associations with demographic and disability characteristics and secondary conditions. Disabil Health J 2008, 1(2):89-98.
11. Bauman WA: The potential metabolic consequences of cerebral palsy: inferences from the general population and persons with spinal cord injury. Dev Med Child Neurol 2009, 51 Suppl 4:64-78.
12. Bauman WA, Spungen AM: Coronary heart disease in individuals with spinal cord injury: assessment of risk factors. Spinal Cord 2008, 46(7):466-476.
13. Yekutiel M, Brooks ME, Ohry A, Yarom J, Carel R: The prevalence of
hypertension, ischaemic heart disease and diabetes in traumatic spinal cord injured patients and amputees. Paraplegia 1989, 27(1):58-62.
14. Gawne AC, Wells KR, Wilson KS: Cardiac risk factors in polio survivors. Arch Phys Med Rehabil 2003, 84(5):694-696.
15. Statistical yearbook of interior - The disabled population by cause
[http://sowf.moi.gov.tw/stat/year/y04-19.xls ]
16. Kung PT, Tsai WC, Li YH: Determining factors for utilization of preventive health services among adults with disabilities in Taiwan. Res Dev Disabil 2012,
33(1):205-213.
17. Wolinsky FD, Culler SD, Callahan CM, Johnson RJ: Hospital resource consumption among older adults: a prospective analysis of episodes, length of stay, and
charges over a seven-year period. J Gerontol 1994, 49(5):S240-252.
18. Allen SM, Ciambrone D: Community care for people with disability: blurring boundaries between formal and informal caregivers. Qual Health Res 2003, 13(2):207-226.
19. Van Nostrand JF, Miller B, Furner SE: Selected issues in long-term care: profile of cognitive disability of nursing home residents and the use of informal and formal care by elderly in the community. Vital Health Stat 3 1993(27):143-185.
20. Anderson G, Knickman JR: Changing the chronic care system to meet people's needs. Health Aff (Millwood) 2001, 20(6):146-160.
Health affairs 2010, 29(9):1656-1660.
22. Gandjour A: Aging diseases--do they prevent preventive health care from saving costs? Health economics 2009, 18(3):355-362.
23. Macnab AJ, Rozmus J, Benton D, Gagnon FA: 3-year results of a collaborative school-based oral health program in a remote First Nations community. Rural and remote health 2008, 8(2):882.
24. Malach M, Baumol WJ: Opportunities for the cost reduction of medical care. Journal of community health 2009, 34(4):255-261.
25. Rodriguez Vazquez C, Garcillan R, Rioboo R, Bratos E: Prevalence of dental caries in an adult population with mental disabilities in Spain. Spec Care Dentist 2002, 22(2):65-69.
26. Healthy People 2020
[http://healthypeople.gov/2020/TopicsObjectives2020/pdfs/HP2020_brochure_with_L HI_508.pdf]
27. Huang KH, Tsai WC, Kung PT: The use of Pap smear and its influencing factors among women with disabilities in Taiwan. Res Dev Disabil 2012, 33(2):307-314. 28. Adult preventive health care services utilization and providing current service effectiveness analysis study [http://www.mmh.org.tw/mmhaff/file/read/100.02.22_ %E6%88%90%E4%BA%BA%E9%A0%90%E9%98%B2%E4%BF%9D
%E5%81%A5%E6%9C%8D%E5%8B%99%E4%B9%8B%E5%88%86%E6%9E %90%E7%A0%94%E7%A9%B6.pdf]
29. Doescher MP, Saver BG, Fiscella K, Franks P: Preventive care. J Gen Intern Med 2004, 19(6):632-637.
30. Owens GM: Gender differences in health care expenditures, resource utilization, and quality of care. Journal of managed care pharmacy 2008, 14(3 Suppl):2-6. 31. Bertakis KD, Azari R, Helms LJ, Callahan EJ, Robbins JA: Gender differences in
the utilization of health care services. The Journal of family practice 2000, 49(2):147-152.
32. Horch K, Wirz J: People's interest in health information. Bundesgesundheitsblatt, Gesundheitsforschung, Gesundheitsschutz 2005, 48(11):1250-1255.
33. Haveman M, Perry J, Salvador-Carulla L, Walsh PN, Kerr M, Van Schrojenstein Lantman-de Valk H, Van Hove G, Berger DM, Azema B, Buono S et al: Ageing and health status in adults with intellectual disabilities: results of the European POMONA II study. Journal Of Intellectual & Developmental Disability 2011, 36(1):49-60.
34. Katz SJ, Hofer TP: Socioeconomic disparities in preventive care persist despite universal coverage. Breast and cervical cancer screening in Ontario and the United States. JAMA 1994, 272(7):530-534.
35. Rodriguez MA, Ward LM, Perez-Stable EJ: Breast and cervical cancer screening: impact of health insurance status, ethnicity, and nativity of Latinas. Annals of family medicine 2005, 3(3):235-241.
36. Hewitt M, Devesa SS, Breen N: Cervical cancer screening among U.S. women: analyses of the 2000 National Health Interview Survey. Preventive medicine 2004, 39(2):270-278.
37. Goldman N, Korenman S, Weinstein R: Marital status and health among the elderly. Soc Sci Med 1995, 40(12):1717-1730.
38. Suarez L, Lloyd L, Weiss N, Rainbolt T, Pulley L: Effect of social networks on cancer-screening behavior of older Mexican-American women. J Natl Cancer Inst 1994, 86(10):775-779.
39. Diab ME, Johnston MV: Relationships between level of disability and receipt of preventive health services. Archives of physical medicine and rehabilitation 2004, 85(5):749-757.
40. De Looze D, Van Laere M, De Muynck M, Beke R, Elewaut A: Constipation and other chronic gastrointestinal problems in spinal cord injury patients. Spinal Cord 1998, 36(1):63-66.
41. Tsai WC, Kung PT, Chiang HH, Chang WC: Changes and factors associated with dentists' willingness to treat patients with severe disabilities. Health Policy 2007, 83(2-3):363-374.
42. Ho LL: The utilization and its determinants of Adult Preventive Care under National Health Insurance-A case in Taipei. National Taiwan University Department of Public Health.; 1998.
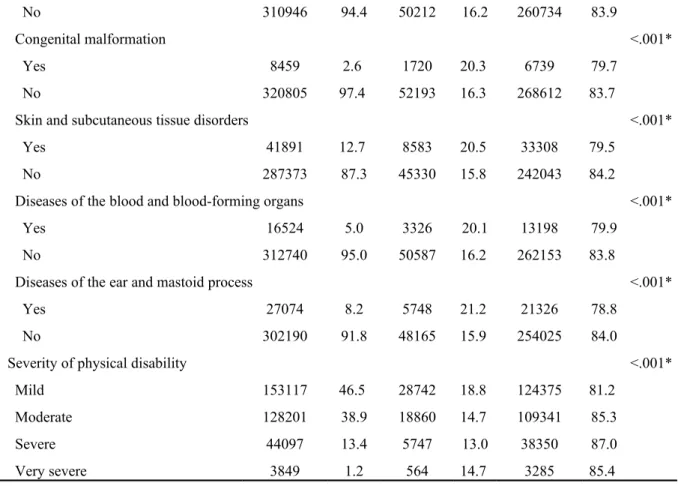
Table 1 Use of adult preventive health services among the physical disability: basic characteristics and bivariate analysis.
Used Did not use χ2
Variable name N=329264 % n1=53913 % n2=275351 % p-value
Overall rate of use 16.4 83.6
Gender <.001* Female 137698 41.8 24323 17.7 113375 82.3 Male 191566 58.2 29590 15.5 161976 84.6 Age <.001* 40-44 years 20795 6.3 3224 15.5 17571 84.5 45-49 years 47257 14.4 8401 17.8 38856 82.2 50-54 years 44941 13.7 9039 20.1 35902 79.9 55-59 years 37922 11.5 8516 22.5 29406 77.5 60-64 years 30296 9.2 7746 25.6 22550 74.4 65-69 years 35532 10.8 4549 12.8 30983 87.2 ≥70 years 112521 34.2 12438 11.1 100083 89.0 Educational level <.001*
Elementary school and under 168180 51.1 27179 16.2 141001 83.8 Junior high school 49103 14.9 8784 17.9 40319 82.1
Senior (vocational) high school 45345 13.8 7740 17.1 37605 82.9 Junior college and
university or above 23908 7.3 3491 14.6 20417 85.4 Unclear 42728 13.0 6719 15.7 36009 84.3 Marital status <.001* Married 192456 58.5 33027 17.2 159429 82.8 Unmarried 30357 9.2 4630 15.3 25727 84.8 Divorced or widowed 14209 4.3 2234 15.7 11975 84.3 Unclear 92242 28.0 14022 15.2 78220 84.8 Level of urbanizationa <.001* Level one 28966 8.8 3158 10.9 25808 89.1 Level two 66465 20.2 10372 15.6 56093 84.4 Level three 47461 14.4 7860 16.6 39601 83.4 Level four 28536 8.7 4503 15.8 24033 84.2 Level five 51000 15.5 9053 17.8 41947 82.3 Level six 39836 12.1 6739 16.9 33097 83.1 Level seven 43417 13.2 7717 17.8 35700 82.2 Level eight 23583 7.2 4511 19.1 19072 80.9 Table 1 (Continued)
Used Did not use χ2
Variable name N=329264 % n1=53913 % n2=275351 % p-value
Monthly insured payroll <.001*
Insured dependents 111998 34.0 14367 12.8 97631 87.2 <15,840 66219 20.1 10338 15.6 55881 84.4 16,500-22,800 100385 30.5 18934 18.9 81451 81.1 24,000-28,800 14864 4.5 3288 22.1 11576 77.9 30,300-36,300 13942 4.2 3113 22.3 10829 77.7 38,200-45,800 12768 3.9 2643 20.7 10125 79.3 48,200-57,800 9088 2.8 1230 13.5 7858 86.5 Aborigine <.001* Yes 7105 2.2 1713 24.1 5392 75.9 No 322159 97.8 52200 16.2 269959 83.8 Catastrophic illness/injury <.001* Yes 40645 12.3 6072 14.9 34573 85.1
Chronic diseases
Cancer <.001*
Yes 12916 3.9 1695 13.1 11221 86.9
No 316348 96.1 52218 16.5 264130 83.5
Endocrine and metabolic disease <.001*
Yes 136530 41.5 27829 20.4 108701 79.6 No 192734 58.5 26084 13.5 166650 86.5
Mental illness <.001*
Yes 80162 24.4 16410 20.5 63752 79.5
No 249102 75.7 37503 15.1 211599 84.9
Disease of the nervous system <.001*
Yes 72140 21.9 12796 17.7 59344 82.3
No 257124 78.1 41117 16.0 216007 84.0
Disease of the circulatory system <.001*
Yes 184863 56.1 33763 18.3 151100 81.7
No 144401 43.9 20150 14.0 124251 86.1
Disease of the respiratory system <.001*
Yes 81821 24.9 16381 20.0 65440 80.0
No 247443 75.2 37532 15.2 209911 84.8
Table 1 (Continued)
Used Did not use χ2
Variable name N=329264 % n1=53913 % n2=275351 % p-value
Disease of the digestive system <.001*
Yes 131055 39.8 27593 21.0 103462 79.0
No 198209 60.2 26320 13.3 171889 86.7
Disease of the urinary system <.001*
Yes 18007 5.5 3325 18.5 14682 81.5
No 311257 94.5 50588 16.3 260669 83.8
Disease of the skeletal and muscular system and connective tissue <.001*
Yes 153030 46.5 30622 20.0 122408 80.0
No 176234 53.5 23291 13.2 152943 86.8
Disease of the eyes and auxiliary organs <.001*
Yes 35599 10.8 6716 18.9 28883 81.1
No 293665 89.5 47197 16.1 246468 83.9
Infectious diseases <.001*
No 310946 94.4 50212 16.2 260734 83.9
Congenital malformation <.001*
Yes 8459 2.6 1720 20.3 6739 79.7
No 320805 97.4 52193 16.3 268612 83.7
Skin and subcutaneous tissue disorders <.001*
Yes 41891 12.7 8583 20.5 33308 79.5
No 287373 87.3 45330 15.8 242043 84.2
Diseases of the blood and blood-forming organs <.001*
Yes 16524 5.0 3326 20.1 13198 79.9
No 312740 95.0 50587 16.2 262153 83.8
Diseases of the ear and mastoid process <.001*
Yes 27074 8.2 5748 21.2 21326 78.8
No 302190 91.8 48165 15.9 254025 84.0
Severity of physical disability <.001*
Mild 153117 46.5 28742 18.8 124375 81.2 Moderate 128201 38.9 18860 14.7 109341 85.3
Severe 44097 13.4 5747 13.0 38350 87.0
Very severe 3849 1.2 564 14.7 3285 85.4
aLevel one: the most urbanized areas.
*P<0.05
Table 2 Factors influencing the physical disabled to use adult preventive health services: logistic regression analysis.
Unadjusted Adjusted
Variable name OR 95% CI p-value OR 95% CI p-value Gender Female 1 - - - 1 - - -Male 0.85 0.84 0.87 <.001* 0.82 0.80 0.84 0.001* Age 40-44 years 1 - - - 1 - - -45-49 years 1.18 1.13 1.23 <.001* 1.13 1.08 1.18 <.001* 50-54years 1.37 1.31 1.43 <.001* 1.21 1.16 1.27 <.001* 55-59 years 1.58 1.51 1.65 <.001* 1.25 1.19 1.31 <.001* 60-64 years 1.87 1.79 1.96 <.001* 1.41 1.34 1.48 <.001* 65-69 years 0.80 0.76 0.84 <.001* 0.55 0.52 0.58 <.001* ≥70 years 0.68 0.65 0.71 <.001* 0.46 0.44 0.48 <.001*
Elementary school and under 1 - - - 1 - - -Junior high school 1.13 1.10 1.16 <.001* 1.01 0.98 1.04 0.596 Senior (vocational) high school 1.07 1.04 1.10 <.001* 0.99 0.96 1.02 0.519 Junior college and
university or above 0.89 0.85 0.92 <.001* 0.95 0.91 0.99 0.026* Unclear 0.97 0.94 1.00 0.029* 0.99 0.96 1.02 0.609 Marital status Married 1 - - - 1 - - -Unmarried 1.15 1.11 1.19 <.001* 1.11 1.07 1.15 <.001* Divorced or widowed 1.04 0.98 1.10 0.200 1.05 0.99 1.11 0.103 Unclear 1.00 0.96 1.03 0.832 0.96 0.92 1.00 0.028* Level of urbanizationa Level one 1 - - - 1 - - -Level two 1.51 1.45 1.58 <.001* 1.55 1.48 1.62 <.001* Level three 1.62 1.55 1.70 <.001* 1.67 1.60 1.75 <.001* Level four 1.53 1.46 1.61 <.001* 1.52 1.45 1.60 <.001* Level five 1.76 1.69 1.84 <.001* 1.79 1.71 1.87 <.001* Level six 1.66 1.59 1.74 <.001* 1.69 1.61 1.77 <.001* Level seven 1.77 1.69 1.85 <.001* 1.79 1.71 1.88 <.001* Level eight 1.93 1.84 2.03 <.001* 1.72 1.63 1.82 <.001*
Table 2 (Continued)
Unadjusted Adjusted
Variable name OR 95% CI p-value OR 95% CI p-value Monthly insured payroll
<15,840 1 - - - 1 - - -Insured dependents 0.80 0.77 0.82 <.001* 0.92 0.89 0.95 <.001* 16,500-22,800 1.26 1.22 1.29 <.001* 1.19 1.15 1.23 <.001* 24,000-28,800 1.54 1.47 1.60 <.001* 1.26 1.20 1.32 <.001* 30,300-36,300 1.55 1.49 1.63 <.001* 1.27 1.21 1.33 <.001* 38,200-45,800 1.41 1.35 1.48 <.001* 1.17 1.11 1.23 <.001* 48,200-57,800 0.85 0.79 0.90 <.001* 0.84 0.78 0.90 <.001* Aborigine No 1 - - - 1 - - -Yes 1.64 1.56 1.74 <.001* 1.21 1.14 1.28 <.001* Catastrophic illness/injury No 1 - - - 1 - - -Yes 0.88 0.86 0.91 <.001* 0.86 0.83 0.89 <.001* Chronic diseases Cancer 0.76 0.73 0.81 <.001* 0.87 0.82 0.93 <.001* Endocrine and metabolic disease 1.64 1.61 1.67 <.001* 1.34 1.31 1.37 <.001* Mental illness 1.45 1.42 1.48 <.001* 1.18 1.15 1.21 <.001* Disease of the nervous system 1.13 1.11 1.16 <.001* 0.95 0.93 0.97 <.001* Disease of the circulatory system 1.38 1.35 1.40 <.001* 1.24 1.21 1.27 <.001* Disease of the respiratory system 1.40 1.37 1.43 <.001* 1.22 1.19 1.25 <.001* Disease of the digestive system 1.74 1.71 1.77 <.001* 1.40 1.37 1.43 <.001* Disease of the urinary system 1.17 1.12 1.21 <.001* 0.97 0.93 1.01 0.124
Disease of the skeletal and muscular
system and connective tissue
1.64 1.61 1.67
<.001*
1.29 1.26 1.32
<.001*
Disease of the eyes and
auxiliary organs 1.21 1.18 1.25
<.001*
1.02 0.99 1.05 0.200 Infectious diseases 1.32 1.27 1.37 <.001* 1.11 1.06 1.15 <.001* Congenital malformation 1.31 1.25 1.39 <.001* 1.00 0.95 1.06 0.915 Skin and subcutaneous
tissue disorders 1.38 1.34 1.41
<.001*
1.18 1.15 1.22 <.001* Diseases of the blood and
blood-forming organs 1.31 1.26 1.36
<.001*
Table 2 (Continued)
Unadjusted Adjusted
Variable name OR 95% CI p-value OR 95% CI p-value Diseases of the ear and
mastoid process 1.42 1.38 1.47
<.001*
1.10 1.07 1.14 <.001* Severity of physical disability
Mild 1 - - - 1 - -
-Moderate 0.75 0.73 0.76 <.001* 0.84 0.82 0.86 <.001* Severe 0.65 0.63 0.67 <.001* 0.80 0.78 0.83 <.001* Very severe 0.74 0.68 0.81 <.001* 0.92 0.84 1.01 0.082
aLevel one: the most urbanized areas.