國立交通大學
顯示科技研究所
碩士論文
設計與製作無莫爾條紋之具方向性背光系
統以應用於攜帶型立體影像顯示器
Design and Fabrication of Moiré-Free
Dual Directional Backlight System
for 3D Mobile Display
研究生:葉耀中
指導教授:謝漢萍 教授
設計與製作無莫爾條紋之具方向性背光系
統以應用於攜帶型立體影像顯示器
Design and Fabrication of Moiré-Free
Dual Directional Backlight System
for 3D Mobile Display
研 究 生: 葉耀中
Student: Yao-Chung Yeh
指導教授: 謝漢萍 Advisor: Dr. Han-Ping D. Shieh
國立交通大學 電機學院
顯示科技研究所
碩士論文
A Thesis
Submitted to Display Institute
College of Electrical and Computer Engineering
National Chiao Tung University
in Partial Fulfillment of the Requirements
for the Degree of Master
In
Display Institute
June 2006
HsinChu, Taiwan, Republic of China.
設計與製作無莫爾條紋之具方向性背光系
統以應用於攜帶型立體影像顯示器
研究生:葉耀中 指導教授:謝漢萍 教授
國立交通大學顯示科技研究所
摘要
本論文針對 1.8 吋立體影像顯示器,設計與製作一個無莫爾條紋之具方向性 背光系統。根據前人所提出的溝槽結構,輔以消除莫爾條紋的原理,可得到一組 最佳化的背光系統,不但能夠達到完善的光學特性,諸如角度分布,均勻度以及 出光效率等等,並且能夠針對現今技術遇到的瓶頸-莫爾條紋,加以改善。另外, 並針對時間多工顯示器在電路上遇到的瓶頸提出可行的解決方案,使得一個完整 的以時間多工為驅動方式的立體影像顯示器能付諸實現。 在固定溝槽週期的最佳化設計中,搭配 30%霧度的擴散片,可以達到 87%的 均勻度,視角分布在 9 度到 77 度之間,視距在 7 公分到 20.52 公分。另外驅動 電路利用連續掃描兩個同樣畫面的方法以消除兩眼的干擾,同時畫面的更新頻率 可以達到 47.5 赫茲。根據以上所述的設計,一個完整的時間多工立體影像顯示 器得已實現。Design and Fabrication of Moiré-Free
Dual Directional Backlight System
for 3D Mobile Display
Student: Yao-Chung Yeh Advisor: Prof. Han-Ping D Shieh
Display Institute
National Chiao Tung University
Abstract
The moiré-free dual directional backlight system is designed for 1.8 inch 3D mobile phone usage. After analyzed the theory of moiré effect and optimized the micro-groove structures proposed, a moiré-free dual directional backlight system can be obtained. Furthermore, a driving system designed for solving crosstalk is proposed and demonstrated in this thesis work.
The optimized design of fixed groove pitch for lightguides with 30% haze diffuser can reach uniformity of 87%, viewing angle between ±9° and ±77° and viewing distance between 7 cm and 20.52 cm. The double scanning driving scheme can efficiently resolve image crosstalk, and each frame rate can reach 47.5 Hz. Additionally, the color separation is eliminated by the vertical alignment between lightguides and color filter. Based on these performances of lightguides and the improvement of driving scheme, a time-multiplexed display has been demonstrated.
致謝
首先要感謝指導教授謝漢萍兩年來在研究、表達能力、英文能力與生活細節 的細心指導,並提供了良好的實驗室研究環境,使我對立體影像顯示器技術與平 面顯示器技術有更深入的研究與了解,並順利完成本篇論文與碩士學位。 在實驗室的日子裡,首先要感謝陳均合學長對我研究進度上的督促。而實驗 室其他的學長姊們,如黃乙白、簡克偉、韋安琪、莊喬舜、楊柏儒、林泩宏、李 企桓、鄭裕國、劉康宏及 Wallen 等人也提供了許多寶貴的經驗與意見,讓我受 益匪淺。同時要感謝傳偉、奕智、琬琳、宣儀、秀鳳、明倫、俞文等人在課業、 研究、生活上的幫助與分享,並陪我一起度過兩年碩士班的日子。另外實驗室活 潑的學弟妹與助理小姐們也讓實驗室充滿歡愉的氣氛。 此外,我要感謝友達光電的諸位合作同仁提供我寶貴的意見及實質的協助, 讓整個研究進展的更順利。另外也要感謝工研院機械所林宗信先生在背光板製作 上的協助。 最後,對於我摯愛的家人、好友及其他關心我的人,感謝你們的陪伴、支持 與鼓勵,與生活的點滴分享,讓我在能夠屢次能度過低潮,使我能快樂地研究與 學習,並順利完成碩士班的學業。這份喜悅謹與每位關心我的人分享。Table of Contents
Abstract (Chinese) ………. i
Abstract (English) ……….ii
Acknowledgments ………... iii
Table of Contents ………..iv
Figure Caption ………vii
List of Tables ………xi
Chapter 1 Introduction ……….……….. 1
1.1 Preface ……….1
1.2 Principle of 3D vision ………...……… 2
1.3 Introduction to 3D Display Technology……… 4
1.3.1 Stereoscopic displays……….…4
1.3.2 Auto-stereoscopic displays………5
1.3.3 Comparisons between Various 3D Methods………..7
1.3.4 Stereo Pair Type……….8
1.3.5 Summary………..12
1.4 Motivation and Objective of this thesis ………...12
1.5 Organization of this thesis……….13
Chapter 2 Design of Moiré-Free Dual Directional B/L System…………...14
2.1 Introduction...………...14
2.2 Moiré Effect……….14
2.3 Moiré Pattern Analysis………...15
2.3.1 Geometric Analysis Method………15
2.4 The Shape of Moiré Pattern………...18
2.4.1 Closed Periods of Two Structures………18
2.4.2 General Cases………...20
2.5 Design of Directional Lightguide………...22
2.6 Summary………..25
Chapter 3 Essential Technologies and Instruments………26
3.1 Introduction……….26
3.2 Diamond Turning………26
3.3 Driving System………....27
3.4 Measurement Instruments……….……29
Chapter 4 Simulation Results and Discussions………31
4.1 Introduction……….31
4.2 Simulation Software………31
4.3 Simulation Model of Moiré-Free Dual Directional Backlight System………...31
4.3.1 Simulation Setting………33
4.3.2 Crucial Properties in Simulation………..34
4.4 Simulation Results………..37
4.4.1 Fixed Groove Width Design by Y. M. Chu………..37
4.4.2 Discrete Micro-groove Distribution……….40
4.4.3 Fixed Groove Gap Design………...41
4.4.4 Fixed Groove Pitch Design………..45
4.5 Summary………..47
Chapter 5 Experimental Results and Discussions………48
5.1 Introduction……….48
5.2.2 Fixed Groove Pitch Design………..52
5.3 Discussion………55
5.4 Summary………..59
Figure caption
Fig. 1.1 Historical development of the electronic displays………...2 Fig. 1.2 Depth clues and display factors………...4 Fig. 1.3 Examples of 3D methods: (a) volumetric 3D display system with
rasterization hardware; (b) a solid-state multi-planar volumetric display; (c)DSHARP - a wide screen multi-projector display; (d) color images with the MIT holographic video display; (e) The concept of integral imaging; (f) stereo pairs type (this figure shows
the spatial-multiplexed type.) ……….7 Fig. 1.4 Principles of the spatial-multiplexed and time-multiplexed types. ………9 Fig. 1.5 A 3D display using field-sequential LCD with light direction
controlling backlight (2001) [20]. ………10 Fig. 1.6 Dual directional backlight for stereoscopic LCD (2003) [21]. ……….11 Fig. 1.7 3D mobile display based on sequentially switching backlight with
focusing foil (2004) [22]. ……….11 Fig. 1.8 3D mobile display based on dual directional stacked lightguides (2005) [23].11 Fig. 2.1 An example of a moiré effect that occurs due to the superposition of two
identical periodic layers with a small angle difference. ………...15 Fig. 2.2 Transmittance distribution vs. location - the spectral spectrums of the
grating transmittance are pseudo square waves. ………..16 Fig. 2.3 The expression of function in the Fourier domain diagram. ………18 Fig 2.4 Periods difference of two structures vs. moiré pattern periods. When the
periods of two structures are very close but not the same and have the
identical alignment. ………19 Fig 2.5 The relationship of moiré pattern periods and period’s ratio between two
structures. (The ratio of moiré pattern is the multiples of the minimum
period between two original structures) ……….21 Fig 2.6 The relationship of ratio of periods, angle θ, and moiré pattern period. ……...22 Fig 2.7 The configuration of time-multiplexed display proposed by Y. M. Chu. …….23 Fig 2.8 The shape of micro-groove structures and the parameters related to groove. ...23 Fig 2.9 The method to suppress moiré pattern (a) continuous and (b) discrete
distribution of micro-groove structures. ………24 Fig 2.10 Schematics of alignment with color filter and two lightguides. (a) parallel
alignment and (b) vertical alignment. ………25 Fig 3.1 Fabrication process of diamond turning. ………...27 Fig 3.2 Driving scheme for time-multiplexed display. Image crosstalk is happened
when the light source is switched. ……….27 Fig 3.3 Driving scheme proposed to decrease image crosstalk. ………28 Fig 3.4 Schematics of Conoscope. ……….30 Fig 4.1 Simulation model with parallel alignment between two lightguides and color
filter. ………...32 Fig 4.2 Simulation model with parallel alignment between two lightguides and color
filter. ………...33 Fig 4.3 The shape of micro-groove structures and the parameters related to groove….34 Fig 4.4 Color filter in the simulation model (a) parallel and (b) vertical alignment.…..34 Fig 4.5 Distribution function of groove gap and x coordinate by the fixed groove
width design. ………..38 Fig 4.6 Simulation results designed with fixed groove width by Y. M. Chu. (a)
angular distribution and (b) uniformity. ……….39 Fig 4.7 Moiré pattern simulated results with the fixed groove width by the parallel
Fig 4.8 Top view of the discrete micro-groove structures distribution design. ……….41 Fig 4.9 Moiré pattern simulated results with the discrete micro-groove distribution
by the parallel alignment between color filter and two lightguides. …………..41 Fig 4.10 Distribution function of groove width and x coordinate by the fixed groove..42 Fig 4.11 Simulation results designed with fixed groove gap. (a) angular distribution and
(b) uniformity. ………..43 Fig 4.12 Moiré pattern simulated results with the fixed groove gap by the
parallel alignment between color filter and two lightguides. ………...44 Fig 4.13 Distribution function of groove width and x coordinate by the fixed
groove pitch design. ……….…45 Fig 4.14 Simulation results designed with fixed groove pitch. (a) angular distribution
and (b) uniformity. ………...46 Fig 4.15 Moiré pattern simulated results with the fixed groove pitch by the parallel
alignment between color filter and two lightguides. ………47 Fig. 5.1 Measurement of uniformity. ……….49 Fig. 5.2 The angular distribution of lightguides by fixed groove gap design. ………...50 Fig. 5.3 The photos of (a)lightguides and (b) lightguides with panel by fixed groove
gap design. ………...51 Fig. 5.4 The angular distribution of lightguides with 30% haze diffuser by fixed groove
gap design. ………...51 Fig. 5.5 The photos of (a) lightguides with 30% haze diffuser and (b) lightguides
with panel and 30% haze diffuser by fixed groove gap design. ………..52 Fig. 5.6 The angular distribution of lightguides by fixed groove pitch design. ………53 Fig. 5.7 The photos of (a)lightguides and (b) lightguides with panel by fixed
groove pitch design. ……….54 Fig. 5.9 The photos of (a) lightguides with 30% haze diffuser and (b) lightguides
with panel and 30% haze diffuser by fixed groove pitch design. ………55 Fig. 5.10 The images of (a) lightguides with panel and (b) lightguides with panel
and 30% haze diffuser by fixed groove gap design. ………..56 Fig. 5.11 The images of (a) lightguides with panel and (b) lightguides with panel
and 30% haze diffuser by fixed groove pitch. ………...57 Fig. 5.12 The comparisons among prior arts and the model proposed by Y. M. Chu. ..59 Fig. 6.1 The diagram of (a) current and (b) redesigned color filter. ………..61
List of Tables
Table 1.1 Comparisons between various 3D displays.……….8 Table 5.1 Comparisons among several haze diffusers. ………..58
Chapter 1
Introduction
1.1 Preface
Since Information technologies (IT) progress, there are lots of discoveries and products bring deep and far impact on the civilization. In particular, the electronic display technology, which goes deep into many fields, such as entertainment, education, military and communication, motivate people to develop more powerful and comfortable display technologies.
For the electronic display technology, there are several milestones in past 120 years as shown in Fig. 1.1 [1]. In 1897, K. F. Braun invented the cathode ray tube (CRT) which is the earliest ancestor of the following various kinds of CRT monitors and TVs. The success of the CRT opened the door to the development of flat panel display (FPDs) technology such as liquid crystal displays (LCDs) and plasma display panels (PDPs). They are getting more and more popular after 1990s because they not only provide comparable image quality with CRT but have compact sizes and low power consumption.
During these years, significant progress has been made in image qualities and compact instruments, i.e. from black-and-white to color types and bulky to compact sizes. Numerous scenes and information are reproduced and spread by the electronic displays. However, the image qualities which are still not as good as the real vision perceived by human eyes in the real world are concerned. The display performances of the above-mentioned technologies are limited by one viewpoint of the objects. In another word, there is no stereoscopic sense in the display images which are classified
as 2D display.
For getting images closer to the real world, the 2D display images seem more and more inadequate. Therefore, to develop for natural viewing and practical needs, 3D display technology is expected to be the next generation display technology and shall plays an important role in the future.
Fig. 1.1 Historical development of the electronic displays.
1.2 Principle of 3D Vision
Three-dimensional information is formed by complex activities in the brain and obtained by the visual system. A lot of related researches have been made in this field [2]. There are several clues to depth perception by the visual sense as shown in Fig. 1.2 [3-4].
Convergence
Convergence is effective when the distance between eyes and objects is within 20 m. Convergence rapidly loses its influence on the visual system as the distance increases because the convergence angle becomes smaller.
Binocular Parallax
Binocular parallax occurs when there are other objects in front of or in the rear of the object on which the right-left eyes are focused. If the degree of this binocular
sensation of depth before and after the object. The binocular parallax is valid and precise in distinguishing the depth difference, i.e. the difference in the distance between several objects. It plays the important role in understanding the relative position of objects within 10 m.
Accommodation and Motion Parallax
Accommodation is only effective when the observation distance is no more than 3 m. Depth perception obtained by motion parallax provides important information to depth perception.
Others
Visual information received by one eye is not the same as that through the other eye, but we perceive these data as a single image. Namely, binocular vision which appears to be based on interaction of the right and left images is an important function in the design of a 3D display. Besides, the distance between the pupils of the human eyes is approximately 65 mm which is adopted when considering the viewing condition.
Fig. 1.2 Depth clues and display factors.
1.3 Introduction to 3D Display Technologies
The first of 3D display went back to the early 1800s. However, most applied 3D technologies were proposed after the middle of 20th century. The 3D displays have their widespread applications today. Generally speaking, the 3D Display can be divided into stereoscopic displays and auto-stereoscopic displays.
1.3.1 Stereoscopic displays
Stereoscopic displays are needed to wear a device, such as polarized glasses, which ensures the left and right eye’s views are received by the correct eye. Many stereoscopic displays have been proposed [5-6]. Most of them have widely used in
close to, some devices to separate the left and right eye’s views. Those requirements limit the widespread attraction of stereoscopic displays as personal displays.
1.3.2 Auto-stereoscopic displays
Auto-stereoscopic displays do not require the user to wear any device to separate the left and right views and instead send them directly to the correct eye. This removes a crucial obstacle to the appealing of 3D display.
Various auto-stereoscopic technologies have been proposed. The principles of several technologies [7] are discussed in the following.
Volumetric type
There are many kinds of technologies to form the volumetric type display. The common point is to produce the object in the real space. One is to draw 3D profiles on a scattering medium with a scattering laser beam [8], as shown in Fig 1.3(a). Another is to project or scan layered images on a spatial designed screen to create a volumetric image profile [9-10], as shown in Fig. 1.3(b). The other is to induce psychological effects with use of a super-large image projection screen [11], as shown in Fig 1.3(c).
Holography
Holography is utilized the laser beam to form the illumination beam and reference beam. Thereafter, the interference fringes can be displayed by the superposition of rays from each object point [12], as shown in Fig 1.3(d).
Integral imaging
Integral imaging is composed of a micro-lens array, the pickup device, and the display device. By means of micro-lens array, the pickup device can pick up several images with the different angles. By combining these pick up images, the 3D images can be revealed, as shown in Fig 1.3(e).
The stereo pair type is including spatial-multiplexed and time-multiplexed display. These displays are utilized the spatial or time multiplexed sequence of many different viewing images to form the 3D perception. The spatial-multiplexed displays including parallax barrier and lenticular lens are shown in Fig 1.3(f). (The time-multiplexed display is introduced below)
Method (b) Method (c)
Method (a)
Fig. 1.3 Examples of 3D methods: (a) volumetric 3D display system with rasterization hardware; (b) a solid-state multi-planar volumetric display; (c) DSHARP - a wide screen multi-projector display; (d) color images with the MIT holographic video display; (e) The concept of integral imaging; (f) stereo pairs type (this figure shows the spatial-multiplexed type.)
There are two ways to generate the sense of depth. The first one is to simulate the objects in the real space, as mentioned by methods (a) to (d). The other is to directly
Method (d) Method (e) Method (f) Display device Pickup device Reconstructed image Elemental image Object Lens array Display Pickup
send pairs of parallax images to each eye respectively, as mentioned by method (e) and (f).
1.3.3 Comparisons between Various 3D Methods
According to the 3D image qualities, system size and cost, each 3D method has their advantages and disadvantages as shown in Table 1.1[19]. The major drawback of stereoscopic display is needed to wear a device. Moreover, the volumetric display often has the drawbacks of bulky and 3D effect limitation. Furthermore, the holographic display has the poor feasibility due to the requirement of ultrahigh technical support. The concept of integral imaging is similar to the stereo pair but has the drawback of low image resolution. Among above-mentioned the 3D methods, the overall evaluations of the stereo pair type are the most appealing, not only has compatibility with the current 2D display technology but also maintain the image qualities. Besides, the stereo pairs display has higher feasibility than the other 3D methods. Therefore, the stereo pair display is widely applied for most of available auto-stereoscopic displays.
Table 1.1 Comparisons between various 3D displays.
Auto-stereoscopic Stereoscopic
Volumetric Holographic Stereo Pair Natural depth ㄨ-△ ㄨ-△ △-○ △-○ Viewer comfort ○ ㄨ-△ △-○ △-○ Group viewing ○ ○ ○ △-○ Compact size ○ ㄨ-△ ㄨ △-○ Moderate price ○ ㄨ-△ ㄨ ○ ○ △-○ ㄨ-△ ○ Compatibility: 2D/3D ○ △-○ △ ○ No degrade image quality ○: Possible △: Some cases possible ㄨ: Impossible
1.3.4 Stereo Pair Type
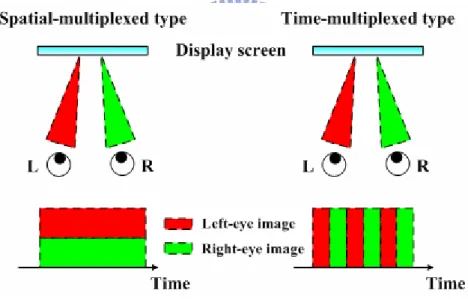
Based on the image display methods, the stereo pair type can also be divided into two types: spatial-multiplexed (or time-parallel) and time-multiplexed types. The spatial-multiplexed type displays the stereo pairs at the same time and the time-multiplexed type displays the stereo pairs sequentially, as shown in Fig. 1.4.
Both of them require viewing zone forming optics to send the stereo pairs to the correct eye. The viewing zone is a region where the viewers can see the whole images displayed on the screen. There are two viewing zones to match each eye, than forming a complete 3D vision. In order to form the 3D perception, each display system is needed a specific optical power.
Fig. 1.4 Principles of the spatial-multiplexed and time-multiplexed types.
For the spatial-multiplexed method, the well-known examples are the flat panel with a lenticular screen or a parallax barrier, as shown in Fig. 1.3(f). The usage of the lenticular screen or the parallax barrier is to separate the images displayed on the panel to form the parallax images. However, lower resolution is the major drawback of spatial-multiplexed type display because the parallax images are revealed on the panel at the same time. Furthermore, the parallax barrier decreases the image
brightness.
For the time-multiplexed method, its development was restricted in early periods because the fast response time display was not available. In 2001, a 3D display using field-sequential LCD with light direction controlling backlight was proposed [20], as shown in Fig. 1.5. Its viewing zones were formed by a lenticular sheet and a LC shutter. The direction of light can be controlled by switching the LC shutter. Another method was proposed in 2003 [21]. Its viewing zone is formed by a lightguide and a double-edged prism sheet, as shown in Fig. 1.6. After emitted from bottom lightguide, light penetrates into the double-edged prism sheet and is reflected to the certain direction due to total internal reflection (TIR). By switching two light sources sequentially, pairs of parallax images are perceived by each eye and thus form the 3D vision. In 2004, another similar design for time-multiplexed 3D display was proposed by K. W. Chien [22], as shown in Fig. 1.7. In 2005, a novel idea is proposed by Y. M. Chu [23]. The parallax images are formed by the dual directional backlight system including two stacked lightguides with their own light sources respectively, as shown in Fig 1.8. Each lightguide can yield the incident light to one eye. By switching the light sources sequentially, the stereo pairs can be perceived by eyes respectively, then form the 3D image. More detailed discussion is in chapter 2.
Fig. 1.5 A 3D display using field-sequential LCD with light direction controlling backlight (2001) [20].
Lenticular Lens
LCD
Left eye Right eye
Stripe patterned back light
Lens f: Focal length Stripped pattern A ΨL ΨB
Fig. 1.6 Dual directional backlight for stereoscopic LCD (2003) [21].
Fig. 1.7 3D mobile display based on sequentially switching backlight with focusing foil (2004) [22].
Fig. 1.8 3D mobile display based on dual directional stacked lightguides (2005) [23].
Light source (for right eyes) Prsim sheet
Light guide plate Light source
The attractive feature of the time-multiplexed 3D display is resolution comparable with 2D display technology, yet is impracticable in spatial-multiplexed type display. In addition, spatial-multiplexed type display has the issues of complex design and critical alignment. For the previous work on the time-multiplexed type display, alignment is an issue for the lenticular screen and LC shutter in the first design and the patterns on the double-edged prism in the second design. Furthermore, the light efficiency was reduced by the blocking of the LC shutter in the first design. In the second and the third designs, inadequate light efficiency resulted from the grooves of the lightguide which were too flat to guide light effectively. In the last design, moiré pattern is formed by the periods of color filter and two stacked lightguides.
1.3.5 Summary
Various 3D display technologies have been discussed above. These 3D displays can yield acceptable 3D images, but most of them can not provide the solution completely, except stereo pair type. Compared with other 3D display technologies, the stereo pair type has many advantages including good image qualities, compact size, high feasibility, and compatibility with current 2D display technology.
Among several kinds of above-mentioned stereo pair type, the time-multiplexed method has an inherent advantage of no decreased image qualities and no alignment issue.
1.4 Motivation and Objective of this Thesis
3D display technology is expected to be the next crucial display technology and
and the comparable image qualities with 2D display.
In these years, several researches have been devoted to the time-multiplexed type display. A complete time-multiplexed 3D display consists of driving circuits, fast switching LC panel and directional backlight. The requirements and developments of the first two parts are similar to those of the flat panel display technology. Therefore, this thesis only considers the directional backlight system. In the above introduction, Y. M. Chu has proposed a novel dual directional backlight system including two stacked lightguides and their own light sources for the time-multiplexed type display. However, moiré pattern caused by the periods of color filter and grooves of lightguide decreases the viewer’s comfort. Besides, the image crosstalk is presented when the panel is scanning the parallax images.
As a result, the objective of this thesis is to mitigate the moiré pattern effect, to improve the optical performance, and to bring up the method to alleviate image crosstalk, based on dual directional backlight system designed by Y. M. Chu.
1.5 Organization of this thesis
The thesis is organized as following: The principle and design of the dual directional Backlight and the issues of this panel including moiré effect and the image crosstalk is presented in Chapter 2. In Chapter 3, the essential technologies including the fabrication process of the directional light-guide and driving system are introduced. The major instruments used to measure the performance of directional lightguide are also described. The simulated results are presented in Chapter 4. The experimental results, including the fabricated directional light-guide, dual directional backlight, and the evaluated results, will be in Chapter 5. Finally, the applications of the proposed dual directional backlight and the conclusions of this thesis will be presented in Chapter 6 and Chapter 7, respectively.
Chapter 2
Design of Moiré-Free Dual Directional B/L System
2.1 Introduction
The moiré effect and the ways to solve moiré effect will be presented in this chapter. In addition, the concept of dual directional backlight system proposed by Y. M. Chu in 2005 will be mentioned. The micro-groove structures are patterned on the bottom of the lightguide to redirect the incident side light into the desired direction due to total internal reflection (TIR). After stacking up two identical directional lightguides with the opposite alignment, a dual directional backlight system is formed and thus can be applied to time-multiplexed 3D display. Moreover, to add the concept of moiré effect solutions into the design of dual directional backlight system, the moiré-free dual directional backlight system can not only apply to the time-multiplexed display and also solve the moiré effect to decrease the viewers’ discomfort.
2.2 Moiré Effect
Moiré effect occurs when two or more images are nonlinearly combined to create a new superposition image, as shown in Fig. 2.1 [24]. Moiré patterns are patterns that do not exist in any of the original images but appear in the superposition image, for example as the result of a multiplicative superposition rule. Moiré phenomena are frequently encountered in daily life. For example, the moiré pattern is formed by two or more screens superimposition [25]. In this thesis, the moiré pattern is also observed
filter.
Fig. 2.1 An example of a moiré effect that occurs due to the superposition of two identical periodic layers with a small angle difference.
2.3 Moiré Pattern Analysis
Two models for moiré pattern analysis are reviewed. The geometric analysis method operates in the image plane, and the spectral analysis method [26-27] based on the Fourier transform operates in the frequency plane. Detailed descriptions of these models are listed in the following.
2.3.1 Geometric Analysis method
The geometric analysis method is usually applied to analyze the geometric characteristic of moiré pattern. This method which is regardless of the intensity distribution can merely obtain the pattern and locations.
The way to analyze is to write down two functions of the pattern and replace the zero into an ordinal number, such as, m1, m2 as shown in the following equation:
2 2
1
1(x,y,z) m , F (x,y,z) m
F = = (2-1)
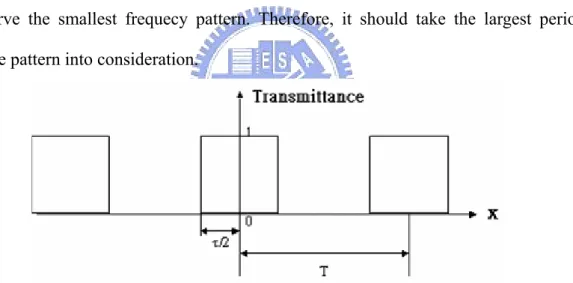
ordinal numbers: q m m z y x F z y x F z y x G p m m z y x F z y x F z y x G = − = − = = + = + = 2 1 2 1 2 2 1 2 1 1 ) , , ( ) , , ( ) , , ( ) , , ( ) , , ( ) , , ( (2-2) Here, it was assumed that the spectral spectrums of the grating transmittance are pseudo square waves, i.e. the distribution of transmittance and location as shown in Fig 2.2. The harmonic terms will be generated after Fourier series expansion of the transmittance function. It is needed to consider all the moiré pattern combinations of fundamental frequency term and harmonic terms while analyzing the moiré pattern. The general formula can be written as:
2 2 1 1 2 2 1 1 ,2( , , ) ( , , ) ( , , ) 1 x y z k F x y z k F x y z k m k m Gk k = − = − (2-3)
The periods are changeable while k1 and k2 are not fixed. However, we always
observe the smallest frequecy pattern. Therefore, it should take the largest period moire pattern into consideration.
Fig. 2.2 Transmittance distribution vs. location - the spectral spectrums of the grating transmittance are pseudo square waves.
2.3.2 Spectral Analysis Method
The spectral analysis method based on the Fourier transform is usually applied to analyze the frequency and intensity of moiré pattern. The way to analyze is described in the following.
image is given by the product of the reflectance functions of the individual images: ) , ( ) , ( ) , ( ) , ( ) , (x y r1 x y r2 x y r3 x y r x y r = L N (2-4)
Among the above equation, any rN can be rewritten to the Fourier series as the
following equation: ∫ ∫ = = = ∑ ∑ = + ∞ −∞ = + ∞ −∞ = y y x x y x T T ny T mx j T y x n m y v x u n T ny T mx j n m m dx e y x r T T a T f T f e a y x r 0 ) / / π( 2 0 , ) / / π( 2 , ) , ( 1 ) 1 , 1 ( ) , ( (2-5)
If the moiré pattern is formed by the symmetric one-dimension structure, the above equation can be simplified as:
∫ = ∑ + = ∞ = T n n n dx T nx x r T a T nx a a x r 0 1 0 ) / 2 cos( ) ( 1 ) / 2 cos( 2 ) ( π π (2-6)
If the moiré pattern is formed by the symmetric two-dimension structure, equation (2-5) can be simplified as:
∫ ∫ = = = ∑ ∑ = + ∞ −∞ = + ∞ −∞ = y y x x y x T T ny T mx j T y x n m y v x u n T ny T mx j n m m dx e y x r T T a T f T f e a y x r 0 ) / / π( 2 0 , ) / / π( 2 , ) , ( 1 ) 1 , 1 ( ) , ( (2-7)
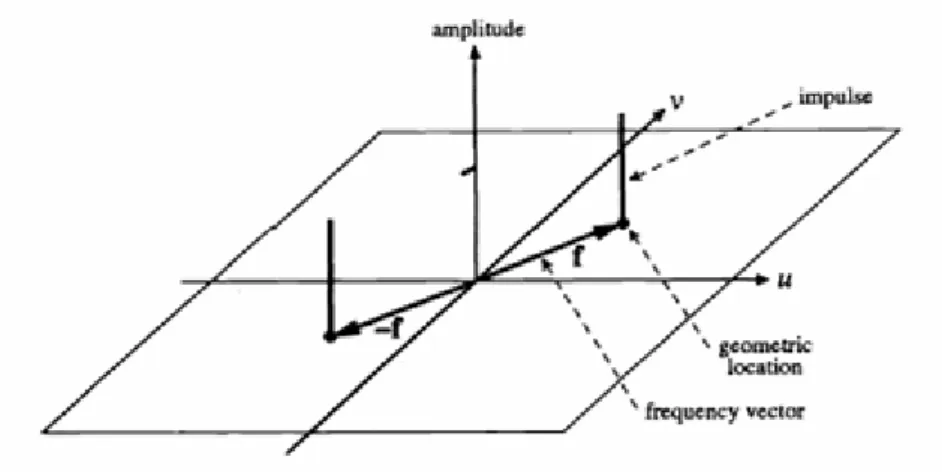
The advantage of Fourier series presentation is that frequency and intensity can be perceived respectively, as shown in the equations (2-6) and (2-7). The frequency can be observed by the coefficient of the function term. The intensity can be observed by the coefficient of am,n term. In addition, each function term can be presented by the
two vectors: frequency vector and intensity vector. By these two vectors superposition, the frequency and alignment of moiré pattern can be obtained, as shown in Fig 2.3.
Fig. 2.3 The expression of function in the Fourier domain diagram.
2.4 The Shape of Moiré Pattern
In the following, two cases related to this thesis work will be introduced. In this thesis, the periods of structures are all linear distribution. Therefore, we take two cases with the linear structures into consideration. The first case by geometric analysis is two periods of structures are identical or very close. The second case by spectral analysis is a general condition with the variables of periods’ difference and angle θ (The included angle θ between two structures is shown in Fig. 2.1)
2.4.1 Close Periods of Two Structures
While Identical Period, Included Angle vs. Period of Moiré Pattern
We assume the periods of two structures are equal to d. The direction of one structure is parallel to X axis, the other one has an angle θ with X axis, as shown in Fig. 2.1. Thus the ordinal function can be written as:
1 dm x= (2-8) 2 sin cos y dm x θ − θ = (2-9) dq m m d y x(1−cosθ)+ sinθ = ( 1− 2)= (2-10)
When θ →0 ⇒ θy =dq, ( )
θ
d q
y = (2-11)
From equation (2-20), when θ goes to zero, the period of moiré pattern (d/θ) is increased with decreasing θ.
Identical Alignment, Periods’ of Structures vs. Period of Moiré Pattern
We assume the periods of two structures are d and (d+△), the ordinal equation can rewritten as:
1 dm x= (2-12) 2 ) (d m x= +Δ (2-13) ) ( 2 1 +Δ Δ = = − = Δ + − d d x q m m d x d x (2-14) When Δ = ⇒ << Δ d x qd2 (2-15)
From equation (2-14), when the periods’ difference between two structures is very small, the period of moiré pattern is increased with decreasing the periods’ difference, as shown in Fig. 2-4.
Fig 2.4 Periods difference of two structures vs. moiré pattern periods. When the periods of two structures are very close but not the same and have the identical alignment.
2.4.2 General case
Since the small difference periods between two structures may amplify the period of moiré pattern. Therefore, the closed periods are not usually applied to design the structures of the lightguide. The general condition including relatively large difference and angle θ of two structures will be considered.
From the spectral analysis, we assume there are two periodic pseudo square waves of spectral spectrums. The fundamental frequency of one is f1 and the angle θ with X
axis is α; and the fundamental frequency of the other one is f2 and the angle θ with X
axis is zero. The ratio of two frequencies can be obtained as shown in equation (2-16). By the vector addition (as shown in equation (2-17)), the frequency of moiré pattern can be obtained as shown in equation (2-18). In addition, the period of moiré pattern can be derived as shown in equation (2-19).
1 2 1 f / f q = (2-16) 1 1 2 1 1 , sin cos 0 0 sin cos 2 1 f q k f k f f k k v u ⎟⎟ ⎠ ⎞ ⎜⎜ ⎝ ⎛ + ⎟⎟ ⎠ ⎞ ⎜⎜ ⎝ ⎛ ⎟⎟ ⎠ ⎞ ⎜⎜ ⎝ ⎛ − = ⎟⎟ ⎠ ⎞ ⎜⎜ ⎝ ⎛ α α α α (2-17) 2 2 2 , 1 2 , 1 2 , 1k k k k k k fu fv f = + (2-18) 1 2 , 1 2 , 1 k k k k f T = (2-19)
In the equation (2-17), fu is the projection of moiré pattern on X axis, fv is the
projection of moiré pattern on Y axis. Kn is the harmonic term of each frequency.
Only the lower order harmonic terms take into consideration because the intensity of higher order harmonic terms is much weaker than the lower terms. In the equation (2-18), f is the sum of fu and fv. In equation (2-19), T is the period corresponding to f.
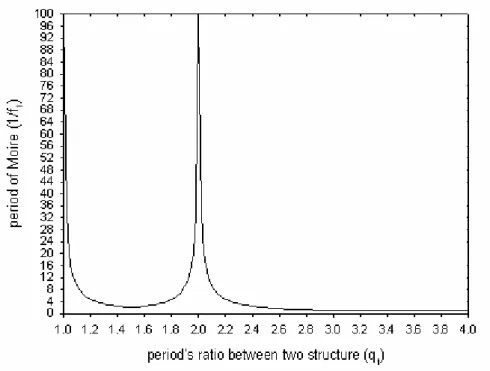
The angle θ is assumed as zero, i.e. α is equal to zero. By equation (2-18), the diagram of q1 vs. Tu can be obtained. Among the calculation, fu is merely available by
the minimum term. The relationship of moiré pattern period and period’s ratio of two structures is shown in Fig 2.5. The period of moiré pattern shows the relative maximum value when q1 is equal to 1 and 2, respectively. Besides, the minimum
period of moiré pattern is about double even triple to that of minimum periods of two original structures.
Fig 2.5 The relationship of moiré pattern periods and period’s ratio between two structures. (The ratio of moiré pattern is the multiples of the minimum period between two original structures)
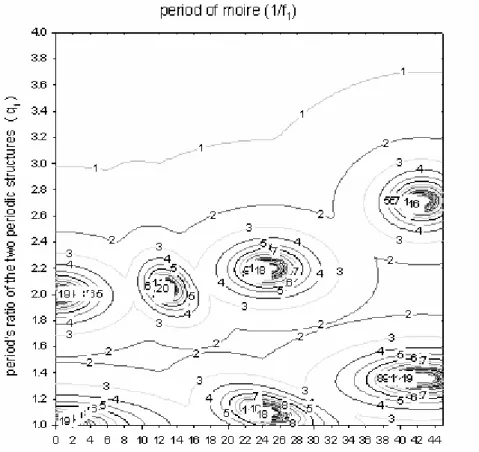
Ratio of Periods, Included Angle vs. Moiré Pattern Period
By equations (2-16), (2-17), (2-18) and (2-19), the angle θ is a non-zero value. The relationships among these parameters are shown in Fig 2.6 where the numbers beside contour lines means the multiple of moiré pattern period. (The lager period of two structures is set to one unit.) The moiré pattern period can be reduced by
adjusting the angle θ [28,29], if the ratio of structures can not fit the results of Fig 2.5.
Fig 2.6 The relationship of ratio of periods, angle θ, and moiré pattern period.
2.5 Design of Directional Lightguide
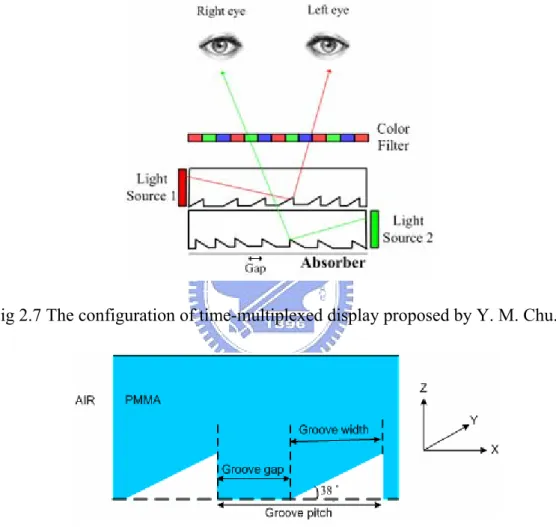
After the introduction in chapter 1, the time-multiplexed type display has been chosen as the objective of this thesis. The configuration of this time-multiplexed display is shown in Fig 2.7. The backlight system is composed of two lightguides and two light sources. There are numbers of micro-groove structures patterned on the bottom of each lightguide which can yield the incident light to individual eye due to TIR, so called dual directional backlight system. The light source is located on the side of lightguide which faces the inclined surface of the micro-groove structures. By the switching the light sources sequentially to match the images on the panel, the
the shape of micro-groove structures is shown in Fig 2.8. The lightguide is made of PMMA (n=1.49). Each micro-groove is a right-angled triangle, and the inclined angle was designed to be 38°. In addition, we defined some parameters here. Groove gap is the distance between two grooves. Groove width is the length of micro-groove in the X axis. Groove pitch is the sum of groove gap and groove width.
Fig 2.7 The configuration of time-multiplexed display proposed by Y. M. Chu.
Fig 2.8 The shape of micro-groove structures and the parameters related to groove.
In order to provide a uniform image, there are two general schemes to design the micro-groove structures distribution. One is to fix the groove width, then tuning the groove gap; the other one is to fix the groove gap (or groove pitch), then tuning the groove width. Of course, it is feasible to tune these two parameters simultaneously, but it increases the difficulty to design the uniform lightguide. The previous design by
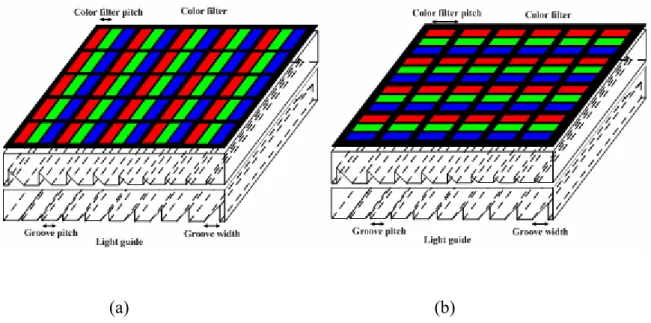
Y. M. Chu has chosen the first way to keep uniformity. However, there is an apparent moiré pattern issue. In this thesis, both of two ways will be discussed in detail in chapter 4. In addition, the discrete micro-groove structures may alleviate the moiré effect slightly by breaking the moiré pattern period. The concept of discrete micro-groove structure was mentioned as one solution for moiré pattern by Y. M. Chu [30], as shown in Fig 2.9. The simulation results will be revealed in the chapter 4. Besides, moiré pattern is changed while the different alignment of color filter, since the moiré pattern in this thesis is formed by two lightguides and color filter. Also, the two cases of color filter alignment including parallel alignment and vertical alignment between lightguide and color filter, as shown in Fig 2.10, will be discussed in chapter 4.
Fig 2.9 The method to suppress moiré pattern (a) continuous and (b) discrete distribution of micro-groove structures.
(a) (b)
Fig 2.10 Schematics of alignment with color filter and two lightguides. (a) parallel alignment and (b) vertical alignment
2.6 Summary
The principle of moiré effect has been introduced. Also, the design of micro-groove structures for time-multiplexed display by Y. M. Chu has been presented. The methods for suppressing moiré pattern, such as discrete micro-groove structures distribution, redesigning continuous micro-groove structures distribution and utilizing parallel and vertical alignment between two lightguides and color filter will be simulated and discussed in chapter 4.
Chapter 3
Essential technologies and Instruments
3.1 Introduction
The fabrication technology of the dual directional lightguides will be introduced in this chapter. In general, diamond turning and plastic injection molding [31] are applied to fabricate the lightguide. By considering cost and time efficiency, diamond turning was chosen as the fabrication technology in this thesis work.
The other crucial part of the time-multiplexed display, the driving circuit system, will be described in detail in the following. Then, the measurement instruments such as optical microscope (OM) and Conoscope will be illustrated.
3.2 Diamond Turning
Diamond turning [32], a kind of micro-mechanical machining, is based on the micromachining technology to fabricate the desired structure. The track and shape of the diamond knife are completely transferred to the machined surface, as shown in Fig 3.1. The profile accuracy and surface roughness which strongly depend on qualities of the machinery, diamond knife, workpiece material, and the environment may achieve 1 μm and 0.1 μm respectively in the best condition [33]. Besides, the suitable dimension of the structures by diamond turning is between a few to hundred micrometers.
Diamond turning has the advantages of low cost and high efficiency for small quantity. Therefore, it is appreciated to be applied on the prototype fabrication.
Fig 3.1 Fabrication process of diamond turning.
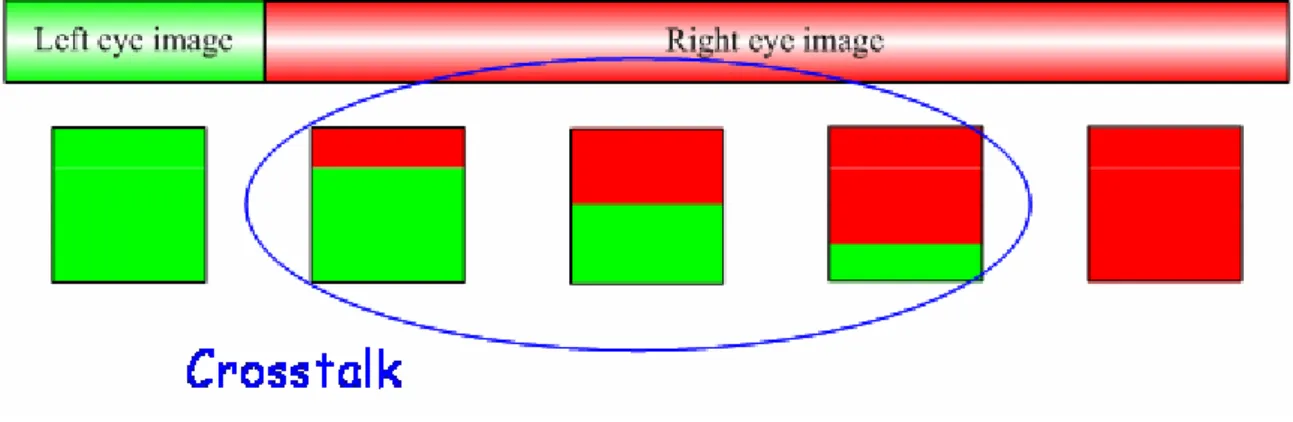
3.3 Driving System
Image crosstalk is a familiar issue for time-multiplexed display. In general, in order to form the 3D perception, the fast switching of two light sources and scanning images to match each other sequentially are needed. However, at the moment the light source switches, the panel retains the last image. As a result, the image crosstalk is formed as shown in Fig 3.2. The fast response LC panel can reduce the effect of crosstalk. In addition, the redesigned driving system is needed.
Fig 3.2 Driving scheme for time-multiplexed display. Image crosstalk is happened when the light source is switched.
A novel idea to design the driving system is adopted in this thesis. As it is mentioned before, each frame time is composed of a left-eye sub-frame and a right-eye sub-frame but causing the image crosstalk. Here, each frame is comprised of
two left-eye sub-frames and two right-eye sub-frames. Among each frame time, the light source is turned off in the first left-eye sub-frame and the first right-eye sub-frame. Therefore, the panel has the adequate time to scan the image but decreases the crosstalk because the backlight is turned off, as shown in Fig 3.3.
The frame time is used to be set as 60 Hz to make sure the image is not glimmer. Therefore, in this case, each sub-frame can be predicted as 240 Hz. However, the charging time of each row on the panel is 25 μm. By the resolution of 128×160, each sub-frame rate can be raised to 190 Hz. The charging time of each row on the panel is about 30 μs which is just a little larger than the minimum of charging time. Thus, each frame rate can be obtained as 47.5 Hz which is acceptable. In each frame time, the left-eye image is scanned twice by panel in sequence. The left-eye light source is turned on in the second sub-frame time to reveal the left-eye image. Then, the right-eye image is scanned twice by panel in sequence. In the third sub-frame time, the panel is scanning the right-eye image but causes no crosstalk because the light source is turned off. Finally, the right eye light source is turned on to reveal the right-eye image.
The concept of this driving scheme is alike to insert the black image. Therefore, the brightness which is lower than the general 2D panel will be discussed in chapter 4. The proposed driving system which can effectively solve image crosstalk integrated with fast response LC and the moiré-free dual directional backlight system proposed in this thesis can form a complete time-multiplexed display for mobile phone.
3.4 Measurement Instruments
After the fabrication of lightguides, its geometric characteristic and optical performances are very important to verify the simulation results. For the geometric analysis, optical microscope (OM) is utilized to observe the shape of micro-groove structures and to measure the size of lightguides.
The optical performances, such as angular distribution and uniformity of emitted light, are measured by Conoscope. Conoscope is a measurement system which utilizes optical lens based on Fourier transform to transfer the light beams transmitted (or reflected) from the platform of different angles to the CCD array, as shown in Fig. 3.4. Each light beam transmitted from the platform with a incident angle θ will be focused on the focal plane at the same azimuth and at a position x=F(θ). Therefore, the angular properties of the sample are measured in a simple procedure without any mechanical movement. Besides, there are collimated and diffuse light sources depending on users’ requirements. Furthermore, moiré pattern regardless of the intensity distribution can be observed by Conoscope with the geometric analysis.
By equipped with a fast photometer system and a high sensitivity spectrometer, the functions of Conoscope are extended to compose of not only the simultaneous measurement of luminance and chromaticity versus viewing direction, evaluation of the data yields, i.e. luminance contras ratio, grey-scale inversion and reduction, color shift and many more parameters, but also the spectra and temporal luminance
variances.
Fig 3.4 Schematics of Conoscope.
3.5 Summary
The diamond turning of fabrication technology for lightguides has been introduced. Also, the double scanning driving system for resolving image crosstalk was proposed. The measurement of optical performances for lightguide is utilized by Conoscope whose principle has been introduced.
Chapter 4
Simulation Results and Discussions
4.1 Introduction
Based on the principle described in chapter 2, the simulation models are established for evaluating the performance of the dual directional backlight system. In this chapter, some parameters are obtained by Y. M. Chu [30] and others will be discussed respectively before the simulation. Then, some simulation models for maintaining the optical performances such as uniformity, angular distribution and suppressing moiré pattern will be discussed respectively. Finally, the moiré-free dual directional backlight system for time-multiplexed mobile display can be derived.
4.2 Simulation Software
The optical simulator Advanced Systems Analysis Program (ASAPTM), developed
by Breault Research Organization (BRO) was used to optimize the dual directional backlight system and simulate its angular distribution and light distribution on top surface of the backlight.
4.3 Simulation Model of Moiré-Free Dual Directional Backlight System
In order to evaluate the whole effect of 3D optical performances, a complete simulation model is needed. There are two main simulation models in the following simulation. One is parallel alignment between color filter and two lightguides as shown in Fig 4.1, the other one is vertical alignment between color filter and two lightguides as shown in Fig 4.2. The common points of these two simulation models
have two dual lightguides which are composed of numbers of micro-groove structures and the light source located to face the inclined surfaces of micro-groove structures. Then, a detector which is to detect the optical performance including angular distribution and uniformity is set above two lightguides. Finally, a color filter which is to observe the moiré pattern with the lightguides by the geometric analysis positioned above the detector. The major different point of these two simulation models is the alignment between two lightguides and color filter. In the parallel alignment case, the panel is an portrait panel; in the vertical alignment case, the panel is a landscape panel.
Fig 4.1 Simulation model with parallel alignment between two lightguides and color filter.
Fig 4.2 Simulation model with parallel alignment between two lightguides and color filter.
4.3.1 Simulation Setting
Among the simulation settings, the light source is set as a lambersian distribution of a planar light source which is decayed as a factor of cos2θ from the normal direction [34]. The light source is to simulate the light bar composed of four LEDs and a lightguide. The refractive index of lightguides is set as 1.49 which is the same as that of PMMA. The lightguide and panel size is 36 × 32 × 1 mm3 and 35 × 28 × 1 mm3, respectively.
In chapter 2, the shape of each micro-groove structure which is a right triangle has been introduced, as shown in Fig 4.3. The inclined angle of each micro-groove is fixed as 38° by Y. M. Chu [30]. Other parameters including groove width, groove gap and groove pitch which are the variables will be discussed in the following simulation models.
Fig 4.3 The shape of micro-groove structures and the parameters related to groove. There two kinds color filter built in the following simulation models. One is for parallel alignment between color filter and two lightguides, the other one is for vertical alignment between color filter and two lightguides, as shown in Fig 4.4. The simulated color filter is a simplified design, since it can provide the period to observe the moiré pattern in geometric analysis by ASAP. The practical configuration and size of color filter which can be observed by optical microscope (OM) will be illustrated in chapter 5.
(a) (b)
Fig 4.4 Color filter in the simulation model (a) parallel and (b) vertical alignment.
distance, uniformity, light efficiency and moiré pattern are the most crucial issues for the simulation. These factors are discussed in detail below.
Angular Distribution
In order to display the parallax images correctly, the angular distribution of the dual directional backlight must be well controlled within each viewing direction, which depends on the viewer` s position. In the time-multiplexed 3D mobile display, the viewer` s position can be predicted roughly 10 to 40 cm normal from the display panel. The corresponding angular distribution of backlight is calculated as the range between ±4.7° to ±18° by assuming the distance between two eyes is 65 mm. Therefore, most of light must be guided to the two symmetric viewing cones respectively and sequentially when the light sources are fast switched sequentially.
Furthermore, the crosstalk which is defined as the ratio of undesired image to desired image should be reduced as possible. In this case, the crosstalk can be written as equation (4-1). The crosstalk of less than 10% is the general criterion to form the 3D perception. eye other by the measured luminance eye one by measured luminance Crosstalk≡ (4-1) In fact, the inclined angle of micro-groove is the main factor of the angular distribution. The variation of angular distribution by changing the micro-groove structures with groove width, groove gap and groove pitch is very small.
Viewing Angle and Viewing Distance
Viewing angle can be defined as the viewing region whose crosstalk is lower than
10%. By means of viewing angle, viewing distance can be calculated by the relationship of viewing angle and the distance of two eyes (65 mm).
Uniformity
Uniformity affects not only the image quality of single eye but also the whole 3D effect, defined as the ratio of the minimum to the maximum brightness by choosing the nine points of the panel. In general, the uniformity is considered as total hemisphere above the panel to be evaluated the general 2D wide viewing angle. However, the viewing angle of this display can be roughly predicted among 0° to 25°. The evaluation with total hemisphere above the panel may cause the inaccurate simulation. Therefore, uniformity here is set as the region between the angles 0° and 25° from the normal direction. Thus, the equation of uniformity can be written as:
cone in viewing brightness maximum cone in viewing brightness minimum Uniformity≡ (4-2) Light efficiency
Light efficiency is a critical issue in time-multiplexed display. In general, each frame is divided into left-eye sub-frame and right-eye sub-frame, respectively. The brightness accepted by eyes can be predicted as a half of the general 2D panel. Particularly, by the driving method mentioned in chapter 3, the light sources are in off state in half of each frame time. Therefore, the brightness is half than the original time-multiplexed display, i.e. the brightness in this case is only one-fourth than the general 2D panel. So the light efficiency can be defined as:
light incident of luminance the light emitted of luminance the efficiency Light ≡ (4-3) Moiré pattern
can be observed while the simulation model is built up by the geometric observation mode of ASAP. Compared with the practical situation, moiré pattern by geometric observation mode of ASAP is strongly improved than the practical one. But the trend of moiré pattern distribution can be predicted. By means of this mechanism, moiré pattern can be reduced in advance.
4.4 Simulation Results
Several simulation results which include micro-groove structures distribution, angular distribution, uniformity, moiré pattern observation will be illustrated in the following.
4.4.1 Fixed Groove Width Design
This model is designed for parallel alignment between color filter and two lightguides as shown in Fig 4.4 (a) by Y. M. Chu [30]. The concept of maintaining uniformity is fixed groove width which is 25 μm. The gradually changed function of groove gap and x coordinate is shown in Fig 4.5. The light source is put in the left side of lightfuide. The groove gap is distributed between 368 μm and 25 μm from the groove nearest to the light source to the farthest one.
Fig 4.5 Distribution function of groove gap and x coordinate by the fixed groove width design.
After simulation, the light efficiency is about 60%. Simulation results including angular distribution and uniformity are shown in Fig 4.6.
Fig 4.6 Simulation results designed with fixed groove width by Y. M. Chu. (a) angular distribution and (b) uniformity.
Moiré pattern by geometric analysis is shown in Fig 4.7. By the theory of moiré pattern mentioned in chapter 2, moiré pattern has the maximum period when structures have the identical or double periods. The period of color by a portrait panel is about 70 μm. Therefore, when the periods of lightguide are close to 70 μm and 140 μm, moiré pattern has the maximum period, i.e. the serious moiré pattern is shown in the panel. Furthermore, the groove gap is gradually changed in a small amount, and then it causes the magnification of moiré pattern in the middle of panel because the groove gaps are almost the same in the middle of panel for two lightgudes.
Fig 4.7 Moiré pattern simulated results with the fixed groove width by the parallel alignment between color filter and two lightguides.
4.4.2 Discrete Micro-groove Distribution
In order to solve moiré pattern, the discrete micro-groove structures should be take into consideration. Here, we adopt the above-mentioned model designed by Y. M. Chu, and then cut each continuous micro-groove structures into 20 discrete micro-groove structures for simulation. The design concept of discrete micro-groove structures is shown in Fig 4.8. The even parts of micro-groove structure are shifted to right hand side with a spacing of 0.7 mm. Particularly, the discrete parts in the region between 15 mm and 29 mm are also extended 1 mm along the top of each discrete micro-groove structure. The purpose of extending the discrete part is to break the period of the most serious moiré pattern which is happened in the middle of panel. Moiré pattern is shown in Fig 4.9. Compared with Fig 4.8, moiré pattern is reduced by the discrete micro-groove distribution, but the region and width of moiré pattern are not reduced. The solution is to design a randomly discrete micro-groove distribution. However, the discrete micro-groove distribution has the issue of fabrication process.
randomly discrete micro-groove structures are complex on both design and fabrication process. Therefore, a simple design of continuous micro-groove structures is needed.
Fig 4.8 Top view of the discrete micro-groove structures distribution design.
Fig 4.9 Moiré pattern simulated results with the discrete micro-groove distribution by the parallel alignment between color filter and two lightguides.
4.4.3 Fixed Groove Gap Design
The micro-groove distribution must be gradually changed for maintaining uniformity. There are three variables can be altered: groove width, groove gap, and groove pitch as mentioned before. In this model, groove gap is fixed and groove width is gradually changed by the distance between the micro-groove and light source. Here
we set the groove gap is 85 μm. The reason is to skip the regions of near 70 μm and 140 μm which are identical and double periods of color filter. The function of groove width and X coordinate is shown in Fig 4.10. The distribution function is divided into two parts to avoid the moiré pattern. The groove width is distributed between 5 μm and 40 μm from the groove nearest to the light source to the farthest one. Most of groove width is concentrated between 5 μm and 10 μm. Therefore, the light efficiency which is 54 % is slightly lower than the previous design with fixed groove width.
Fig 4.10 Distribution function of groove width and x coordinate by the fixed groove. gap design
Simulation results including angular distribution, uniformity are shown in Fig 4.11. Because the distribution function is discontinuous, the discontinuous place is expected to be very obvious while the viewer observes the lightguides. Moiré pattern is shown in Fig 4.12. Compared Fig 4.7 with Fig 4.9, moiré pattern by geometric observation is obviously narrowed. However, moiré pattern in the practical view is still not well enough (the practical view will be illustrated in chapter 5). There is a phenomenon of color separation because the colors on color filter are superimposed by moiré pattern.
lightguides as mentioned before. Also, the uniformity is needed to be improved.
Fig 4.11 Simulation results designed with fixed groove gap. (a) angular distribution and (b) uniformity.
Fig 4.12 Moiré pattern simulated results with the fixed groove gap by the parallel alignment between color filter and two lightguides.
4.4.4 Fixed Groove Pitch Design
The vertical alignment between color filter and two lightguides is adopted. Also, in order to keep uniformity, the design with fixed groove pitch is chosen. The distribution function of groove width and X coordinate is shown in Fig 4.13. The groove pitch is set as 150 μm and the groove width is distributed between 10 μm and 25 μm from the groove nearest to the light source to the farthest one. Simulation results of optical performances including angular distribution and uniformity are shown in Fig 4.14. The uniformity is obviously improved and has no discontinuous region. The angular distribution of light source 1 is not very ideal because the groove pitches of top and bottom lightguides are identical. Some emitted light of bottom lightguide is blocked or scattered by the micro-groove structure of top lightguide. Therefore, the angular distribution of light source 1 is broader than the one of light source 2, i.e. some light is emitted to undesired direction and then not only causes crosstalk but also decreases the light efficiency. The results of image crosstalk will be measured in chapter 5. Besides, the average groove width is smaller than the design
on the bottom of lightguides. Therefore, the light efficiency is about 59% nearly the previous design by Y. M. Chu. Moiré pattern by geometric observation which is shown in Fig 4.15 is not very close to the practical case. From the analyses of moiré pattern introduced in chapter 2, there is magnification of moiré pattern period while the periods’ difference between two structures is very small. Besides, the inclined angle is also very sensitive in the small periods’ difference. Therefore, the alignment of two lightguides is very important. The color separation is solved by the vertical alignment between color filter and two lightguides.
Fig 4.13 Distribution function of groove width and x coordinate by the fixed groove pitch design.
Fig 4.14 Simulation results designed with fixed groove pitch. (a) angular distribution and (b) uniformity.
Fig 4.15 Moiré pattern simulated results with the fixed groove pitch by the parallel alignment between color filter and two lightguides.
4.5 Summary
By evaluating several models of dual directional backlight system, the fixed groove pitch should be the best solution for moiré pattern and uniformity. Also, the vertical alignment between color filter and two lightguides can solve the color separation phenomenon. The practical results mentioned above will be illustrated in chapter 5.
Chapter 5
Experimental Results and Discussions
5.1 Introduction
The optical performances including viewing angle, viewing distance and uniformity are examined by Conoscope and discussed in this chapter. The optimized directional lightguides with continuous micro-groove structures distribution were fabricated by diamond turning, whose specifications are the same as demonstrated in chapter 4. Moreover, the images are demonstrated to observe the moiré pattern in this chapter.
5.2 Measured Results of Lightguides
The designs of fixed groove gap and fixed groove pitch whose angular distribution on each point of panel is very similar to those introduced in chapter 4. Therefore, the angular distribution is measured at the center of panel. Uniformity is measured at five points, which are randomly chosen from the five specified regions on backlight, as shown in Fig. 5.1. The definitions of viewing angle and viewing distance are identical with the ones in chapter 4. Additionally, the practical photos of lightguides and moiré pattern comparison will be discussed in the following.
Fig. 5.1 Measurement of uniformity.
5.2.1 Fixed Groove Gap Design
The angular distribution of fixed groove gap design is measured as shown in Fig. 5.2. The viewing angle can reach ±7° to ±80°. The viewing distance can be calculated within the range of 0.57 cm and 25.47 cm. However, the viewing distance lower than 7 cm is hard to distinguish the image on the panel. The viewing distance can be roughly defined as the range of 7 cm and 25.47cm. Furthermore, the viewing distance of 7cm corresponds to the viewing angle of 25°. Therefore, the effective viewing angle is between ±7° to ±25°. Uniformity is calculated as 70%. The photos of lightguides and lightguides with panel are shown in Fig. 5.3. The lightguide for right eye image is positioned below the one for left eye image. Therefore, moiré pattern can be observed in the right image, as shown in Fig. 5.3(a). The micro-groove structure distribution is discontinuous, thus there are the discontinuities in both two images. The panel includes color filter whose periodical structure causes the additional moiré pattern with two lightguides, as shown in Fig. 5.3(b). Furthermore, the color separation can be observed because colors on color filter superimpose the different colors by moiré pattern. Therefore, the rainbow-like color separation is occurred in the two sides of panel because the periods of moiré pattern are larger in these regions.
In order to improve the moiré pattern, color separation and uniformity, the 30% haze diffuser is added on the lightguides. The angular distribution of fixed groove gap
design with 30% haze diffuser is shown in Fig. 5.4. The viewing angle is within the range of ±9° and ±39°. The viewing distance is between 7 cm and 20.52 cm. Uniformity can reach 81%. The above-mentioned optical performances are acceptable for 3D display. The photos of lightguides with 30% diffuser and lighguides with panel and 30% diffuser are shown in Fig. 5.5. After adding 30% diffuser on lightguides, moiré pattern is nearly invisible. However, the discontinuity can still obviously be observed, as shown in Fig. 5.5(a). After that, the panel is added with the lightguides and 30% haze diffuser. The diffuser efficiently suppress moiré pattern and resolve the color separation, as shown in Fig 5.5(b). Similarly, the discontinuity can still be observed.
(a)
(b)
Fig. 5.3 The photos of (a)lightguides and (b) lightguides with panel by fixed groove gap design.
Fig. 5.4 The angular distribution of lightguides with 30% haze diffuser by fixed groove gap design.
![Fig. 1.5 A 3D display using field-sequential LCD with light direction controlling backlight (2001) [20]](https://thumb-ap.123doks.com/thumbv2/9libinfo/8734655.202518/23.892.188.735.854.1038/display-using-field-sequential-light-direction-controlling-backlight.webp)
![Fig. 1.7 3D mobile display based on sequentially switching backlight with focusing foil (2004) [22]](https://thumb-ap.123doks.com/thumbv2/9libinfo/8734655.202518/24.892.193.660.424.679/fig-mobile-display-based-sequentially-switching-backlight-focusing.webp)