CHAPTER 22
Population Genetics
台大農藝系 遺傳學 601 20000 Chapter 22 slide 2
Introduction
1. Population genetics is the field of genetics that studies heredity in groups of individuals for traits that are determined by one, or only
a few genes. (Polygenic traits, determined by combinations of many genes, are discussed in the next chapter, Quantitative Genetics.)
2. Both Population and Quantitative Genetics use Mendelian principles, and both are amenable to mathematical treatment.
3. These areas of genetics have been important in the fusion of Mendelian theory with Darwinian theory to create the neo-Darwinian synthesis that underlies much of current biological thinking (Figure 22.1).
4. Population geneticists study the genetic structure of populations, and how they change geographically and over time.
5. A Mendelian population is a group of interbreeding individuals who share a common set of genes. The total of all alleles in the population constitutes the gene pool.
6. Modern molecular biology techniques have allowed for rapid advancement in population genetics.
7. Mathematical models are often developed in population genetics. The Hardy-Weinberg law is a major example.
台大農藝系 遺傳學 601 20000 Chapter 22 slide 4
Genetic Structure of Populations
Genotypic Frequencies
1. Genotypic frequencies are a way to study the genes in a particular gene pool by quantifying the genotypes (pairs of alleles) at a given locus.
2. To calculate genotypic frequency, count individuals with one genotype, and divide by total individuals in the population. Repeat for each
genotype in the population.
3. A frequency is a proportion with a range of 0–1. If 43% of population has a trait, the frequency of that trait is 0.43. For any given trait, the sum of the genotypic frequencies in a population should be 1. Spot patterns on the moth Panaxia dominula are an example (Figure 22.2).
Allelic Frequencies
1.
Allelic frequencies give more information about the structure of
the population than genotypic frequencies.
2. May be calculated in two different ways:
a. From observed number of different genotypes at a particular locus.
b. From genotypic proportions.
3. Allelic frequencies at an X-linked locus are more complex because
one sex will have only one X-linked allele while the other has two.
Allelic Frequency= No. of copies of a given allele / Sum of counts of all alleles in the population
p=f(A)= ((2 x Count of AA) +(1 x count of Aa)+(0 x count of aa)) / (2 x total number of individuals)
p= f(A)=(Frequency of the AA homozygote) + (1/2)(frequency of the Aa heterozygote) p= f(a)=(Frequency of the aa homozygote) + (1/2)(frequency of the Aa heterozygote)
台大農藝系 遺傳學 601 20000 Chapter 22 slide 8
The Hardy-Weinberg Law
1. This is a simple explanation showing how Mendelian
segregation influences allelic and genotypic frequencies
in a population.
2. There are three parts to the law: one set of assumptions
and two major results.
Assumptions of the Hardy-Weinberg Law
1. This law is a simplification of complex events. There are
certain assumptions that must be present for the law to
apply:
a. The population is infinitely large, to avoid genetic drift. (Since
this is impossible, large populations are studied when possible
since they are mathematically similar to infinite ones.)
b. Mating is random with regard to the trait(s) under study.
c. There is no natural selection of the trait(s) under study.
d. No mutations occur.
台大農藝系 遺傳學 601 20000 Chapter 22 slide 10
Predictions of the Hardy-Weinberg Law
1. If the conditions are met, the population will be in genetic
equilibrium, with two expected results:
a. Allele frequencies do not change over generations, so the gene
pool is not evolving at the locus under study.
b. After one generation of random mating, genotypic frequencies
will be p
2, 2pq and q
2, and will stay constant in these proportions
as long as the conditions above are met. This is Hardy-Weinberg
equilibrium, which allows predictions to be made about
Derivation of the Hardy-Weinberg Law
1. Zygotes are formed by random combinations of alleles, in
proportion to the abundance of that allele in the population.
2. When a population is in equilibrium, genotypic frequencies will be
in the proportions p
2, 2pq and q
2. This results from the expansion of
the square of the allelic frequencies: (p + q)
2= p
2+ 2pq + q
2.
3. Mendelian principles acting on a population in equilibrium will
work to maintain that equilibrium (Table 22.2). Albinism is an
example.
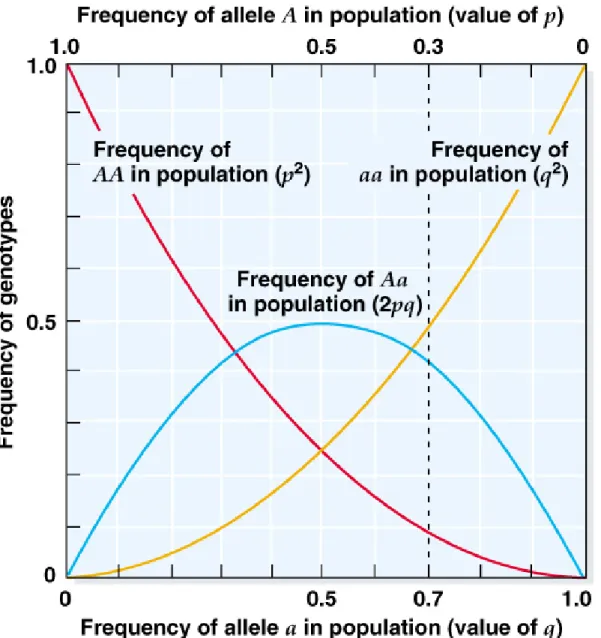
Fig. 22.3 Relationship of the frequencies of the genotypes AA, Aa, and aa to the
frequencies of alleles A and a in populations in Hardy-Weinberg equilibrium
台大農藝系 遺傳學 601 20000 Chapter 22 slide 14
Extensions of the Hardy-Weinberg Law
to Loci with More than Two Alleles
1.
Often more than two alleles are possible at a given locus, and the
frequencies of possible genotypes are still given by the square of
the allelic frequencies.
2.
If three alleles are present (e.g., alleles A, B and C) with
frequencies p, q, and r, the frequencies of the genotypes at
equilibrium will be:
(p + q + r)2 = p2(AA) + 2pq(AB) + q2(BB) + 2pr(AC) + 2qr(BC) + r2(CC)
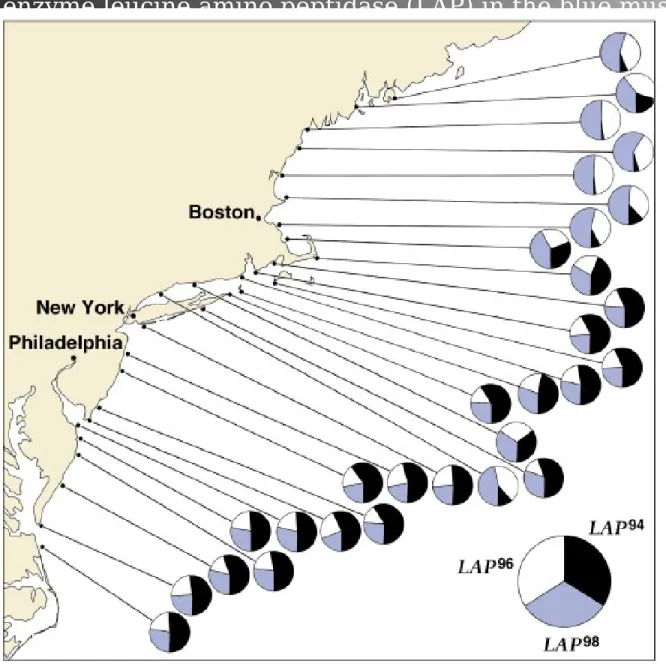
3. Blue mussel population of Long Island Sound (Figure 22.6) is an
example.
Extensions of the Hardy-Weinberg Law to
Sex-Linked Alleles
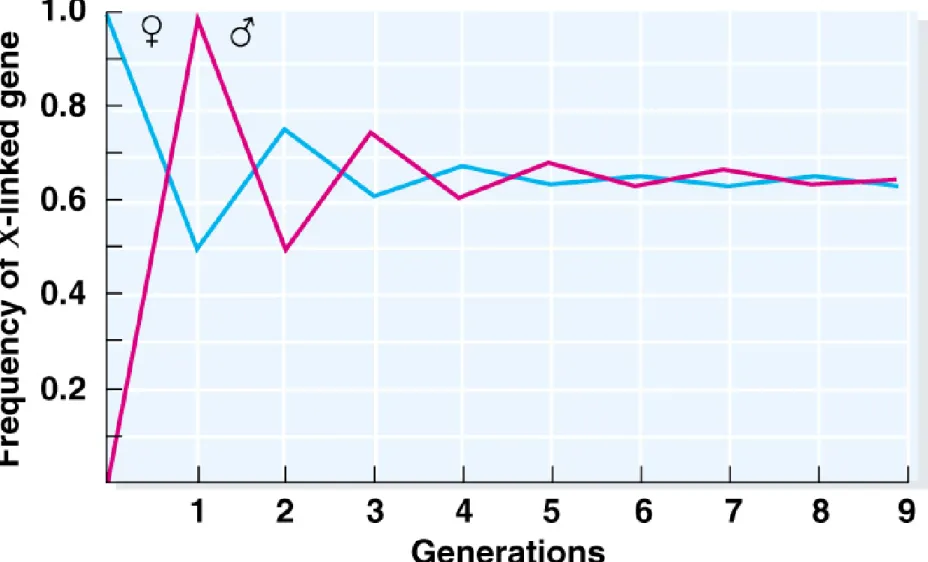
1. In species where sex is chromosomally determined, humans or Drosophila for example, females have two X chromosomes while
males have only one. In females, Hardy-Weinberg frequencies are the same as for any other locus. In males, frequencies of the genotypes are the same as frequencies of the alleles in the population.
2. Because males receive their X chromosome from their mothers, the frequency of an X-linked allele will be the same as the frequency of that allele in their mothers. For females the frequency will be the average of both parents.
3. With random mating, the difference in allelic frequency between the sexes will be reduced by half in each generation. One generation after allelic frequencies become equal in males and females, the genotypes will be in Hardy-Weinberg proportions.
台大農藝系 遺傳學 601 20000 Chapter 22 slide 16
Peter J. Russell, iGenetics: Copyright © Pearson Education, Inc., publishing as Benjamin Cummings.
Testing for Hardy-Weinberg Proportions
1. Data from real populations rarely match Hardy-Weinberg
proportions. Use a chi-square test to check whether
deviation is larger than expected by chance.
2. If the deviation is larger than expected, researchers begin
to study which of the Hardy-Weinberg assumptions is
being violated.
台大農藝系 遺傳學 601 20000 Chapter 22 slide 18
Using the Hardy-Weinberg Law to Estimate
Allelic Frequencies
1. If one or more of the alleles is recessive, one can’t distinguish
between heterozygous and homozygous dominant individuals. Can
use Hardy-Weinberg law to calculate the allele frequency based on
information about the number of homozygous recessive individuals.
26/6000=0.0043=q
2q=√0.0043=0.065
p=1-q=1-0.065=0.935
Heterozygote (Carrier)=2pq
=2(0.935)(0.065)
Genetic Variation in Space and Time
1. The genetic structure of populations can vary in space (Figure 22.6)
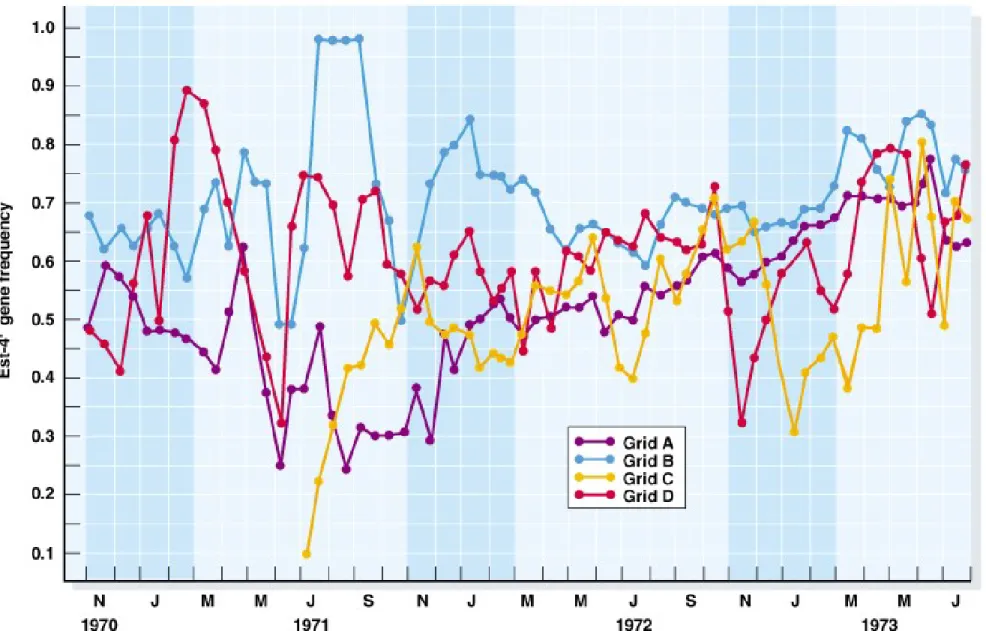
and time (Figure 22.7).
2. An allele frequency cline is a clear pattern of variation across a
geographic transect, usually correlated with a physical feature like
temperature or rainfall.
3. Statistical tools are used to quantify spatial patterns of genetic
variation. These are important in conservation biology.
台大農藝系 遺傳學 601 20000 Chapter 22 slide 20
Peter J. Russell, iGenetics: Copyright © Pearson Education, Inc., publishing as Benjamin Cummings.
Fig. 22.6 Geographic variation in frequencies of three alleles of the locus coding for
Fig. 22.7 Temporal variation in the locus coding for the enzyme esterase 4F in the
台大農藝系 遺傳學 601 20000 Chapter 22 slide 22
Genetic Variation in Natural Populations
1. Genetic variation is important in natural populations:
a. It determines the potential for evolutionary change and
adaptation.
b. It provides clues about roles of various evolutionary processes.
c. It allows predictions about a population’s chances for long-term
Measuring Genetic Variation at the Protein
Level
1. Understanding genetic variation in a population was difficult before molecular biology because most phenotypes are the result of multiple genes, and there was no technique available to determine allele frequencies.
2. Protein electrophoresis separates proteins on the basis of size, charge and conformation, and so often can separate the gene products of different alleles.
3. The amount of genetic variation within a population is usually measured by two parameters:
a. Proportion of polymorphic loci (those with more than one allele within a population).
Proportion is calculated by dividing total of loci with more than one allele by total number of loci examined.
b. Heterozygosity (the proportion of an individual’s loci that are heterozygous). Determine for individuals, and then average to obtain estimate of heterozygosity of the population.
4. Proteins with similar sizes and charges will conform in gel electrophoresis, and so allele differences are likely to be underestimated. Even so, much more variation (Table 22.3) is seen at most loci than would be predicted by the classical model.
5. Kimura proposed the neutral-mutation model, saying that the combination of random mutations and chance fixation of alleles is responsible for some variations that are not functionally different and so are not acted upon by natural selection. However, DNA
Measuring Genetic Variation at the DNA Level
1. PCR (polymerase chain reaction) allows amplification of DNA regions from many individuals. Fragments may be analyzed for size, restriction sites and DNA sequence.
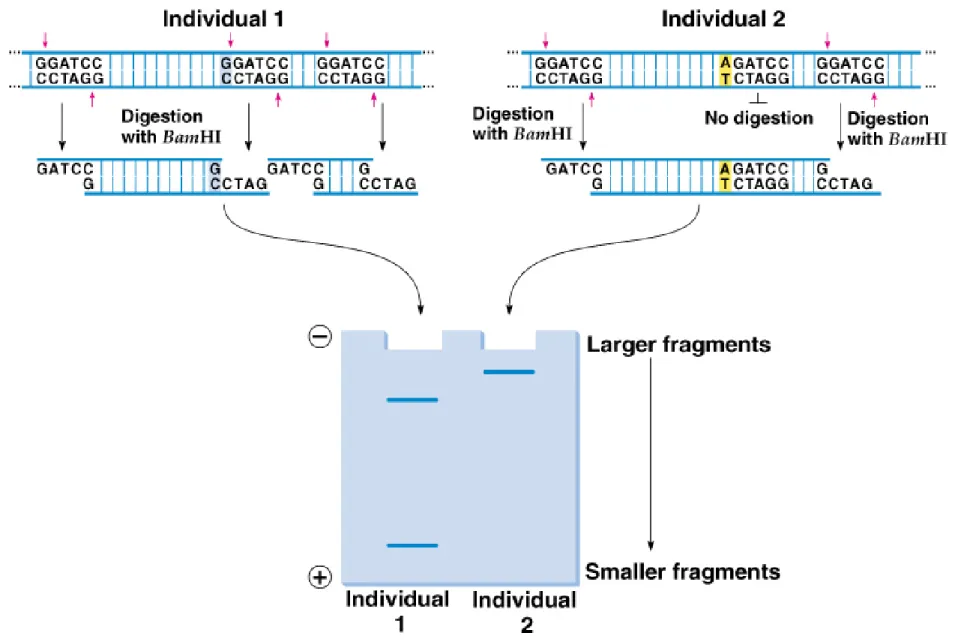
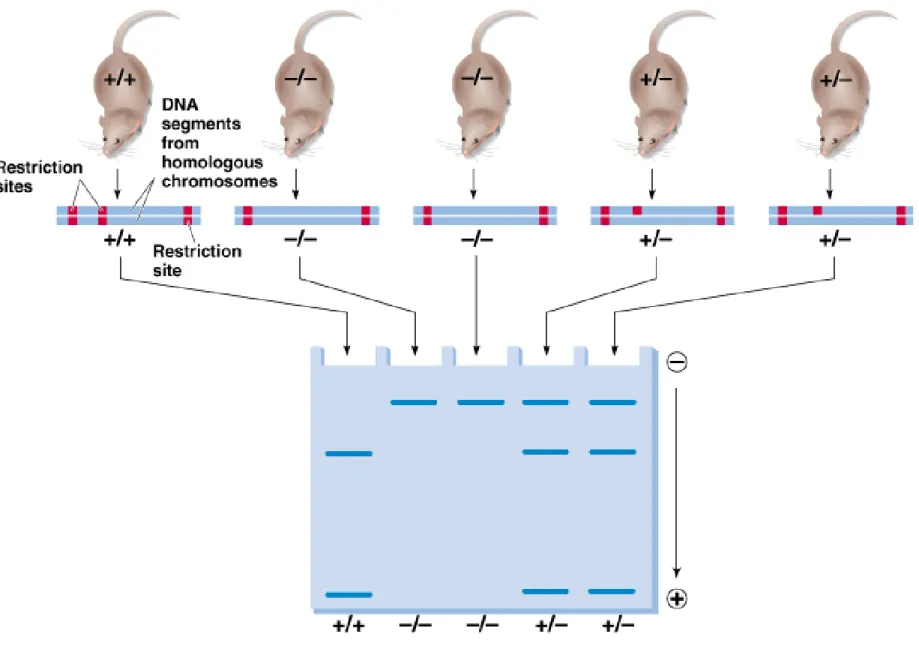
2. Restriction fragment length polymorphisms (RFLPs) are a quick way to map genes and gain an idea of how many DNA differences occur within a
population (Figure 22.10). Limitation of RFLP analysis is that it only assesses variation in sites for particular restriction enzymes.
3. DNA sequence analysis shows that there is more variation and therefore many more alleles of most genes than previously believed. Different regions will have different levels of variation. Exons are less likely to vary than introns and flanking sequences, and changes within exons are often synonymous.
4. DNA length polymorphisms result from deletions and insertions of short stretches of nucleotides, especially in noncoding regions. Microsatellites or STRPs (short tandem repeat polymorphisms) are very simple repetitive
sequences that occur different numbers of times in different individuals. Both are useful in determining genetic variability within a population.
台大農藝系 遺傳學 601 20000 Chapter 22 slide 26
Peter J. Russell, iGenetics: Copyright © Pearson Education, Inc., publishing as Benjamin Cummings.
Fig. 22.9 DNA from individual 1 and individual 2 differ in one nucleotide, found
台大農藝系 遺傳學 601 20000 Chapter 22 slide 28
Forces that Change Gene Frequencies in
Populations
1. Few populations are actually in Hardy-Weinberg
equilibrium, and so their allele frequencies do change,
and evolution occurs.
Mutation
1. Usually a mutation converts one allelic form of a gene to another.
2. Mutations may be neutral, detrimental or advantageous, depending on the environment. Environmental changes may favor different alleles than those previously favored.
3. The frequency of alleles in a population is determined by interaction of mutation rates and natural selection.
台大農藝系 遺傳學 601 20000 Chapter 22 slide 30
Random Genetic Drift
1. Called “drift” for short. Results from random events in small populations (sampling error).
2. Effective population size is the number of adults
contributing gametes to the next generation. Includes the number of breeding females plus the number of breeding males. (Remember that if, for example, one
male contributes most of the gametes, his alleles will be present at a higher frequency in the next generation.) 3. The standard error of allelic frequency is a useful
mathematical analysis for understanding the limits of allelic frequency.
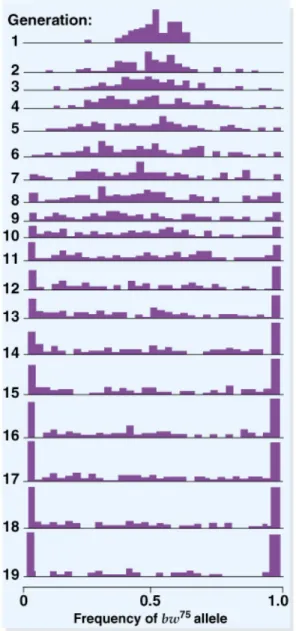
Fig. 22.11 Results of Buri’s study of genetic drift in 107 populations of
Drosophila
台大農藝系 遺傳學 601 20000 Chapter 22 slide 32
4. Genetic bottlenecks and founder effects arise when
populations expand from a small number of ancestors. Even though the population may become large, only the alleles that were present in the ancestors (and those that have arisen by mutation in the meantime) will be present in the population. Examples include:
a. the islanders of Tristan da Cunha.
5. Effects of genetic drift:
a. Allelic frequencies will change over time, and may reach values of 0.0 or 1.0. When this occurs, the remaining allele is “fixed” in the
population, and only mutation can change its frequency. This reduces the heterozygosity of the population, resulting in reduced genetic
variation.
b. Individual populations will not necessarily drift in the same direction, and so genetic divergence can result. This may eventually result in speciation. Experimental evidence (Table 22.8) confirms that there is more variance in allelic frequency among small populations than
among large ones.
c. Neutral mutations are not subject to natural selection, and may be used to estimate the time elapsed since two species shared a common
台大農藝系 遺傳學 601 20000 Chapter 22 slide 34
Peter J. Russell, iGenetics: Copyright © Pearson Education, Inc., publishing as Benjamin Cummings.
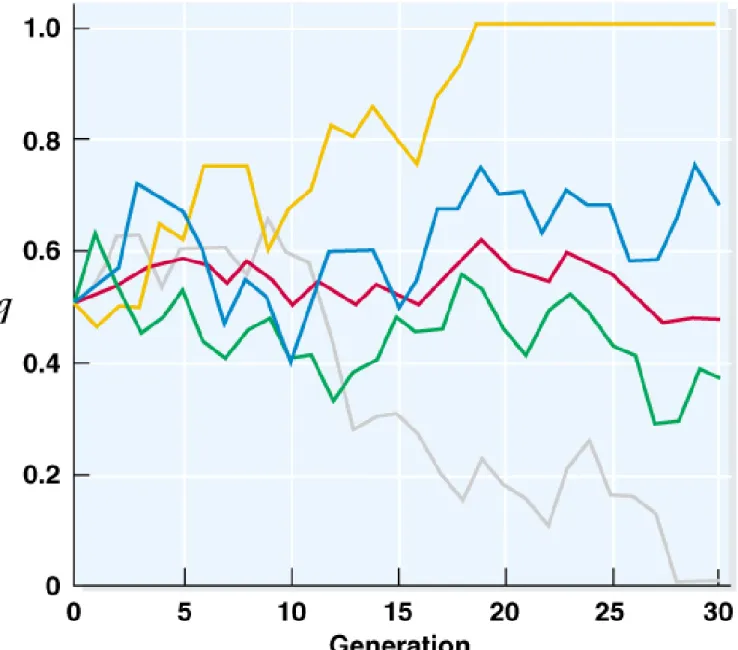
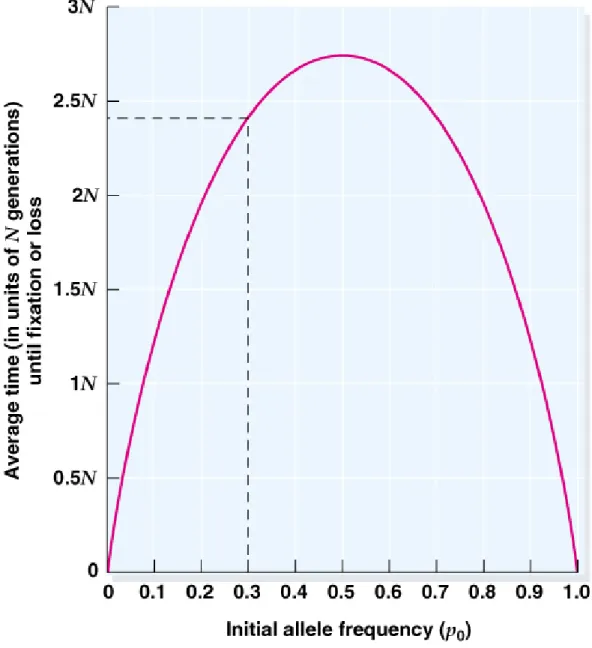
Fig. 22.12 The effect of genetic drift in the frequency (q) of allele A2 in four
Fig. 22.13 The average time to fixation or loss of an allele from population as a function
of population size and initial allele frequency as predicted by Kimura
台大農藝系 遺傳學 601 20000 Chapter 22 slide 36
Balance between Mutation and Random Genetic
Drift
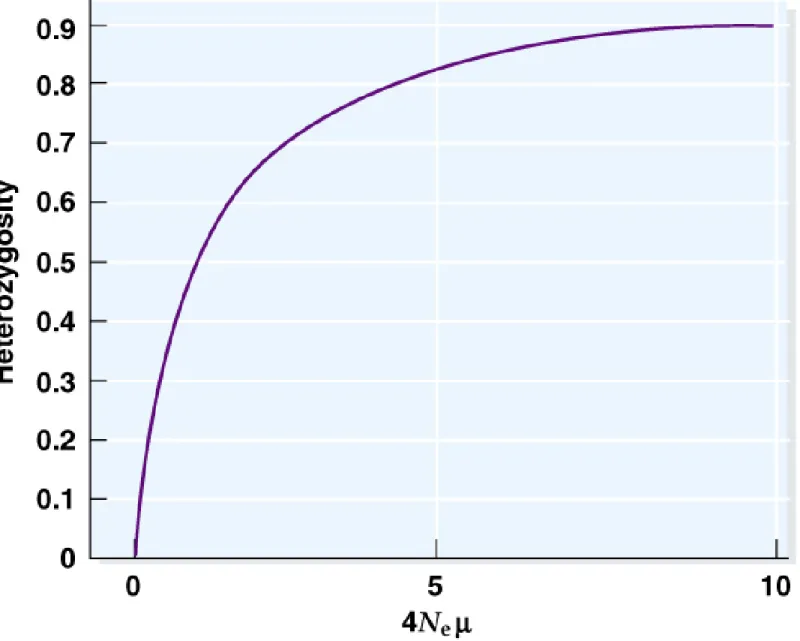
1. In a population, mutation adds variation, and random
genetic drift removes variation. When these forces are
combined, the infinite alleles model predicts that they will
balance with each other and a steady state of
Fig. 22.14 Relationship between the neutral parameter = 4Ne and the expected
台大農藝系 遺傳學 601 20000 Chapter 22 slide 38
Migration
1. While Hardy-Weinberg assumes no migration, many populations are not isolated and will exchange genes with other populations. Genetic migration is about gene movement, rather than actual movement of organisms, and is referred to as gene flow.
2. Gene flow has two major effects on a population:
a. May introduce new alleles to a population.
b. When migrants have different allelic frequency than recipient population, allelic frequencies will be altered in the recipient population.
3. Gene flow is diagrammed in Figure 22.15. Note that if gene flow continues, the differences in allelic frequencies between the
populations will decrease.
4. Migration increases the effective size of populations, and may prevent allelic fixation. This is important in conservation biology, where
Fig. 22.15 Theoretical model illustrating the effect of migration on the gene pool of a
Natural Selection
Animation: Hardy-Weinberg and Natural Selection
1. Adaptation is the process by which traits evolve that increase the
organism’s chances of surviving to reproduce. Adaptation is mainly the result of natural selection.
台大農藝系 遺傳學 601 20000 Chapter 22 slide 42
2. Natural selection is the differential survival of genotypes, and the alleles that survive are more likely to be represented in the next generation. Over time, this increases the adaptation of organisms to their environment.
3. Darwinian fitness is the relative reproductive ability of a particular genotype. It involves both the number of offspring, and their relative fitness.
4. Natural selection may result in increasing or decreasing
genetic variation, depending on environmental
conditions. It can be calculated using the “table method”
(Table 22.9). The premise is that the contribution of each
genotype to the next generation will be equal to the initial
frequency of the genotype multiplied by its fitness.
台大農藝系 遺傳學 601 20000 Chapter 22 slide 44
5. Recessive traits often result in reduced fitness, and so there will be selection against homozygous recessives, decreasing the frequency of the recessive allele, but not eliminating it from the population, because as the allele becomes less frequent it is more likely to be found in a heterozygote, creating a protected polymorphism.
6. Some forms of selection result in maintaining genetic variation. If a heterozygote has higher fitness than either of the homozygotes, allelic frequencies will reach equilibrium and become stable. The relationship between sickle-cell anemia and resistance to malaria is a famous
Fig. 22.20 Effectiveness of selection against a recessive lethal genotype at different initial
台大農藝系 遺傳學 601 20000 Chapter 22 slide 46
Peter J. Russell, iGenetics: Copyright © Pearson Education, Inc., publishing as Benjamin Cummings.
Fig. 22.21 Fitnesses of the genotypes AA, Aa, and aa are 1, 0.5, and 0.5, for the dominant
case; 1, 0.75, and 0.5 for the additive case; and 1, 1, and 0.5 for the recessive case
Fig. 22.22 The distribution of malaria caused by the parasite Plasmodium
falciparum
台大農藝系 遺傳學 601 20000 Chapter 22 slide 48
Balance Between Mutation and Selection
1. The balance between mutations and natural selection results in evolution.
2. When an allele becomes rare, its change in frequency with each generation becomes very small. At the same time, mutations occur which produce new alleles and increase the frequency. Eventually equilibrium will be obtained.
3. Selection is continually acting on dominant alleles, but can only act on a recessive ones in homozygotes. Therefore detrimental dominant
Assortative Mating
1. Individuals do not always mate randomly. When a
particular phenotype is preferred in mates, allele
frequencies will be affected.
2. Positive assortative mating occurs when individuals with
similar phenotypes mate preferentially.
3. Negative assortative mating occurs when phenotypically
dissimilar individuals mate preferentially.
台大農藝系 遺傳學 601 20000 Chapter 22 slide 50
Inbreeding
1. Inbreeding is the preferential mating between close relatives.
2. Small populations will show this effect even if there is no tendency to select relatives, because even-chance matings are likely to involve relatives.
3. Self-fertilization is an extreme case of inbreeding seen in many plants and a few animals. Table 22.13 illustrates the effects.
4. Inbreeding has results similar to genetic drift in a small population. Heterozygosity decreases and homozygosity increases. In large
populations, inbreeding will result in constant allele frequencies even though homozygosity increases.
台大農藝系 遺傳學 601 20000 Chapter 22 slide 52
Effects of Evolutionary Forces on the Genetic
Structure of a Population
Changes in Allelic Frequency Within a Population
1. Factors with potential to change allelic frequencies are:
a. Mutation, although it occurs at a slow rate and creates a relatively small change in allelic frequencies.
b. Migration, which may create major changes in allelic frequencies. c. Genetic drift, which produces substantial changes in small
populations.
d. Selection, which alters frequencies and continues to act even when equilibrium has been reached.
2. Non-random mating affects genotypic frequencies in a population.
Inbreeding increases homozygosity, and decreases fitness if deleterious recessive alleles are present.
Genetic Divergence Among Populations
1. Genetic drift can produce divergence among populations.
2. Migration will decrease divergence by encouraging gene flow between populations.
3. Natural selection can either increase divergence by favoring different alleles in different populations, or decrease divergence by selecting against certain alleles.
4. Non-random mating may contribute to the effects of other processes by altering the effective population size.
台大農藝系 遺傳學 601 20000 Chapter 22 slide 54
Increases and Decreases in Genetic Variation Within
Populations
1. Effects are similar to those among populations (above):
a. Migration increases genetic variation. b. Mutation also increases variation.
c. Genetic drift decreases variation due to loss of alleles. d. Inbreeding decreases variation.
e. Natural selection may either increase or decrease genetic variation, depending on the environment and other circumstances.
f. All of these effects combine within a population in complex ways to determine an overall pattern of genetic variation.
The Role of Genetics in Conservation Biology
1. Human activities are reducing the available habitat and altering the environment for many species, resulting in declining numbers and escalating rates of extinction. Intelligent conservation efforts must consider survival of gene pools, as well as survival of individuals. 2. Population viability analysis is used to determine how large a
population needs to be to prevent extinction within a set period of time. An adequate gene pool is needed to ensure the potential for the
population to evolve over time.
3. Inbreeding has occurred in zoos and game management programs, and is now a recognized concern in developing conservation strategies.
4. Until habitat destruction is addressed, genetic conservation efforts can only slow the depletion of gene pools and the loss of species that will inevitably result.
台大農藝系 遺傳學 601 20000 Chapter 22 slide 56
Speciation
1. When populations are subdivided to the point that they never
interbreed, different alleles will become fixed in the subpopulations over time.
2. If the subpopulations are then reunited, they may fail to mate or may produce hybrids of low fitness.
3. Understanding which genes are involved in reproductive isolation requires an understanding of basic principles of speciation.
Barriers to Gene Flow
1. Barriers to gene flow eventually arise between isolated populations, preventing interbreeding. There are two major categories of barriers:
a. Post-zygotic barriers usually arise first, resulting in poor fitness of offspring (often including infertility).
b. Pre-zygotic barriers that prevent mating result when alleles of individuals that discriminate in mating become increasingly frequent in the population.
2. In this reinforcement model, post-zygotic isolation leads to pre-zygotic isolation. The genes potentially involved include those for:
a. Temporal isolation, with different mating or activity periods preventing mating between the populations.
b. Ecological isolation, with each population in a distinct niche and therefore spatially isolated.
c. Behavioral incompatibility, allowing the two species to recognize and avoid each other as mates.
d. Mechanical isolation, in which the genitalia of the two populations do not fit together. e. Gametic isolation, in which gametes from different populations do not fuse correctly.
台大農藝系 遺傳學 601 20000 Chapter 22 slide 58
Genetic Basis for Speciation
1. In species that display post-zygotic isolation:
a. Hybrid males (the heterogametic sex) are usually sterile. b. Hybrid females (the homogametic sex) are often fertile. c. This is Haldane’s Rule (after J. B. S. Haldane).
2. Crosses between species of Drosophila are an example:
a. The F1 of a cross between D. simulans and D. mauritiana will include:
i. Females that are viable and fertile. ii. Males that are sterile.
b. Backcrossing the F1 females to D. simulans males will produce some fertile
male offspring.
c. These types of experiments show that many genes are involved in the fertility of male hybrids.
3. Abalone provide another example of prezygotic isolation.
a. Sperm and eggs of more than one species may co-occur.
b. Eggs allow penetration only by conspecific sperm due to specific molecular interactions between the sperm protein lysin and the egg glycoprotein VERL.