國 立 交 通 大 學
環境工程研究所
博 士 論 文
單一電極線電暈單極充電器
的奈米微粒充電效率改善研究
Improvement of the Nanoparticle Charging Efficiency
of a Single-wire Corona Unipolar Charger
研 究 生: 簡 誌 良
指導教授: 蔡 春 進 博士
吳 宗 信 博士
單一電極線電暈單極充電器
的奈米微粒充電效率改善研究
Improvement of the Nanoparticle Charging Efficiency of a
Single-wire Corona Unipolar Charger
研
究
生:簡誌良 Student: Chih-Liang Chien
指導教授:蔡春進 博士 Advisor: Dr. Chuen-Jinn Tsai
吳宗信 博士
Dr. Jong-Shinn Wu
國 立 交 通 大 學
環 境 工 程 研 究 所
博 士 論 文
A ThesisSubmitted to Institute of Environmental Engineering College of Engineering
National Chiao Tung University in Partial Fulfillment of the Requirements
for the Degree of Doctor of Philosophy
in
Environmental Engineering June 2012
Hsinchu, Taiwan, Republic of China
單一電極線電暈單極充電器的奈米微粒充電效率改善研究
研究生:簡誌良 指導教授:蔡春進 博士
吳宗信 博士
國立交通大學環境工程研究所
摘 要
本研究的目的在於利用包覆空氣減少微粒損失進而提升電暈單極充電器的奈 米微粒充電效率。首先設計一個具有軸向包覆空氣的充電器,其構造包含一個內 徑30 mm 的圓柱外殼,及使用一直徑為 50 μm、長度為 2 mm 的黃金電極線作為放 電電極,並在固定氣膠流量1 L/min 的條件下測試充電器對單徑 2.5 ~ 20 nm 銀微 粒之充電效率。本研究並建立了一個二維數值模式來推估單極微粒充電器的奈米 微粒充電效率,充電器內部的流場利用SIMPLER 方法而得,電位場及離子濃度場 則利用Poisson 方程式及對流擴散方程式來求解;之後再利用對流擴散方程式配合 Fuchs 擴散充電理論求取帶電微粒的濃度場及充電效率。研究結果顯示,模擬的外 在充電效率與實驗值相符。模擬結果說明了使用軸向包覆空氣減少帶電微粒損失 的優點,並指出主要帶電微粒損失的發生位置。但由於較小的微粒較難被充電, 使得具有軸向包覆空氣的充電器對粒徑小於 10 nm 的微粒之充電效率不佳,仍有 改進的空間。 為進一步有效地提升奈米微粒的充電效率,本研究另設計一個具有徑向包覆 空氣以減少帶電微粒損失的單一電極線單極氣膠充電器。此充電器之構造包含一 個用來引入徑向包覆空氣的6 mm 長接地多孔金屬套管,嵌入於內徑 6.35 mm 的絕 緣鐵氟龍管正中央,及一直徑為50 μm、有效長度為 6 mm 的放電黃金電極線。本研究利用已建立的數值模式評估及最佳化此充電器的充電效能。研究過程中發現 徑向包覆空氣的開口位置對減少帶電微粒損失的影響是重要的,故本研究針對兩 種不同的充電器設計進行探討,在設計1 中,徑向包覆空氣 6 mm 寬的開口兩端對 準6 mm 長的放電電極兩端,然而在設計 2 中,徑向包覆空氣的開口往電極線前端 的左方偏移2 mm。 與具有軸向包覆空氣的充電器比較,模擬結果顯示具有徑向包覆空氣的充電 器之充電區並未觀察到迴流場的存在,在相同的操作條件下,因為帶電微粒沉降 區的減少,使得設計2 的靜電損失小於設計 1,模擬結果說明了使用徑向包覆空氣 並配合適當包覆空氣的開口位置具有減少帶電微粒損失的優點。與目前文獻上具 有最高外在充電效率的兩組單極氣膠充電器相較 (Chen and Pui 1999; Kimoto et al. 2010),模擬結果顯示,針對 10 nm 以下微粒,在施加電壓為+3.5 kV、氣膠流量為 0.5 L/min 及包覆空氣流量為 0.7 L/min 時,具有徑向包覆空氣的充電器之設計 2 有
相似的充電效能,對2.5–10 nm 微粒的外在充電效率達到 15.2%–65.8%,而 Chen and
Pui (1999)的充電器對 3–10 nm 微粒的外在充電效率為 22%–65%,Kimoto et al. (2010) 的充電器對 5–10 nm 微粒的外在充電效率為 59%–64%。
預期本研究設計的具有徑向包覆空氣的充電器可作為高效率的奈米微粒充電 器,可改善監測儀器對奈米微粒的偵測靈敏度,未來可進行實驗驗證理論值以加 強實用性。
Improvement of the Nanoparticle Charging Efficiency of a Single-wire
Corona Unipolar Charger
Student: Chih-Liang Chien Advisor: Dr. Chuen-Jinn Tsai
Dr. Jong-Shinn Wu
Institute of Environmental Engineering
National Chiao Tung University
ABSTRACT
The objective of this study is to develop a corona unipolar charger with sheath air to minimize particle loss and enhance the nanoparticle charging efficiency. At first, a unipolar charger with axial sheath air was designed which consists of a cylindrical casing of 30 mm in inner diameter in which a gold wire of 50 μm in diameter and 2 mm in length is used as the discharge electrode. The experimental charging efficiency was obtained at a fixed aerosol flow rate of 1 L/min using monodisperse silver nanoparticles of 2.5 to 20 nm in diameter. A 2-D numerical model was also developed to predict nanoparticle charging efficiency in the unipolar charger. Laminar flow field was solved by using the Semi-Implicit Method for Pressure Linked Equations (SIMPLER Method), while electric potential and ion concentration fields were solved based on Poisson and convection-diffusion equations, respectively. The charged particle concentration fields and charging efficiency were then calculated based on the convection-diffusion equation incorporating the Fuchs diffusion charging theory (Fuchs 1963). Good agreement between simulated and experimental extrinsic charging efficiency was obtained. Numerical results show the advantage of using axial sheath air to minimize charged particle loss and indicate the location where major charged particle loss occurs. However, the extrinsic charging efficiency of the charger with axial sheath air is still
low for particles smaller than 10 nm in diameter due to low intrinsic charging efficiency. In order to improve the design of the charger, a single-wire corona unipolar charger with radial sheath air to minimize charged particle loss was proposed to enhance the charging efficiency of nanoparticles. The charger consists of an insulated Teflon tube (inner diameter ID = 6.35 mm) with a 6 mm long grounded porous metal tube inserted at the center from which radial sheath air is introduced, and a discharge gold wire of 50 μm in ID and 6 mm in effective length. The performance of the charger was evaluated and optimized by the present numerical model. The effect of the position of the sheath air opening on reducing the loss of charged particles was found to be important and two different designs were studied. In design 1, both ends of 6 mm wide sheath air opening are aligned with the ends of 6 mm long discharge wire, while in design 2 the sheath air opening is shifted 2 mm toward the left of the leading edge of the wire.
Compared to the charger with axial sheath air, numerical results show that no flow recirculation region is observed in the charging zone of the charger with radial sheath air. At the same operating condition, design 2 was found to have less electrostatic loss than design 1 because of its smaller deposition region of charged particles. Numerical results show the advantage of using radial sheath air with an appropriate position of the sheath air opening to minimize charged particle loss. Compared with two existing unipolar chargers with the highest extrinsic charging efficiency for particles smaller than 10 nm in diameter (Chen and Pui 1999; Kimoto et al. 2010), results show that design 2 operated at the applied voltage of +3.5 kV, aerosol flow rate of 0.5 L/min, and sheath air flow rate of 0.7 L/min was found to have extrinsic charging efficiency of 15.2%–65.8% for particles ranging from 2.5 to 10 nm in diameter, which is comparable to that of the charger of Chen and Pui (1999), 22%–65% for particles ranging from 3 to 10 nm in diameter, and that of the charger of Kimoto et al. (2010), 59%–64% for particles
ranging from 5 to 10 nm in diameter.
It is expected that the charger with radial sheath air designed in this study could be used as an efficient nanoparticle charger to improve the sensitivity of monitoring instruments for nanoparticles. In the future, the experiments will be conducted to validate the simulated results and to further enhance the feasibility of the charger.
ACKNOWLEDGMENTS
I would like to acknowledge the financial support of the Summer Institute Program of the Taiwan National Science Council and the German Academic Exchange Service (Deutscher Akademischer Austausch Dienst), and the Ph.D. student scholarship program of the Sinotech Foundation for Research and Development of Engineering Sciences and Technologies.
TABLE OF CONTENTS
ABSTRACT (Chinese)...I ABSTRACT (English) ...III ACKNOWLEDGMENTS...VI TABLE OF CONTENTS ... VII LIST OF TABLES ...IX LIST OF FIGURES... X NOMENCLATURE ... XIII
CHAPTER 1 INTRODUCTION...1
1.1 Motivation ...1
1.2 Objectives of this study ...5
1.3 Content of this thesis ...5
CHAPTER 2 LITERATURE REVIEW...7
2.1 Previous corona unipolar chargers ...9
2.2 Numerical studies of the corona unipolar chargers ...22
CHAPTER 3 METHODS...26
3.1 Experimental method...26
3.1.1 Design of unipolar charger with axial sheath air ...26
3.1.2 Experimental setup ...28
3.2 Numerical method ...32
3.2.1 Flow field...32
3.2.2 Electric potential and ion concentration fields ...35
3.2.3 Charged particle concentration field and particle charging efficiency ....36
CHAPTER 4 RESULTS AND DISCUSSION ...41
4.1 Experimental results for the charging efficiency of the charger with axial sheath air...41
4.1.1 Characteristics of the V-I curve ...41
4.1.2 Effect of sheath air flow rate ...43
4.2 Numerical results for the charging efficiency of the charger with axial sheath air...47
4.2.1 Flow streamlines, electric potential, ion concentration, and charged particle concentration fields ...47
4.2.2 Charging efficiency and electrostatic loss ...51
4.3 Performance evaluation of the charger with radial sheath air ...59
4.3.1 Characteristic of the V-I curve ...62
4.3.2 Flow streamlines, electric potential, ion concentration, and charged particle concentration fields ...65
4.3.3 Simulated extrinsic charging efficiency...72
4.3.4 Electrostatic loss and intrinsic charging efficiency ...75
CHAPTER 5 CONCLUSIONS AND RECOMMENDATIONS FOR FUTURE STUDY...79
5.1 Conclusions ...79
5.2 Recommendations for future study ...81
APPENDIX ...82
REFERENCES ...87
LIST OF TABLES
Table 2.1 Charging performances of corona-based unipolar aerosol chargers ...24 Table 2.2 Numerical studies of the corona-based unipolar aerosol chargers ...25
LIST OF FIGURES
Figure 2.1 Schemataic diagram of the unipolar charger using a radioactive source developed by Adachi et al. (1992). (from Intra and Tippayawong 2011) ...7 Figure 2.2 Schemataic diagram of the unipolar charger using a radioactive source
developed by Chen and Pui (1999). (from Intra and Tippayawong 2011)....8 Figure 2.3 Schemataic diagram of the corona-wire charger developed by Hewitt
(1957). (from Intra and Tippayawong 2009)...10 Figure 2.4 Schemataic diagram of the twin Hetwitt charger developed by Kruis and
Fissan (2001). (from Intra and Tippayawong 2011) ...10 Figure 2.5 Schemataic diagram of the corona-wire unipolar charger developed by
Biskos (2005a). (from Intra and Tippayawong 2011) ...11 Figure 2.6 Schemataic diagram of the corona-wire unipolar charger developed by Liu
and Pui (1975). (from Intra and Tippayawong 2011)...12 Figure 2.7 Schemataic diagram of the corona-wire charger developed by Büscher et
al. (1994). (from Intra and Tippayawong 2009)...13 Figure 2.8 Schemataic diagram of the corona-wire unipolar charger developed by
Cheng et al. (1997). (from Intra and Tippayawong 2011) ...14 Figure 2.9 Schemataic diagram of the corona-wire unipolar charger developed by
Biskos (2005b)...15 Figure 2.10 Schemataic diagram of the corona-wire unipolar charger developed by
Tsai et al. (2008, 2010)...15 Figure 2.11 Schemataic diagram of the corona-needle unipolar charger developed by
Whitby (1961). (from Intra and Tippayawong 2011)...16 Figure 2.12 Schemataic diagram of the corona-needle unipolar charger developed by
Hernandez-Sierra et al. (2003). (from Intra and Tippayawong 2009)...17 Figure 2.13 Schemataic diagram of the corona-needle unipolar charger developed by
Alonso et al. (2006). (from Intra and Tippayawong 2009) ...17 Figure 2.14 Schemataic diagram of the corona-needle unipolar charger developed by
Qi et al. (2008). (from Intra and Tippayawong 2009) ...18 Figure 2.15 Schemataic diagram of the corona-needle unipolar charger developed by
Li and Chen (2011)...19 Figure 2.16 Schemataic diagram of the corona-needle unipolar charger developed by
Figure 2.17 Schemataic diagram of the corona-needle unipolar charger developed by Qi et al. (2007)...21 Figure 2.18 Schemataic diagram of the corona-needle unipolar charger developed by
Kimoto et al. (2010) ...21 Figure 3.1 Schematic diagram of the charger with axial sheath air (unit: mm) ...27 Figure 3.2 Schematic diagram of the experimental setup ...31 Figure 3.3 Calculation domain in the numerical simulation of the charger with axial
sheath air (unit: mm)...34 Figure 4.1 Corona current versus applied voltage...42 Figure 4.2 (a) Experimental extrinsic charging efficiency and (b) Electrostatic loss of
20 nm particles versus corona voltage at different sheath air flow rates...45 Figure 4.3 Comparison of the experimental extrinsic charging efficiency of the
charger with axial sheath air with that of previous corona-based chargers ...46 Figure 4.4 (a) Flow streamlines, (b) electric potential field, and (c) ion concentration
field at
Q
sh = 3 L/min in the charger with axial sheath air. The applied voltage was -2.1 kV...49 Figure 4.5 Number concentration field of 20 nm particles carrying 0–2 charges in thecharger with axial sheath air when the applied voltage was -2.1 kV at
sh
Q
= 3 L/min. (a) 0 charge, (b) 1 charge, (c) 2 charges ...50 Figure 4.6 Comparison of the extrinsic charging efficiency of the charger with axialsheath air between the numerical results and experimental data at
Q
sh = 3 L/min. (a) Positive voltage, (b) negative voltage ...53 Figure 4.7 Comparison of the electrostatic loss of the charger with axial sheath airbetween the numerical results and experimental data at
Q
sh = 3 L/min.(a) Positive voltage, (b) negative voltage ...55 Figure 4.8 Comparison of the intrinsic charging efficiency of the charger with axial
sheath air between the numerical results and experimental data at Qsh = 3 L/min. (a) Positive voltage, (b) negative voltage ...56 Figure 4.9 Measured charge distribution at the exit of the charger with axial sheath
air at Qsh= 3 L/min at the applied voltage of (a) +2.1 kV and (b) -2.1 kV
Figure 4.10 (a) Schematic diagram and (b) calculation domains of design 1 and design 2 for the charger with radial sheath air (unit: mm; HV: high voltage) ...61 Figure 4.11 (a) Corona current versus the corona voltage and (b) ion number
concentration versus with the corona voltage in the wire-in-tube ESP...64 Figure 4.12 (a) Flow streamlines, (b) electric potential field, and (c) ion concentration
field at Qa= 1 L/min and Qsh= 0.7 L/min in design 1. The applied
voltage was +2.9 kV ...66 Figure 4.13 (a) Flow streamlines, (b) electric potential field, and (c) ion concentration
field at Qa= 0.5 L/min and Qsh= 0.7 L/min in design 2. The applied voltage was +3.5 kV ...68 Figure 4.14 Number concentration field of 20 nm particles carrying 0–2 charges in
design 1 when the applied voltage was +2.9 kV at Qa= 1 L/min and
sh
Q = 0.7 L/min. (a) 0 charge, (b) 1 charge, (c) 2 charges ...70 Figure 4.15 Number concentration field of 20 nm particles carrying 0–2 charges in
design 2 when the applied voltage was +3.5 kV at Qa= 0.5 L/min and
sh
Q = 0.7 L/min. (a) 0 charge, (b) 1 charge, (c) 2 charges ...71 Figure 4.16 Comparison of the predicted extrinsic charging efficiency of the charger
with radial sheath air with that of the unipolar chargers of Chen and Pui (1999) and Kimoto et al. (2010). (a) design 1, (b) design 2 ...74 Figure 4.17 Electrostatic loss as a function of particle diameter of the charger with
radial sheath air. (a) design 1, (b) design 2...77 Figure 4.18 Intrinsic charging efficiency as a function of particle diameter of the
charger with radial sheath air. (a) design 1, (b) design 2...78 Figure A1 Fraction of charged particles in the wire-in-tube ESP. (a) Ni t product as
the abscissa, (b) charging parameter as the abscissa...85 * Figure A2 Fraction of charged particles as a function of charging parameter in *
NOMENCLATURE
English symbols
A cross area for ions (m2)
a radius of particles (m)
c
C slip correction factor
in
C
particle number concentration measured upstream of the charger(particles/m3)
,
out OFF
C
particle number concentration measured downstream of the second ESP when no voltage is applied on the charger and the second ESP (particles/m3)
0
out
C
particle number concentration measured downstream of the charger when the charger is on and sufficiently high voltage is applied on the second ESP (particles/m3)
,
out ON
C particle number concentration measured downstream of the charger when
the charger is on and the second ESP is off (particles/m3) i
c mean thermal speed of ions (m/s)
Di ion diffusion coefficient (m2/s)
DB Brownian diffusion coefficient of particles (m2/s)
dp particle diameter (m)
dw diameter of the discharge wire (m)
E electric field strength (V/m)
Eb breakdown voltage (kV/m)
Er electric field strength in radial direction (V/m)
Ew electric field on the corona wire surface (kV/cm)
Ez electric field strength in axial direction (V/m)
e elementary charge (C)
GIN first iteration correction to the flux
I corona current (A)
Kn Knudsen number
kb Boltzmann constant (J/K)
0
d
L
diffusion loss of uncharged particles
-c con dif
L convection-diffusion loss of charged particles
el
L electrostatic loss
Mair molecular weights of air (kg/mol)
Mi molecular weights of ions (kg/mol)
Na Avogadro number (#/mol)
c
-con dif
N convection-diffusion deposition rate of charged particles (particles/s)
el
N electrostatic deposition rate of charged particles (particles/s)
Ni ion number concentration (ions/m3)
in
N rate of uncharged particles entering the inlet of the charger (particles/s) c
out
N rate of charged particles exiting the charger (particles/s)
Np,q concentration of particles carrying q elementary charges (particles/m3)
,
p T
N concentration of total charged particles (particles/m3)
T
N concentration of total uncharged particles at the inlet (particles/m3)
P pressure (Pa)
P0 pressure (atm)
ESP
P
penetration of uncharged particles through the second ESPa
Q aerosol flow rate (L/min)
sh
Q sheath air flow rate (L/min)
r distance between particles and ions center (m)
ra apsoidal distance (m)
rt radius of the tube (m)
rw radius of the discharge wire (m)
Sc source term
Sp sink term
T temperature (K)
T0 temperature (K)
t charging time (sec)
r
u air velocity in radial direction (m/s)
z
u air velocity in axial direction (m/s)
V electric potential (Volt)
c
V critical voltage for the corona generation (Volt)
Zi ion mobility (m2/s·V)
ZP particle electrical mobility (m2/s·V)
Greek letters
0
combination coefficient between an ion and an uncharged particle (m3/s)
q
combination coefficient of ions for particles carrying q elementary
charges (m3/s)
*
charging parameter
δ relative density of air
δr radius of the limiting sphere (m)
ε0 permittivity of air (A·s/Volt·m)
ext
extrinsic charging efficiencyint
intrinsic charging efficiencyθ dimensionless parameter
λi mean free path of ions (m)
μair air viscosity (kg/m·s)
ξ striking probability
ρair air density (kg/m3)
ρi space charge density (C/m3)
,0
i
space charge density at the discharge wire surface (C/m3)
electric potential between the particle and the ion (Volt)
Additional superscripts
0 uncharged particles
CHAPTER 1
INTRODUCTION
1.1 Motivation
Nanomaterial is defined as a material with any external dimension in the nanoscale or having internal structure or surface structure in the nanoscale. This generic term is inclusive of nano-object and nanostructured material (ISO/TS 80004-1:2010), in which nanoparticle is one of the types of nano-object with all three external dimensions in the nanoscale (ISO/TS 27687:2008; ISO/TS 80004-3:2010). Nanoparticles possess many unique physical, chemical and biological properties which lead to their diverse applications. However, some of the same unique properties that make nanoparticles useful are also properties that may cause nanoparticles harmful to humans or the environment. Many parameters such as size, shape, density, surface characteristics and composition influence the behavior, fate, transport, and toxicity of nanoparticles. Among them, size is one of the most important parameters. Therefore, it is important to characterize the size of nanoparticles accurately.
The differential mobility analyzer (DMA) shows the greatest promise for accurate sizing and classification of nanoparticles (Chen et al. 1998). To operate the DMA, aerosol particles must first be charged electrically to a known charge distribution on which nanoparticle sizing and classifying is based. In electrical aerosol instruments, the most commonly used techniques for charging particles is diffusion charging. Diffusion charging of particles can be either unipolar or bipolar, depending on the polarity of the ions colliding with particles. In unipolar charging, ions of only one polarity are present, and particles increase their charge with time. In bipolar charging, both positive and negative ions are present, and particles will acquire charges with time by attachment of ions of the opposite polarity until they reach an equilibrium charge distribution. This
process is also known as charge neutralization.
Bipolar diffusion chargers are commonly used with DMAs in scanning mobility particle sizers (SMPSs) (model 3085, TSI Inc.; Wang and Flagan 1990) for the measurement of particle size distribution because of a well defined charge distribution. However, the charging efficiency for nanopaticles is low because both charging and neutralization mechanisms happen at the same time, which is only 0.7%–4% and 0.8%–5%, respectively, for positively and negatively charged particles of 2–10 nm in diameter (Wiedensohler 1988). In other words, lots nanoparticles would be wasted during the classification process (Chen and Pui 1999). In addition, the extremely low nanoparticle charging efficiency of bipolar chargers could lead to low sensitivity in detecting nanoparticles with low concentration. Therefore, it is desirable to have high concentration of charged nanoparticles from the charger and before they are classified by the DMA.
Unipolar diffusion chargers provide higher charging efficiency than bipolar diffusion chargers because the recombination of charged particle with the ions of opposite polarity is avoided. To achieve high charging efficiency, various unipolar chargers were developed using corona discharge, ionizing radiation, soft X-rays or UV-light techniques to generate ions for diffusion charging (Kimoto et al. 2010; Intra and Tippayawong 2011). Among these techniques, corona discharge can produce unipolar ions at a high enough concentration for efficient diffusion charging (Hinds 1999). In comparison, radioactive sources are often undesirable due to the tight regulatory restriction, and soft X-rays sources are expensive. Moreover, the charging efficiency of UV-light technique is strongly material-dependent (Kulkarni et al. 2011).
Current commercial instruments that employ corona unipolar chargers include the electrical aerosol analyzer (EAA, model 3030, TSI Inc.), the ultrafine particle monitor
(UFP Monitor, model 3031, TSI Inc.), the electrical aerosol detector (EAD, model 3070A, TSI Inc.), the engine exhaust particle sizer (EEPS, model 3090, TSI Inc.), the fast mobility particle sizer (FMPS, model 3091, TSI Inc.), the nanoparticle surface area monitor (NSAM, model 3550, TSI Inc.; DC2000CE, EcoChem Analytics, League City, TX, USA), the portable nanoparticle aerosol monitor to determine lung-deposited surface area concentration (Aerotrak 900, TSI Inc.) and nanoparticle concentrations (Nanocheck, model 1.320, Grimm Aerosol Technik GmbH, Ainring, Germany; Nanotracer, Philips Areasense, Eindhoven, Netherlands), and the electrical low pressure impactor (ELPI, Dekati Ltd., Tampere, Finland).
Numerous corona-based unipolar chargers were designed using either a wire or a needle as the discharge electrode (Hewitt 1957; Whitby 1961; Kruis and Fissan 2001; Hernandez-Sierra et al. 2003; Unger et al. 2004; Biskos et al. 2005a; Alonso et al. 2006; Qi et al. 2008; Li and Chen 2011). Some designs involved mixing ion jet flow with aerosol flow in the charging chamber without an external electric field to reduce charged particle loss (Medved et al. 2000; Marquard et al. 2006a; Park et al. 2007; Qi et al. 2007; Kimoto et al. 2010). However, high efficiency charging is still difficult to obtain for nanoparticles smaller than 10 nm. Therefore, an aerosol charger with higher charging efficiency in this size range is needed to improve the sensitivity and accuracy of monitoring instruments for nanoparticles.
Some corona-wire charger designs have an additional sheath air flow either near the wall of the charger to reduce charged particle loss or around the discharge wire to prevent accretion of particles in the charging chamber. In the charger with axial sheath air, sheath air is introduced into the charging chamber in the same direction as the aerosol flow in the axial direction of the charger (Liu and Pui 1975; Büscher et al. 1994; Biskos et al. 2005b; Tsai et al. 2008, 2010), while sheath air is introduced into the
charging chamber perpendicular to the aerosol flow in the charger with radial sheath air (Cheng et al. 1997). For the charger with axial sheath air in Tsai et al. (2010), the extrinsic charging efficiency, defined as the intrinsic charging efficiency minus electrostatic loss, was higher than that of many existing corona-based unipolar chargers but lower than two unipolar chargers, which have the highest extrinsic charging efficiency for particles smaller than 10 nm in diameter. One of the charger was developed by Chen and Pui (1999) with the extrinsic charging efficiency of 22%–65% (dp = 3–10 nm; dp: particle diameter). The other is the charger of Kimoto et al. (2010)
with the extrinsic charging efficiency of 59%–64% (dp = 5–10 nm). For the charger of
Kimoto et al. (2010), no extrinsic charging efficiency for particles with dp 5 nmwas reported. In addition, charged particle loss was reduced but the charging efficiency was not reported for the charger with radial sheath air (Cheng et al. 1997). Therefore, the effect of radial sheath air on the charging efficiency and the optimization of the charger remain to be studied.
Diffusion charging has been studied theoretically and various models are available. Detailed overview on the diffusion charging models in all aerosol regimes can be seen in the literature (Romay and Pui 1992a; Biskos et al. 2004; Marquard 2007). For the unipolar charger, a comprehensive model, including the calculation of the flow, electrical potential, and ion concentration fields in the charging zone, is needed to predict the extrinsic charging efficiency and charged particle concentration field accurately (Qi et al. 2008). But so far no such detailed numerical models are currently available. An accurate numerical model which can be used to facilitate the design of an efficient unipolar charger for charging nanoparticles needs to be developed. Recently, Lin and Tsai (2010) developed a 2-D numerical model to predict the nanoparticle
flow filed, electric potential, and ion concentration fields in the ESPs were solved first. The charged particle concentration field and particle collection efficiency were then calculated based on the convection-diffusion equation in which particle charging was calculated by Fuchs theory (1963). The numerical model of Lin and Tsai (2010) was able to predict the experimental nanoparticle collection efficiency very well for particles smaller than 20 nm in diameter.
1.2 Objectives of this study
The objectives of this study are summarized as:
1. To design a corona-wire unipolar aerosol charger with axial sheath air to minimize particle loss and use experimental method to determine an optimum operating condition and investigate the charging efficiency.
2. To develop a 2-D numerical model to predict nanoparticle charging efficiency in the unipolar charger with axial sheath air and validate it with the experimental data. 3. To simulate a corona-wire unipolar aerosol charger with radial sheath air to enhance
the charging efficiency of nanoparticles and evaluate the performance of the charger to determine an optimum operating condition numerically.
1.3 Content of this thesis
In chapter 2, literature related to the previous designs and numerical studies of the corona unipolar chargers is reviewed. In chapter 3, the experimental methods for evaluating the performance of the charger with axial sheath air designed in this study are presented first, followed by the numerical methods for predicting the flow, electric potential, ion concentration, and charged particles concentration fields.
the charger with axial sheath air and the comparison of experimental data and numerical results. Then the numerical results for the performance evaluation of two designs of the charger with radial sheath air are presented. Finally, the predicted extrinsic charging efficiency of the charger with radial sheath air is compared with the highest extrinsic charging efficiency of the previous unipoalr chargers (Chen and Pui 1999; Kimoto et al. 2010). In chapter 5, the conclusions of this thesis are drawn and future work is recommended.
CHAPTER 2
LITERATURE REVIEW
A variety of unipolar chargers have been designed to generate ions by radioactive sources (Adachi et al. 1985, 1992; Romay et al. 1991; Romay and Pui 1992a; Wiedensohlor et al. 1994). In the charger of Adachi et al. (1992), as shown in Figure 2.1, the charger consisted of a Po210 radioactive source placed between two screen electrode enclosed by a Plexglass tube. When a positive voltage was applied to the inlet screen electrode and the out electrode was grounded, a uniform electric field was established between the electrodes. Negative ions were attracted to the inlet electrode, while positive ions flowed to the outlet electrode.
Figure 2.1 Schemataic diagram of the unipolar charger using a radioactive source developed by Adachi et al. (1992). (from Intra and Tippayawong, 2011)
In a later work, Chen and Pui (1999) designed a unipolar charger with the parallel configuration of aerosol and ion flow, as shown in Figure 2.2. A relatively weak electrical field was applied to keep the same polarity ions and collect the opposite
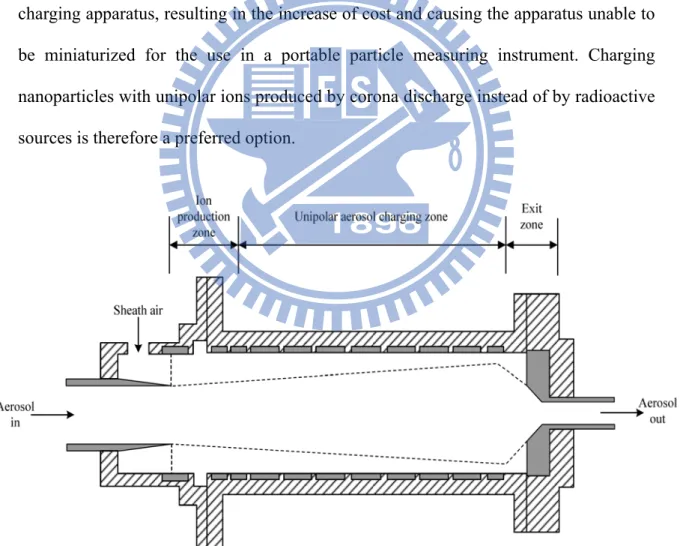
polarity ions from a Po210 radioactive source. The design further used a sheath air surrounding the aerosol flow to keep charged particles in the core region to minimize electrostatic loss. The extrinsic charging efficiency was found as high as 22% for 3 nm, 48% for 5 nm, and 65% for 10 nm particles. So far, this design has the highest extrinsic charging efficiency for particles smaller than 5 nm in diameter among all unipolar chargers. However, the issue of tight safety regulations on using radioactive sources remains. Moreover, the unipolar charger using radioactive sources required an electric field to separate the positive and negative ions is also referred to as a relatively complicated design. These technical features complicate the structure of the particle charging apparatus, resulting in the increase of cost and causing the apparatus unable to be miniaturized for the use in a portable particle measuring instrument. Charging nanoparticles with unipolar ions produced by corona discharge instead of by radioactive sources is therefore a preferred option.
Figure 2.2 Schemataic diagram of the unipolar charger using a radioactive source developed by Chen and Pui (1999). (from Intra and Tippayawong 2011)
2.1 Previous corona unipolar chargers
Numerous corona-based unipolar chargers were designed to achieve high charging efficiency using either a wire or a needle as the discharge electrode. Compared to the typical unipolar chargers using radioactive sources, the advantages of the corona unipolar chargers are the higher ion concentration and the elimination of radioactive sources. Intra and Tippayawong (2009, 2011) presented a detailed review of the corona-based unipolar chargers including the operating principles and physical characteristics of these chargers. The following paragraphs give a brief overview of the different designs of corona unipolar chargers and a comparison of the charging efficiency based on the work of Intra and Tippayawong (2009, 2011). The corona-wire chargers without sheath air are introduced first, followed by the corona-wire chargers with sheath air and corona-needle chargers.
In the corona-wire chargers without sheath air, Hewitt (1957) was one of the first to develop a corona-wire diffusion charger, as shown in Figure 2.3. The Hewitt charger consisted of a cylinder with a concentric wire along the axis. The corona discharge and aerosol flow region were separated by a metallic mesh and an alternating voltage (AC) was applied between the mesh and the outer electrode of the charger to reduce particles loss. Hewitt reported that the electric field strength resulted in high electrostatic loss for particles with a diameter as small as 70 nm. An improvement on the corona-wire charger based on the Hewitt’s design was carried out by Kruis and Fissan (2001). It was called the twin Hetwitt charger, as shown in Figure 2.4. The charging zone of this charger was separated from two ion production zones by the metal wire screens connected to two square-wave generators to prevent the expansion of aerosol flow into the corona discharge zone. Ions were produced in two cylindrical sections with an Au wire placed in the center of the metal cylinder. It was reported that the extrinsic
charging efficiency of this charger as high as about 5% for 5 nm particles.
Figure 2.3 Schemataic diagram of the corona-wire charger developed by Hewitt (1957). (from Intra and Tippayawong 2009)
Figure 2.4 Schemataic diagram of the twin Hetwitt charger developed by Kruis and Fissan (2001). (from Intra and Tippayawong 2011)
Biskos et al. (2005a) later developed a Hewitt-type corona charger, shown in Figure 2.5, consisted of two concentric electrodes with a tungsten wire placed along the axis. The generated ions migrated toward the inner electrode due to the high electric field. The inner electrode was made of a metallic mesh to allow the ions to flow in the charging zone. An AC voltage was applied on the outer electrode forced ions to enter the charging zone without causing charged particles to deposit on the wall of the charger while the perforated inner electrode was grounded. No extrinsic charging efficiency was reported for this charger.
Figure 2.5 Schemataic diagram of the corona-wire unipolar charger developed by Biskos (2005a). (from Intra and Tippayawong 2011)
In the corona-wire chargers with sheath air, the unipolar charger used in the commercial electrical aerosol analyzer (EAA, model 3030, TSI Inc.) was designed by Liu and Pui (1975). As shown in Figure 2.6, the charger consisted of two concentric metal cylinders with a tungsten wire placed along the axis of the cylinders. A high voltage was applied to the wire to produce a corona discharge from the wire. The ions were forced through the coaxial screen opening on the inner cylinder into the annular
gap region between the cylinders. The aerosol stream flowing in the annular gap was exposed to the unipolar ions. Axial sheath air was used to minimize particles from entering the corona cylinder. The performance of this charger in the nanoparticle range was reported by Pui et al. (1988). Significant charged particle loss was found below 10 nm. An improvement on this charger was designed by Büscher et al. (1994). As shown in Figure 2.7, an AC electric field was applied in the charging zone to reverse the direction of the charged particles before they deposit on the wall. Axial sheath air was also used to prevent particles from entering the corona discharge zone. With this improvement, the charger achieves a 4% extrinsic charging efficiency for 5 nm particles.
Figure 2.6 Schemataic diagram of the corona-wire unipolar charger developed by Liu and Pui (1975). (from Intra and Tippayawong 2011)
Figure 2.7 Schemataic diagram of the corona-wire charger developed by Büscher et al. (1994). (from Intra and Tippayawong 2009)
Cheng et al. (1997) developed a high-volume corona charger, shown in Figure 2.8, having flow rate of 0.6–6.0 m3/s with radial sheath air through the grounded porous wall of the metal tube to minimize the electrostatic loss, while the annulus aerosol flow was parallel to the six discharge wires mounted around a Teflon rod holder in the axial direction of the charger. The loss of charged particles in the submicron size range in the charger can be reduced by using radial sheath air at the flow rate of 2.4 m3/s or greater, but the extrinsic charging efficiency was not reported.
Figure 2.8 Schemataic diagram of the corona-wire unipolar charger developed by Cheng et al. (1997). (from Intra and Tippayawong 2011)
As shown in Figure 2.9, Biskos et al. (2005b) improved the design of Biskos et al. (2005a) with axial sheath air to achieve a high aerosol penetration and laminar flow inside the charger. The extrinsic charging efficiency of this charger was reported as high as about 24.9% for 10 nm particles. Recently, Tsai et al. (2008, 2010) developed a unipolar with multiple discharge wires to enhance the extrinsic charging efficiency by using axial sheath air near the wall of the charger to reduce the electrostatic loss of nanoparticles. This charger is shown schematically in Figure 2.10. The charger had a Teflon core to fix four gold wires and the outer stainless steel casing was grounded. To reduce charged particle loss in the charging zone, a clean sheath air was introduced from the 0.1 mm annular slit formed by the aluminum shroud and the outer casing. The performance of the charger was evaluated under different operating conditions including sheath air flow rates, corona voltages, and particles sizes. The highest extrinsic charging efficiency was 2.8%–86.3% for particles of 2.5–50 nm in diameter at the applied
Figure 2.9 Schemataic diagram of the corona-wire unipolar charger developed by Biskos (2005b).
Figure 2.10 Schemataic diagram of the corona-wire unipolar charger developed by Tsai et al. (2008, 2010).
In the corona-needle chargers, Whitby (1961) developed the first needle-type corona charger, shown in Figure 2.11, which consisted of an arrangement of a sharp needle at high voltage upstream of a sonic orifice to generate the ions within a non-conductive housing. Clean air entered at the inlet then passed through the orifice. It was reported that the ion concentration can be up to 1017 ions/m3 in the charging zone. A simple corona-needle charger for charging nanoparticles was proposed by Hernandez-Sierra et al. (2003), as shown in Figure 2.12. The design was a cylinder tube with tapered ends and divided into three sections. The first and second sections were made of methacrylate and the third (outlet) section of aluminum. A circular piece made of Teflon, placed between the two methacrylate sections, contained a series of orifices through the aerosol flows. The central piece was used to hold a stainless steel needle electrode, ending in a sharp tip coaxial with the cylinder. The outlet metallic section was grounded. It was reported that the extrinsic charging efficiency of this charger as high as about 2.1% for 2.7 nm particles.
Figure 2.11 Schemataic diagram of the corona-needle unipolar charger developed by Whitby (1961). (from Intra and Tippayawong 2011)
Figure 2.12 Schemataic diagram of the corona-needle unipolar charger developed by Hernandez-Sierra et al. (2003). (from Intra and Tippayawong 2009)
Later on, an improvement on the charger of Hernandez-Sierra et al. (2003) was made by Alonso et al. (2006) by modifying aerosol inlet geometry as well as the manner holding the discharge electrode shown schematically in Figure 2.13. It consisted of an inner stainless steel electrode ending in a sharp tip. The electrode is coaxial with a grounded metal cylinder which inner wall has a conical shape. The extrinsic charging efficiency of the charger of Alonso et al. (2006) was 1.8% for 3 nm particles.
Figure 2.13 Schemataic diagram of the corona-needle unipolar charger developed by Alonso et al. (2006). (from Intra and Tippayawong 2009)
A corona-needle miniature unipolar charger for a personal particle sizer was proposed by Qi et al. (2008). As shown in Figure 2.14, the charger consisted of two major components. The outer included a radial inlet tube and axial outlet tube. The second was the corona discharge module, consisting of a pointed tungsten needle electrode placed coaxially in the outer tube capped with a perforate dome. The corona discharge module was installed in the case at the end opposite the axial exit tube. It was reported that the extrinsic charging efficiency of this charger was 4% for 5 nm particles.
Figure 2.14 Schemataic diagram of the corona-needle unipolar charger developed by Qi et al. (2008). (from Intra and Tippayawong 2009)
Similar to the configuration of the charger of Qi et al. (2008), Li and Chen (2011) developed a corona-needle unipolar charger consisted of an outer metal case and a corona discharger tube module capped with a metal screen at one end, as shown in Figure 2.15. A pointed tungsten needle was used in the tube module to produce ions. The corona discharge tube module case was on the ion-driven voltage which was much lower than that applied to the needle. Ions produced in the tube module were driven through the metal screen by a weak electric field into the charging zone. The
geometrical arrangement of the tube module and the aerosol exit section allowed establishing the ion-driving field approximately in the longitudinal direction, which achieved the implementation of parallel electric and aerosol flow fields. The ion concentration in the charging zone can be controlled by varying the strength of the ion-driving field. It was reported that the extrinsic charging efficiency of this charger as high as about 8.8% for 5 nm particles.
Figure 2.15 Schemataic diagram of the corona-needle unipolar charger developed by Li and Chen (2011).
Whitby (1961) first introduced the concept of applying a sonic jet flow to direct unipolar ions out from the corona discharge zone in the development of an ion generator. Medved et al. (2000) used a similar principle in the design of a unipolar charger, shown in Figure 2.16, which was later modified and used in the electrical aerosol detector (EAD, model 3070A, TSI Inc.) and nanoparticle surface area monitor (NSAM, model 3550, TSI Inc.). Ions were generated at a corona needle tip in a small ion-genetration chamber connected to a mixing chamber via an orifice. An air flow transferred the ions
into the mixing chamber and an opposing aerosol flow promoted mixing the aerosol and the ions. However, the issue of particle loss in ion-particle flow mixing was often encountered in the above chargers.
Figure 2.16 Schemataic diagram of the corona-needle unipolar charger developed by Medved et al. (2000). (from Intra and Tippayawong 2009)
With a careful flow mixing arrangement, Qi et al. (2007) developed a mixing-type unipolar charger consisted of completely separated corona ionization and charging chambers, as shown in Figure 2.17. Sonic-jet flow was also used to inject unipolar ions into the charging chamber. Instead of injecting ions perpendicular to or against the aerosol flow directions in the previous chargers of the same type (Medved et al., 2000; Marquard et al., 2006a), the charger injected sonic-jet flowed from each of the two ionizers into the charging zone at a 45° angle to the charger axis. The use of angular impingement of dual jet flows in the charger not only canceled the jet energy in the radial direction but also facilitated the exit of charged particles. The extrinsic charging efficiency of the charger of Qi et al. (2007) was reported as 5.7% for 4 nm particles. Recently, Kimoto et al. (2010) also developed a mixing-type unipolar charger, shown in Figure 2.18, consisted of a high-pressure corona ionizer to generate unipolar ions and a
small charging chamber (0.5 cm3 volume) where the ions were mixed with nanoparticles without an external electric field at negative pressure. Up to now, the charger of Kimoto et al. (2010) showed the highest extrinsic charging efficiency among all existing corona-based unipolar chargers for particles smaller than 10 nm in diameter. The measured extrinsic charging efficiency was up to 59.7 % for 5 nm particles.
Figure 2.17 Schemataic diagram of the corona-needle unipolar charger developed by Qi et al. (2007).
Figure 2.18 Schemataic diagram of the corona-needle unipolar charger developed by Kimoto et al. (2010).
2.2 Numerical studies of the corona unipolar chargers
Diffusion charging has been studied theoretically and various models are available. Detailed overview on the diffusion charging models in all aerosol regimes can be seen from the literature (Romay and Pui 1992a; Biskos et al. 2004; Marquard 2007). In the transition regime (Knudsen number Kn1), the birth-and-death charging model (Boisdron and Brock 1970) with the ion-particle combination coefficient estimated by Fuchs diffusion charging theory (Fuchs 1963) was used to predict the charge distribution for the unipolar charger, assuming Ni t condition is given where Ni is the ion
concentration (ions/m3) and t is the charging time (sec) (Biskos et al. 2005b; Marquard et al. 2005; Qi et al. 2007, 2009; Vivas et al. 2008; Li and Chen 2011). The model assumes that ion concentration in the charging region is spatially uniform, considering neither the transport of ions and particles nor particle loss in the charger. These assumptions which are difficult to validate, especially for charging devices with complicated geometrical, electrical, and hydrodynamic conditions (Marquard et al. 2006b), could lead to inaccurate predictions. By considering the transport effects of ions and particles, some numerical models (Aliat et al. 2008, 2009; Alonso et al. 2009) were able to simulate unipolar diffusion charging based on Fuchs theory in a tube flow with the simple plug flow assumption for the flow field. However, the models are not applicable to other unipolar chargers with more complicated geometry. Huang and Alonso (2011) obtained particle trajectories through the combined mechanisms of diffusion and field charging to calculate nanoparticle electrostatic loss in the corona-needle unipolar charger for particles ranging from 3–30 nm in diameter. But the charging efficiency was not calculated. Kimoto et al. (2010) developed a theoretical model based on Fuchs theory to predict the extrinsic charging efficiency of an efficient small mixing-type unipolar charger. The measured charging efficiency for particles
smaller than 10 nm was much higher than the theoretical results due to the well-mixed flow assumption.
Table 2.1 and 2.2 summarize the charging performances and numerical studies of the above mentioned corona-based unipolar aerosol chargers, respectively. In summary, the charger performance depends on the extrinsic charging efficiency. An efficient unipolar charger should be further designed and developed for charging nanoparticles. In addition, an accurate numerical model which can be used to facilitate the design of an efficient unipolar nanoparticle charger and predict charging efficiency is needed to develop.
Table 2.1 Charging performances of corona-based unipolar aerosol chargers. Investigator Corona electrode Sheath air Ionized air flow Ni t product (s/m3) Charging efficiency
Hewitt (1957) Wire No No N.A. N.A.
Liu and Pui (1975) Wire Yes No 1.0 10 13 1.3% at 6 nm
Büscher et al. (1994) Wire Yes No 13
1.1 10 4.0% at 5 nm
Cheng et al. (1997) Wire Yes No N.A. N.A.
Kruis and Fissan (2001) Wire No No 13
8.0 10 5% at 5 nm
Unger et al (2004) Wire No No N.A. N.A.
Biskos et al. (2005a) Wire No No 13
2.1 10 N.A.
Biskos et al. (2005b) Wire Yes No 13
2.9 10 24.9% at 10 nm
Tsai et al. (2008) Wire Yes No 14
5.4 10 10.6% at 10 nm
Tsai et al. (2010) Wire Yes No 15
1.7 10 2.8% at 2.5 nm
Whitby (1961) Needle No No N.A. N.A.
Medved et al. (2000) Needle No Yes N.A. 8% at 5 nm
Hernandez-Sierra et al.
(2003) Needle No No N.A. 2.1% at 2.7 nm
Alonso et al. (2006) Needle No No 13
3.7 10 1.8% at 3 nm
Marquard et al. (2006a) Needle No Yes N.A. N.A.
Park et al. (2007) Needle No Yes N.A. N.A.
Qi et al. (2007) Needle No Yes 12
9.0 10 5.7% at 4 nm
Qi et al. (2008) Needle No No N.A. 4% at 5 nm
Kimoto et al. (2010) Needle No Yes 14
4 10 59.7% at 5 nm
Li and Chen (2011) Needle No No 13
Table 2.2 Numerical studies of the corona-based unipolar aerosol chargers.
Researcher Numerical method Particle
charging model Assumption / Limit
Biskos et al. (2005b); Marquard et al. (2005); Qi et al. (2007, 2009); Vivas et al. (2008); Li and Chen (2011)
Birth-and-death charging model
Fuchs theory (1963)
The ion concentration in the charging region is
spatially uniform.
Aliat et al. (2008, 2009);
Alonso et al. (2009) Eulerian method
Fuchs theory (1963)
Simple plug flow for the flow field in the charger.
Kimoto et al. (2010) Lagrangian method Fuchs theory
(1963)
Complete mixing of particles with ions in the
charging chamber.
Huang and Alonso (2011) Lagrangian method Combined
charging model
The charging efficiency is not available.
CHAPTER 3
METHODS
3.1 Experimental method
3.1.1 Design of unipolar charger with axial sheath air
Figure 3.1 shows the schematic diagram of the unipolar charger with axial sheath air which is a modification of the nanoparticle charger with multiple discharging wires developed by Tsai et al. (2010). The charger consists of a gold wire of 50 μm in diameter and 2 mm in length as the discharge electrode, on which a high D.C. voltage is applied from the top of the charger. The outer stainless steel cylindrical casing of 30 mm in diameter is grounded. The space between the gold wire and the stainless steel casing is the charging zone where aerosol charging takes place. The aerosol flow was introduced into the charger from the bottom and a filtered high-speed sheath air flow with the velocity of 0.9–7.1 m/s was introduced from an annular slit of 0.1 mm gap formed by the Teflon shroud and the outer casing to minimize charged particle loss. The charged particles were accelerated to exit the charger quickly through another annular slit of 0.1 mm gap after the charging zone.
Aerosol in Sheath air Aerosol out Gold wire Ø 30 Teflon Copper Stainless steel 57
3.1.2 Experimental setup
The experimental setup consisted of the aerosol generation section and performance evaluation section for measuring the charging efficiency and particle loss in the charger is shown in Figure 3.2 and similar to that described in Tsai et al. (2010). In the aerosol generation section, monodisperse Ag particles ranging from 2.5 to 20 nm in diameter were generated by the evaporation-condensation technique (Scheibel & Porstendorfer, 1983). First, silver powder was loaded in a ceramic boat placed in a tube furnace (Sunrise Co. Ltd., New Taipei City, Taiwan). Generated vapor was carried by clean air out of the furnace where polydisperse nanoparticles of high concentration were produced by quenching the hot vapor in a water-based cooler. The particles were neutralized by a TSI 3077A electrostatic charge neutralizer before being introduced into a Nano-DMA for classifying monodisperse test particles. Singly charged monodisperse particles were then neutralized and passed through a wire-in-tube electrostatic precipitator to remove all charged particles, allowing only uncharged particles to enter the unipolar charger for the charging efficiency experiments (performance evaluation section).
To generate the electric field and corona ions, high positive/negative voltage was supplied to the corona wire using a high-voltage D.C. power supplier (model SL P150/SL N30, Spellman High Voltage Electronic Corporation, NY, USA). The grounded stainless steel casing was connected to a picoammeter (model 6485, Keithley Instruments Inc., Cleveland, OH, USA) for measuring the corona current. The high-speed sheath air from the annular slit near the casing wall helped accelerate charged particles exit the charger. After charged aerosol flow to exit the charger, it passed through the second ESP for removing charged particles if the voltage was turned on. An ultrafine condensation particle counter (UCPC, model 3786, TSI Inc.) was used
to measure particle concentration downstream after the second ESP. For the experiment involving the measurement of particle charge distribution at the exit of the charger, the tandem-DMA method was used to measure the charge distribution of monodisperse particles of different sizes (Tsai et al. 2010).
Both particle charging efficiency and particle loss were measured at the sheath air flow rates (Qsh) from 0.5 to 4 L/min while the aerosol flow (Qa) was fixed at 1 L/min. There are four parameters used for the performance evaluation of unipolar electrical aerosol chargers (Marquard et al. 2006b), including intrinsic charging efficiency (
int), extrinsic charging efficiency
ext), electrostatic loss (Lel), and diffusion loss (0
d
L
). The superscript "0" represents uncharged particles. The intrinsic charging efficiency, which is defined as the fraction of initial uncharged particles acquiring charge inside the charger regardless of charged particle loss, can be calculated as (Tsai et al. 2010):
0 ,
out OFF out int ESP in
C
C
f
P
C
(3.1)where the dilution factor f is equal to the ratio of the total outlet aerosol flow rate to that at the inlet of the charger,
P
ESP is the penetration of uncharged particles through the second ESP,C
in is the particle number concentration (particles/m3) measuredupstream of the charger,
C
out OFF, is the particle number concentration measureddownstream of the second ESP when no voltage is applied on the charger and the second ESP, and
C
out0 is the particle number concentration measured downstream ofthe charger when the charger is on and sufficiently high voltage is applied on the second ESP to remove all charged particles.
charger which carries at least one elementary unit of charge: 0 , out ON out ext ESP in C C f P C
(3.2)where Cout ON, is the particle number concentration measured downstream of the charger when the charger is on and the second ESP is off.
Experimental particle electrostatic loss, Lel , and diffusion loss,
L
0d , inside the charger can be calculated asel out OFF, out ON,
ESP in
C
C
f
L
P
C
(3.3) 0d1
out OFF, ESP inC
f
L
P
C
(3.4)Tube furnace Excess water
Compressed dry air
Nano-DMA (TSI Model 3085) Neutralizer Impactor Vacuum (Excess Air) HEPA (Sheath Air) (Polydisperse aerosol) (Monodisperse Aerosol) Compressed dry air Quench water Rotameter Cooler Picoammeter Monodisperse uncharged aerosol ESP 2 Unipolar charger UCPC (TSI Model 3786) HEPA Sheath air HV Mass flowmeter Mass flowmeter Neutralizer ESP 1 HV High-voltage power supplier High-voltage power supplier SMPS (TSI Model 3936) TSI Vacuum pump HEPA Rotameter
Aerosol generation section
Performance evaluation section
3.2 Numerical method
3.2.1 Flow field
A 2-D numerical simulation was conducted in this study. The calculation domain of 35 mm in length and 15 mm in width is shown in Figure 3.3, in which the hatched areas represent the solid region. The gap between the charger body and the wall is 0.1 mm for both sheath air and exiting aerosol flows.
The laminar flow field model was used since the maximum flow Reynolds number based on the hydrodynamic diameter is 235.8, which is much smaller than 2000. The flow field in the charger was simulated by solving the following 2-D Navier-Stokes equations and continuity equation in the cylindrical coordinates:
2 2 2 1 r r r r air r air r z air u u P u u u u u r r z r r r r z r (3.5) 2 2 1 z z z z air r z air u u P u u u u r r z z r r r z (3.6)
1 0 z r u ru r r z (3.7) where u and r u is the air velocity in r and z direction (m/s), respectively, ρz air is theair density (kg/m3), P is the pressure (Pa), and μair is the air viscosity (kg/m·s). The
governing equations were discretized using the finite volume method and solved by the SIMPLER algorithm (Semi-Implicit Method for Pressure Linked Equations) (Patankar 1980). When dealing with the boundary at the inclined wall surface, the concept of blocked-off region was applied to divide the control volumes into active and inactive regions, the later of which represent solid regions. At the inlets of aerosol and sheath
the experimental values. The outflow velocity at the exit of the charger was calculated based on the continuity equation.
A total of 49,600 (248 in r–direction × 200 in z–direction) non-uniform rectangular grids were used in the calculation domain. The average grid size was about 60.5 and 175 μm in r (radial) and z (axial) direction, respectively, while the smallest size of 0.54 and 1.34 μm was assigned near the wire and the wall surfaces, respectively. The shape of the wire tip was flat. In the test run, the number of grids was either 12,400 (124 × 100), 49,600 (248 × 200) or 198,400 (496 × 400). As the number of grids was increased from 12,400 to 49,600 or 198,400, the accuracy for the numerical diffusion loss of 5 nm particles at
Q
sh= 3 L/min was also changed from 20.1% to 18.6% or 18.4%. With the number of grids of 49,600 and the computation time for the flow field of about 3 hours, the calculated diffusion loss of 5 nm particles atQ
sh= 3 L/min was found to be close to the experimental data of 17.9%. Further increase in the number of grids to 198,400, the diffusion loss only changed by about 0.2 % but the computation time for the flow field was increased to about 48 hours. Therefore, 49,600 grids were used in the simulation. The total number of iterations to reach convergence was about 10,000 for solving the flow field.Charger wall Gold wire Radius: 25 μm 5 2 2 5 3 5 13 15 0.1 11.9 1.325 1.675 35 Sheath air Aerosol inlet r z Symmetric line
Figure 3.3 Calculation domain in the numerical simulation of the charger with axial sheath air (unit: mm).
3.2.2 Electric potential and ion concentration fields
The present methods for calculating corona discharge and ion concentration field were based on the work of Lin and Tsai (2010). The governing equation, Poisson’s equation, for the electric potential field in the charger can be written as
2 2 0 1 r V V i r r r z (3.8)
where V is the electric potential (Volt), ρi is the space charge density (C/m3), and ε0 is
the permittivity of air (A·s/Volt·m).
The space charge density, ρi , in Equation (3.8) was calculated by the following
convection-diffusion equation as 2 2 ( r i r i i) ( z i z i i) 1 i i i u E Z u E Z D r r z r r r z (3.9)
where Di is the ion diffusion coefficient (m2/s), Zi is the ion mobility (m2/s·V), Er and Ez
are the local electric field strengths in r and z direction (Volt/m), respectively, which can be calculated as r V E r (3.10) z V E z (3.11)
In Equation (3.8), ion quenching by particles was neglected because the predicted ion concentration was much higher than the particle number concentration in this study. For example, when the applied voltage was +2.1 and -2.1 kV, the average ion number concentration was calculated to be 9.0 10 14 and 9.3 10 14 ions/m3, respectively,
which was five orders of magnitude higher than the measured particle concentration. In Equation (3.9), the source term of the corona current generated by charged particles was neglected either. For the ion mobility, a value of 1.15 10 -4 m2/s·V for positive ions
and 1.35 10 -4 m2/s·V for negative ions as suggested by Lin and Tsai (2010) was used
in the simulation. To solve Equations (3.8) and (3.9), the ion density, i,0, at the
discharge wire surface was calculated by the following equation:
,0 2 i w w i I r E Z (3.12)
where I is the corona current (A) and rw is the radius of the discharge wire (m). The
boundary condition at the wire surface followed the work of Aliat et al. (2009), in which the electric field on the corona wire surface, E , was assumed to be constant (Kaptzov w 1947) and the value was calculated from the following formula (Peek 1929):
1/ 2 0.3 30 1 ( ) w w E r (3.13)
where E is in kV/cm, w r is in cm, and w (T P TP0 / 0) is the relative density of the
air, in which T0( 298 K) and P0( 1 atm) is the reference temperature and pressure,
respectively.
3.2.3 Charged particle concentration field and particle charging efficiency
The governing equation for the concentration of particles carrying q elementary
2 , , , , , , 2 ( r p q r p p q) ( z p q z p p q) 1 p q p q B c p u N E Z N u N E Z N N N D r S S r z r r r z (3.14) where ZP is the particle electrical mobility (m2/s·V), which is defined by
p air c
p qeC d
Z /3 , q is the number of elementary units of charge, e is the elementary
charge (1.6×10⁻¹⁹ C), Cc is the slip correction factor, DB is the Brownian diffusion coefficient for particles (m2/s), and Sc is the source term, which represents the
generation of particles with q elementary charges. In equation (3.10), the boundary condition at the charger wall was assumed to be perfect absorption. The source term Sc
and sink term Sp are given by (Adachi et al. 1985; Aliat et al. 2009)
i q p q c N N S 1 , 1 (3.15) i q p q p N N S , (3.16)
where αq is the combination coefficient of ions for particles carrying q elementary
charges (m3/s) and can be calculated as (Fuchs 1963)
2 2 / 0 exp / 1 exp exp 4 r r i r b q a r i r b i b c k T a x c dx k T D a k T
(3.17)where c is the mean thermal velocity of ions (m/s), δi r is the radius of the limiting
sphere (m), ξ is the striking probability, kb is the Boltzmann’s constant (J/K), is the
electric potential between the particle and the ion (Volt) (Adachi et al. 1985), and a is the radius of particles (m). The ξ values shown in Table 1 of Hoppel and Frick (1986)