行政院國家科學委員會補助專題研究計畫
□ 成 果 報 告
□期中進度報告
(計畫名稱)
垂直圓柱容器中向下強制氣流流過一水平加熱晶圓之渦旋流結構與
相關熱傳特性研究
計畫類別:□ 個別型計畫 □ 整合型計畫
計畫編號:
NSC 92-2212-E-009-009
執行期間:2001 年 08 月 01 日至 2004 年 07 月 31 日
計畫主持人:林清發
計畫參與人員: 謝瑞青、陳尚緯、謝汎鈞、鄭詔文、吳佳鴻、羅文賢
成果報告類型(依經費核定清單規定繳交):□精簡報告 □完整報告
本成果報告包括以下應繳交之附件:
□赴國外出差或研習心得報告一份
□赴大陸地區出差或研習心得報告一份
□出席國際學術會議心得報告及發表之論文各一份
□國際合作研究計畫國外研究報告書一份
處理方式:除產學合作研究計畫、提升產業技術及人才培育研究計畫、
列管計畫及下列情形者外,得立即公開查詢
□涉及專利或其他智慧財產權,□一年□二年後可公開查詢
執行單位:國立交通大學
中 華 民 國 九十三 年 十 月 二十七 日
√
√
√
ABSTRACT
In this three-year research project (August 2001 to July 2004) we investigate the flow and thermal characteristics in a model experimental vertical CVD processor for processing 8-inch silicon wafer. In the CVD processor, the flow field is an important factor for growing a uniform thin film and it depends on the flowrate, jet-to-disk separation distance, injection pipe diameter and disk rotation. To obtain uniform temperature on disk surface we use copper disk to replace silicon wafer and heated by three heating resistance coils. Each coil is independently heated by A.C. power.
The experimental results clearly reveal a new vortex roll. More specifically, in the upper range of the jet Reynolds number tested here a small tertiary inertia-driven circular vortex roll appears near the upper wall of the chamber, in addition to the previously known primary and secondary inertia-driven rolls. Besides, we also note that a reduction in the jet-to-disk separation distance causes a delayed onset of the inertia-driven rolls except for H≧20.0 mm and in the meantime causes a substantial decrease in the Rayleigh number since RaH3, which in turn significantly reduces the size and strength of the buoyancy-driven roll. Moreover, at the smallest H of 10 mm the flow filed becomes steady state. Our data also suggest that the onset of the buoyancy roll takes place when the local buoyancy-to-inertia ratio at the edge of the disk Gr/Rewe2 ≈ 33.0 within the experimental uncertainty. The buoyancy-driven roll
can be eliminated by rotation disk due to action of the strong centrifugal force at a certain high disk rotation speed. Finally, the temperature data indicate that the steady radial air temperature distributions are nonmonotonic which mainly reflects the counter-rotating vortex flow structure of the primary inertia-driven and buoyancy-driven rolls.
摘要
在此三年期研究計畫裡(2001 年 8 月至 2004 年 7 月),我們探討在一垂直式 8 吋晶圓之 CVD 氣流場之實驗系統的熱流特性。在 CVD 成長薄膜單晶製程中, 為了成長均勻的薄膜,氣流場的特性變得相當重要且主要和氣流流速、氣流出口 至加熱圓盤的高度、氣流出口管徑以及加熱圓盤是否旋轉有關。另外,為了獲得 均勻的溫度分佈,在加熱圓盤的表面,我們使用銅板來取代晶圓,且由 3 段電阻 式加熱線圈來加熱,每段線圈是由交流電源獨立控制。 實驗結果顯示爐體存在新的渦流。另外,除了我們已知的 Primary 與 Secondary inertia-driven roll,在比較高的雷諾數時,有三次渦流在頂板且靠近衝 擊流附近產生。除此之外,我們也發現如果降低頂板到底板距離,除了距離大於 或等於 20.0mm 以外,會使得 Inertia-driven roll 出現的臨界雷諾數延遲,高度降 低後同時也降低了雷利數,所以 Buoyancy-driven roll 的尺寸與強度都減小。再 者,在 10mm 比較低的頂板到底板距離時,流場趨向於穩定。同時我們也發現 Buoyancy-driven roll 開始出現時的局部浮慣比約為 33.0。浮力趨動的渦流,可以 藉由旋轉加熱圓盤在某一高轉速下造成的離心力作用而消除。量測穩定或是統計 學 上 穩 定 的 流 場 在 徑 向 方 向 的 溫 度 發 現 有 一 最 大 值 , 這 是 因 為 Primary inertia-driven roll 與 Buoyancy-driven roll 同時存在的關係。CONTENTS
ABSTRACT
I 摘要 IICONTENTS
IIILIST OF TABLES
VLIST OF FIGURES
VINOMENCLATURE
XIVCHAPTER 1 Introduction
11.1 Motivation of the study 1
1.2 Literature review—heat transfer and flow characteristics of
impinging jets 2
1.3 Literature review—unsteady transitional impinging jets 5
1.4 Literature review—confined jet flow associated with CVD reactors
and RTP processors 6
1.5 Objective of the research project 7
CHAPTER 2 Experimental Apparatus and Procedures
82.1 Experimental apparatus 8
2.2 Analysis of time-average and instantaneous air temperature 11
2.3 Experimental procedures 11
2.4 Uncertainty analysis 12
2.5 Verification of the experiment 12
CHAPTER 3 Characteristics of Vortex Flow at Long Time
193.2 Onset of vortex flow 22
3.3 Effects of jet Reynolds number 25
3.4 Effects of Rayleigh number 28
3.5 Effects of processing chamber geometry 29
3.6 Size and location of the vortex rolls 30
3.7 Steady temperature distribution in vortex flow 32
3.8 Effects of disk rotation 32
CHAPTER 4 Characteristics of Time Dependent Vortex Flow
964.1 Time periodic vortex flows 96
4.2 Vortex flow suppression 99
4.3 Flow regime map 100
4.4 Formation of vortex flow 101
CHAPTER 5 Concluding Remarks and Recommendations
for future work
1155.1 Concluding remarks 115
5.2 成果自評 119
LIST OF TABLES
Table 2.1 Summary of the uncertainty analysis. ---13 Table 3.1 Critical condition for appearance of the secondary inertia-driven roll.---34 Table 3.2 Critical condition for onset of time-dependent flow for unheated disk and
Dj=10.0 mm. ---35
LIST OF FIGURES
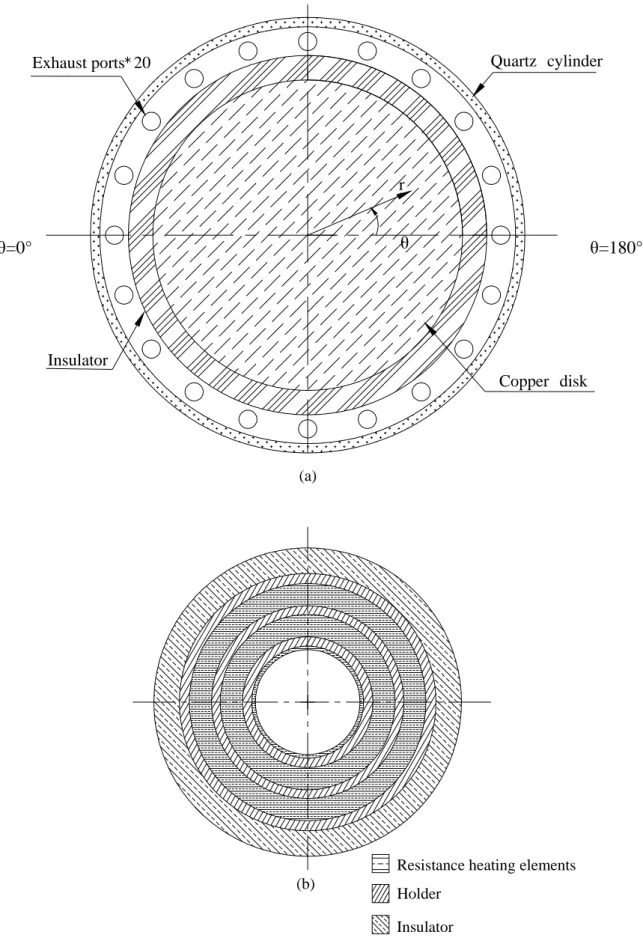
Fig. 2.1 Schematic diagram of the experimental system. ---14 Fig. 2.2 Schematic of the test section from the top view (a) and 3-zone concentric
heater (b). ---15 Fig. 2.3 Schematic diagram of the test section with (a) horizontal and (b) inclined
chamber tops. For clear illustration the diagrams are not plotted in
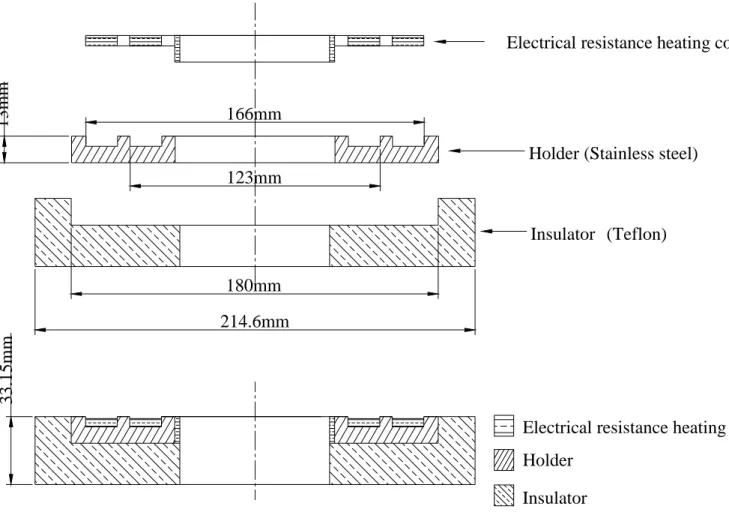
proportion to the actual geometrical dimensions. ---16 Fig. 2.4 The heater consists of three parts: resistances heating element, holder
and insulator. ---17 Fig. 2.5 The flow field for H/Dj=2 and Ra=0, left: the result from the present
study at Rej=406 for Dj=10.0 mm; right: contours of stream function
from Law and Masliyah (1984) at Re=400.---18 Fig. 3.1 Steady vortex flow pattern for Dj=10.0 mm and H=15.0 mm at Rej=406
(Qj=3.0 slpm) and Ra=3,170 (ΔT=10.0℃): (a) top view flow half of
photo taken at the middle horizontal plane between the disk and chamber top, (b) side view flow photo taken at the vertical plane θ=0 & 180 and (c) the corresponding schematically sketched cross ° °
plane vortex flow.---37 Fig. 3.2 Steady side view flow photos taken at the cross plane θ=0° for various
Rej to illustrate the tertiary inertia-driven roll with Ra=0 & Dj=10.0 mm
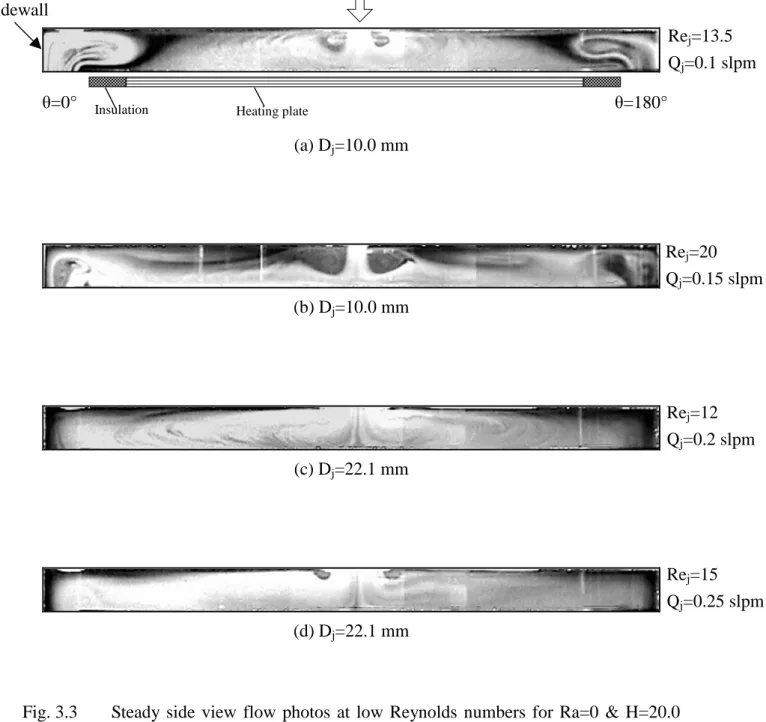
for (a) H=20.0 mm, (b) H=15.0 mm and (c) H=10.0 mm.---38 Fig. 3.3 Steady side view flow photos at low Reynolds numbers for Ra=0 &
H=20.0 mm: (a) Rej=13.6 & Dj=10.0 mm, (b) Rej=20.0 & Dj=10.0 mm,
(c) Rej=12.0 & Dj=22.1 mm and (d) Rej=15.0 & Dj=22.1 mm.---39
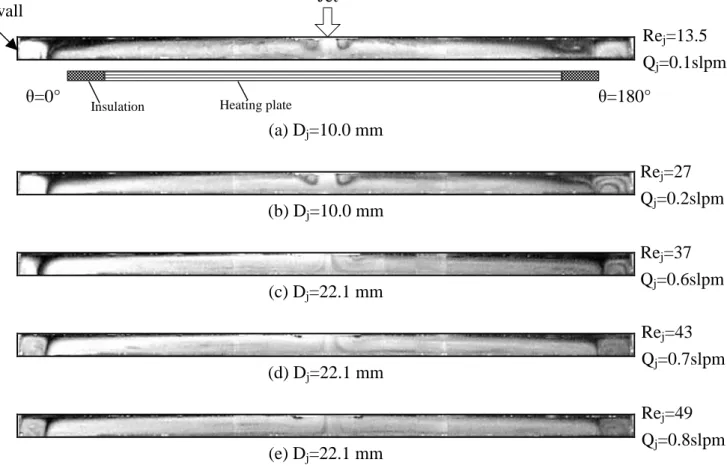
Fig. 3.4 Steady side view flow photos at low Reynolds numbers for Ra=0 & H=15.0 mm at Rej = (a) 27 & Dj=10.0 mm, (b) 41 & Dj=10.0 mm, (c)
12 & Dj=22.1 mm and (d) 18 & Dj=22.1 mm. ---40
Fig. 3.5 Steady side view flow photos at low jet Reynolds numbers for Ra=0 with H=10.0 mm at Rej = (a) 13.5 & Dj=10.0 mm, (b) 27 & Dj=10.0
mm. ---41 Fig. 3.6 Steady side view flow photos near the critical condition showing the
flow near the onset of buoyancy-driven roll for Ra=1650 (ΔT=2.2℃) with (a) Rej=612 & Dj=10.0 mm, (b) Rej=680 & Dj=10.0 mm, (c)
Rej=748 & Dj=10.0 mm, (d) Rej=275 & Dj=22.1 mm, (e) Rej=305 &
Dj=22.1 mm and (f) Rej=336 & Dj=22.1 mm.. ---42
Fig. 3.7 Steady side view flow photos taken at the cross plane θ=0° & 180° for various jet Reynolds numbers at Ra=0 (ΔT=0℃) for Dj= (a) 10.0 mm
and (b) 22.1 mm.---43 Fig. 3.8 Steady side view flow photos taken at the cross plane θ=0° & 180° for
various jet Reynolds numbers at Ra=3,760 (ΔT=5.0℃) for Dj= (a) 10.0
mm and (b) 22.1 mm. ---44 Fig. 3.9 Steady side view flow photos taken at the cross plane θ=0° & 180° for
various jet Reynolds numbers at Ra=7,520 (ΔT=10.0℃) for Dj= (a) 10.0
mm and (b) 22.1 mm. ---45 Fig. 3.10 Steady side view flow photos taken at the cross plane θ=0° & 180° for
various jet Reynolds numbers at Ra=11,270 (ΔT=15.0℃) for Dj= (a)
10.0 mm and (b) 22.1 mm. ---46 Fig. 3.11 Steady side view flow photos taken at the cross plane θ=0° & 180° for
various jet Reynolds numbers at Ra=15,030 (ΔT=20.0℃) for Dj= (a)
10.0 mm and (b) 22.1 mm. ---47 Fig. 3.12 Steady side view flow photos taken at the cross plane θ=0° & 180° for
various jet Reynolds numbers at Ra=18,790 (ΔT=25.0℃) for Dj= (a)
10.0 mm and (b) 22.1 mm. ---48 Fig. 3.13 Steady side view flow photos taken at the cross plane θ=0° & 180°
for various jet Reynolds numbers at H=15.0 mm & Ra=0 (ΔT=0℃) for
Dj= (a) 10.0 mm and (b) 22.1 mm. ---49
Fig. 3.14 Steady side view flow photos taken at the cross plane θ=0° & 180° for various jet Reynolds numbers at H=15.0 mm & Ra=1,590 (ΔT=5.0
℃) for Dj= (a) 10.0 mm and (b) 22.1 mm. ---50
Fig. 3.15 Steady side view flow photos taken at the cross plane θ=0° & 180° for various jet Reynolds numbers at H=15.0 mm & Ra=3,170 (ΔT=10.0
℃) for Dj= (a) 10.0 mm and (b) 22.1 mm. ---51
Fig. 3.16 Steady side view flow photos taken at the cross plane θ=0° & 180° for various jet Reynolds numbers at H=15.0 mm & Ra=6,340 (ΔT=20.0
℃) for Dj= (a) 10.0 mm and (b) 22.1 mm. ---52
Fig. 3.17 Steady side view flow photos taken at the cross plane θ=0° & 180° for various jet Reynolds numbers at H=15.0 mm & Ra=7,930 (ΔT=25.0
℃) for Dj= (a) 10.0 mm and (b) 22.1 mm. ---53
Fig. 3.18 Steady top view flow photos taken at the middle horizontal plane between the disk and chamber top with Ra=0 (ΔT=0℃ & D) j=10.0 mm
at H=15.0 mm for Rej= (a) 135, (b) 270, (c) 406, (d) 541 and (e) 676. ---54
Fig. 3.19 Steady top view flow photos taken at the middle horizontal plane between the disk and chamber top with Ra=6,340 (ΔT=20.0℃ & ) Dj=10.0 mm at H=15.0 mm for Rej= (a) 135, (b) 270, (c) 406, (d) 541
and (e) 676. ---55 Fig. 3.20 Steady top view flow photos taken at the middle horizontal plane
between the disk and chamber top with Ra=0 (ΔT=0℃ & D) j=22.1 mm
at H=15.0 mm for Rej= (a) 61, (b) 122, (c) 183, (d) 245 and (e) 306. ---56
Fig. 3.21 Steady top view flow photos taken at the middle horizontal plane between the disk and chamber top with Ra=6,340 (ΔT=20.0℃ & ) Dj=22.1 mm at H=15.0 mm for Rej= (a) 61, (b) 122, (c) 183, (d) 245
and (e) 306. ---57 Fig. 3.22 Steady side view flow photos taken at the cross plane θ=0° & 180°
for various jet Reynolds numbers at H=10.0 mm and Ra=0 (ΔT=0℃)
for Dj= (a) 10.0 mm and (b) 22.1 mm.---58
Fig. 3.23 Steady side view flow photos taken at the cross plane θ=0° & 180° for various jet Reynolds numbers at H=10.0 mm and Ra=470 (ΔT=5.0
℃) for Dj= (a) 10.0 mm and (b) 22.1 mm. ---59
Fig. 3.24 Steady side view flow photos taken at the cross plane θ=0° & 180° for various jet Reynolds numbers at H=10.0 mm and Ra=940 (ΔT=10.0
℃) for Dj= (a) 10.0 mm and (b) 22.1 mm. ---60
Fig. 3.25 Steady side view flow photos taken at the cross plane θ=0° & 180° for various jet Reynolds numbers at H=10.0 mm and Ra=1,410
(ΔT=15.0℃) for Dj= (a) 10.0 mm and (b) 22.1 mm. ---61
Fig. 3.26 Steady side view flow photos taken at the cross plane θ=0° & 180° for various jet Reynolds numbers at H=10.0 mm and Ra=1,880
(ΔT=20.0℃) for Dj= (a) 10.0 mm and (b) 22.1 mm. ---62
Fig. 3.27 Steady side view flow photos taken at the cross plane θ=0° & 180° for various jet Reynolds numbers at H=10.0 mm and Ra=2,350
(ΔT=25.0℃) for Dj= (a) 10.0 mm and (b) 22.1 mm. ---63
Fig. 3.28 Top view flow photos taken at the middle horizontal plane between the disk and chamber top with Ra =940 (ΔT=10.0℃ and D) j=10.0 mm at
H=10.0 mm for Rej= (a) 135, (b) 270, (c) 406, (d) 541 and (e) 676.---64
Fig. 3.29 Top view flow photos taken at the middle horizontal plane between the disk and chamber top with Ra=1,880 (ΔT=20.0℃ and D) j=22.1mm at
H=10.0 mm for Rej= (a) 61, (b) 122, (c) 184, (d) 245 and (e) 306. ---65
Fig. 3.30 Top view flow photos taken at the middle horizontal plane between the disk and chamber top with Ra =2,350 (ΔT=25.0℃ and D) j=10.0 mm at
H=10.0 mm for Rej= (a) 135, (b) 270, (c) 406, (d) 541 and (e) 676.. ---66
Fig. 3.31 Steady side view flow photos taken at the cross plane θ=0° & 180° for various Rayleigh numbers at Qj=3.0 slpm for Dj= (a) 10.0 mm &
Rej=406 and (b) 22.1 mm & Rej=184.---67
Fig. 3.32 Steady side view flow photos taken at the cross plane θ=0° & 180° for various Rayleigh numbers at Qj=5.0 slpm for Dj= (a) 10.0 mm &
Rej=676 and (b) 22.1 mm & Rej=306.---68
Fig. 3.33 Half of side view flow photos taken atθ=0° (left) and quarter of top view flow photos (right) taken at the middle horizontal plane between the disk and chamber top with Qj=3.0 slpm, H=20.0 mm and Dj=10.0
mm at steady state for Ra= (a) 0, (b) 7,520 and (c) 15,030. ---69 Fig. 3.34 Half side view flow photos taken atθ=0° (left) and quarter of top view
flow photos (right) taken at the middle horizontal plane between the disk and chamber top with Qj=3.0 slpm, H=20.0 mm and Dj=22.1 mm at
steady state for Ra=(a) 0, (b) 7,520 and (c) 15,030. ---70 Fig. 3.35 Steady side view flow photos taken at the cross plane θ=0° & 180°
(a) 10.0 mm and (b) 22.1 mm. ---71 Fig. 3.36 Steady side view flow photos taken at the cross plane θ=0° & 180°
for various Rayleigh numbers at H=15.0 mm with Qj=4.0 slpm for Dj=
(a) 10.0 mm and (b) 22.1 mm. ---72 Fig. 3.37 Steady side view flow photos taken at the cross plane θ=0° & 180°
for various Rayleigh numbers at H=15.0 mm with Qj=5.0 slpm for
Dj=(a) 10.0 mm and (b) 22.1 mm.---73
Fig. 3.38 Half side view flow photos taken atθ=0° (left) and quarter of top view flow photos (right) taken at the middle horizontal plane between the disk and chamber top with Rej=406, H=15.0 mm and Dj=10.0 mm at
steady state for Ra= (a) 0, (b) 3,170 and (c) 6,340. ---74 Fig. 3.39 Half side view flow photos taken atθ=0° (left) and quarter of top view
flow photos (right) taken at the middle horizontal plane between the disk and chamber top with Rej=184, H=15.0 mm and Dj=22.1 mm at
steady state for Ra=(a) 0, (b) 3,170 and (c) 6,340.---75 Fig. 3.40 Steady side view flow photos taken at the cross plane θ=0° & 180°
for various Rayleigh numbers at H=10.0 mm & Qj=1.0 slpm for Dj= (a)
10.0 mm and (b) 22.1 mm. ---76 Fig. 3.41 Steady side view flow photos taken at the cross plane θ=0° & 180°
for various Rayleigh numbers at H=10.0 mm & Qj=3.0 slpm for Dj= (a)
10.0 mm and (b) 22.1 mm. ---77 Fig. 3.42 Steady side view flow photos taken at the cross plane θ=0° & 180°
for various Rayleigh numbers at H=10.0 mm & Qj=5.0 slpm for Dj= (a)
10.0 mm and (b) 22.1 mm. ---78 Fig. 3.43 Steady side view flow photos taken at the cross plane θ=0° & 180° at
Qj=3.0 slpm & H=20.0 mm with Ra=0. ---79
Fig. 3.44 Steady side view flow photos taken at the cross plane θ=0° & 180° at
H=20.0 mm. ---80 Fig. 3.45 Steady side view flow photos taken at the cross plane θ=0° & 180° at
H=15.0 mm with Ra=0.---81 Fig. 3.46 Steady side view flow photos taken at the cross plane θ=0° & 180° at
H=15.0 mm. ---82 Fig. 3.47 Steady side view flow photos taken at the cross plane θ=0° & 180° at
H=10.0 mm. ---83 Fig. 3.48 Steady side view flow photos taken at the cross plane θ=0° & 180° for
Dj=10.0 mm at given ∆T=0℃ for various H. ---84
Fig. 3.49 Steady side view flow photos taken at the cross plane θ=0° & 180° for
Dj=10.0 mm at given ∆T=20.0℃ for various H. ---85
Fig. 3.50 Steady side view flow photos taken at the cross plane θ=0° & 180° for
Dj=22.1 mm at given ∆T=0℃ for various H. ---86
Fig. 3.51 Steady side view flow photos taken at the cross plane θ=0° & 180° for
Dj=22.1 mm at given ∆T=25.0℃ for various H. ---87
Fig. 3.52 Radial extent of the primary inertia-driven roll with Dj=22.1 mm for H=
(a) 10.0 mm, (b) 15.0 mm and (c) 20.0 mm.---88 Fig. 3.53 Radial location of the secondary inertia-driven roll with Dj=10 mm for
H= (a) 10.0 mm, (b) 15.0 mm and (c) 20.0 mm. ---89 Fig. 3.54 Radial variation in non-dimensional steady air temperature with various
Rej for H=15.0 mm & Dj=10.0 mm at Z=0.5 for Ra= (a) 3,170, (b)
6,340 and (c) 7,930. ---90 Fig. 3.55 Radial variation in non-dimensional steady air temperature with various
Rej for H=15.0 mm & Dj=22.1 mm at Z=0.5 for Ra= (a) 3,170, (b)
6,340 and (c) 7,930. ---91 Fig. 3.56 Radial variation in non-dimensional steady air temperature with various
Rej for H=10.0 mm & Dj=10.0 mm at Z=0.5 for Ra= (a) 1,410, (b)
1,880 and (c) 2,350. ---92 Fig. 3.57 Radial variation in non-dimensional steady air temperature with various
Rej for H=10.0 mm & Dj=22.1 mm at Z=0.5 for Ra= (a) 1,410, (b)
1,880 and (c) 2,350. ---93 Fig. 3.58 Steady side view flow photos taken at the cross plane θ=0° & 180° for
various jet Reynolds numbers at Ra=0 (ΔT=0℃) and Dj=10.0 mm for
Fig. 3.59 Steady side view flow photos taken at the cross plane θ=0° & 180° for various jet Reynolds numbers at Ra=15,030 (ΔT=20.0℃) and Dj=10.0
mm for (a)
ω
=0 and (b)ω
=30 rpm (Reω=2,335).---95Fig. 4.1 Side view flow photos at the cross plane θ=0° & 180° at certain time instant in a typical periodic cycle and time records of air temperature at selected locations in the middle horizontal plane Z=0.5 with H=20.0 mm for (a) Rej=136, Ra=11,270 & Dj=10.0 mm (tp=21.1 sec) and (b)
Rej=61, Ra=15,030 & Dj=22.1 mm (tp=13.8 sec). ---103
Fig. 4.2 The time records of non-dimensional air temperature and the corresponding power spectrum densities for Ra=15,030 and Dj=22.1
mm at location (R, Z) =(0.52, 0.5) for θ=0º with H=20.0 mm for various
Reynolds numbers Rej= (a)49, (b)61, (c)73, (d)85 and (e)98. ---104
Fig. 4.3 The time records of non-dimensional air temperature and corresponding power spectrum densities for Rej=61 and Dj=22.1 mm at location (R, Z)
=(0.52, 0.5) for θ=0º with H=20.0 mm for various Rayleigh numbers
Ra= (a) 11,270, (b) 15,030 and (c) 18,790. ---105 Fig. 4.4 Side view flow photos taken at the cross plane θ=0° for Rej=61,
Ra=11,270 and Dj=22.1 mm with H=20.0 mm at selected time instants
(right) and the corresponding schematically sketched cross plane flow
(left) in a typical periodic cycle (tp=13.3sec). ---106
Fig. 4.5 Half side view flow photos taken at θ=0° (left) and quarter of top view flow photos (right) taken at the middle horizontal plane between the disk and chamber top with Rej= 61, Ra=11,270 and Dj=22.1 mm for
H=20.0 mm at selected time instants in statistical state for (a) t=0 sec, (b)
t=5 sec, (c) t=9 sec and (d) t=13 sec.---107 Fig. 4.6 Side view flow photos at long time taken from the chambers at the cross
plane θ=0º & 180? for ΔT=20.0℃ (Rao=15,030) for various jet flow
rates with (a) Dj=10.0 mm & horizontal top, (b) Dj=10.0 mm & inclined
top, (c) Dj=22.1 mm & horizontal top and (d) Dj=22.1 mm & inclined
top. ---108 Fig. 4.7 Time records of non-dimensional air temperature in the chambers with
the inclined and horizontal tops for Dj=22.1 mm and Rej=61 at location
(R, Z) = (0.52, 0.5) for horizontal top and (0.52, 0.25) for inclined top for θ=0º for various Rayleigh numbers: (a) Rao=18,790, (b) Rao=22,550
and (c) Rao=26,300. ---109
Fig. 4.8 Flow region map delineating the temporal state of the vortex flow for
H=20.0 mm. ---110 Fig. 4.9 The side view flow photos at selected time instants during flow
formation at the cross planeθ=0° & 180° for Ra=0 at H=20.0 mm &
Dj=10.0 mm for Rej= (a) 136 and (b) 676. ---111
Fig. 4.10 The side view flow photos at selected time instants during flow formation at the cross planeθ=0° & 180° for Ra=0 at H=20.0 mm &
Dj=22.1 mm for Rej= (a) 61 and (b) 306. ---112
Fig. 4.11 Time variation of the size of the primary inertia-driven roll for various
Rej at Ra=0.---113
Fig. 4.12 Time variation of the location of the secondary inertia-driven roll for
NOMENCLATURE
Dj Jet diameter at the injection pipe exit (mm)
f Oscillation frequency of time periodic flow (Hz) F Non-dimensional oscillation frequency, f/(α/H2) g Gravitational acceleration (mm/s2)
Gr Grashof number, gTH3 2
Gr/Rej2 Critical buoyancy-to-inertia ratio for the onset of buoyancy induced roll
H Distance between the exit of injection pipe and heated plate (mm) Qj Jet flow rate (Standard Liter per Minute, slpm)
rs The center of the location of secondary inertia-driven roll (mm) z
, ,
r Dimensional cylindrical coordinates Z
, ,
R Dimensionless cylindrical coordinates, r/Rc,,z/H Ra Rayleigh number, gTH3
Rc Radius of processing chamber (mm)
Rw Radius of disk (mm)
Rej Jet Reynolds number,
j jD V
Rew Local Reynolds number in the wall-jet region, uH/
Rewe Local Reynolds number in the wall-jet region at the edge of heated disk
Reω Reynolds number of rotation, Rw2/
SI Size of primary inertia-driven roll (mm)
SO Size of buoyancy-driven roll (mm)
Tf Temperature of the heated disk (℃)
Tj Temperature of jet at the injection pipe exit (℃)
u Average velocity of the flow at wall-jet region (mm/s),
RejDj
/
8rHj
V Average velocity of the air jet at the injection pipe exit (mm/s)
Greek symbols
α Thermal diffusivity (mm2/s)
β Thermal expansion coefficient (1/K) ω Rotation speed (rpm)
ΔT Temperature difference between the heated disk and the injected air (℃) ν Kinematic viscosity (mm2/s) Φ Non-dimensional temperature,
TTj
/
Tf Tj
Superscript  ̄ Average Subscripts c Processing chamber e Edge of heated disk f Fluid, Airj Jet impinging
I Primary inertia-driven roll O Buoyancy-driven roll
s Secondary inertia-driven roll w Wall-jet region
Chapter 1
Introduction
1.1 Motivation of the study
Over the past decades, the flow and heat transfer associated with a jet impinging onto a heated flat plate of various shapes have been the subject of many investigations because of its superior heat transfer capability. The results have been applied to improve the drying of textiles and paper, annealing of glass, cooling of gas turbine components and electronic equipments, freezing of tissue in cryosurgery, and many others. For some industrial applications, however, such as electronic cooling [1] and chemical vapor deposition [2], both high values and radial uniformity of heat and mass transfer rate are important. Besides, the flow needs to be stable and contain no vortices. The interest in the impinging gas jet confined in a chamber has accelerated recently because of the quick technological progresses in the growth of semiconductor thin crystal films on silicon wafers through rapid thermal processing (RTP) [3] and chemical vapor deposition (CVD) processes.
In order to obtain good thin film properties, the temperature uniformity of the wafer, appropriate geometry of vertical RTP and CVD chambers, suitable operating conditions and flow configuration are very important factors in designing the processors for the thin film growth [4]. Particularly, the flow recirculation in the processing chamber is detrimental to the film properties. Apparently, the structure of the vortex flow in the processing chamber is mainly affected by the jet inertia and the buoyancy force due to the heated wafer, along with the geometry of the chamber including the nozzle diameter, nozzle-to-wafer distance, wafer and chamber diameters. In the processing chambers three distinct flow regimes have been identified: (a) plug flow, where the gas flows smoothly over the substrate without any recirculation in the
chamber, (b) buoyancy-induced flow, where the buoyancy force associated with the heat substrate induces upward flow and recirculation of the gas, and (c) mixed flow, where the flow driven simultaneously by inertia and buoyancy forces. But, the details on how these parameters affect the vortex flow characteristics remain largely unexplored. In an initial attempt to examine the flow recirculation associated with the RTP processes Lin and his colleagues recently visualized the vortex flow of gas in a model vertical RTP processor [5] and found that the flow was dominated by the two axisymmetric vortex rolls. How the jet flow rate, jet-to-wafer temperature difference, and chamber pressure affected the vortex flow pattern was investigated in detail. In the present study a new experimental system with more precise flow and temperature control of the jet flow and heated wafer is established to explore the roles of the inertia and buoyancy forces in influencing various aspects of the vortex rolls. The detailed characteristics of the rolls driven simultaneously by the combined action of the inertia and buoyancy are to be delineated. In particular, the onset condition and the characteristics of the steady and time-dependent mixed convective vortex flow will be explored in detail. Besides, the detailed processes through which the vortex rolls are formed will be examined.
1.2 Literature review—heat transfer and flow characteristics of
impinging Jets
Considerable amount of work from a number of research groups has been carried out in the past to study the fluid flow and heat transfer in the round or slot (two-dimensional) jet impinging onto a large horizontal plate. Most of the studies focus on quantifying the highly efficient heat transfer associated with the high speed impinging jets and the jets considered possess a much higher inertia force than the buoyancy force generated by the temperature nonuniformify in the flow. Therefore the
jet impinging flow is dominated by the jet inertia and some geometric parameters of the system. For instances, heat or mass transfer in the laminar and turbulent impinging jets was experimentally investigated by Gardon and Akfirat [6 & 7], Scholtz and Trass [8], Sparrow and Wang [9], Masliyah and Nguyen [10], and Hrycak [11]. Recently, the flow and thermal structures of the turbulent round jets were examined by Özdermir and Whitelaw [12] and Liu and Sullivan [13]. Moreover, the flow and heat transfer in the laminar impinging jets with the presence of an upper plate confinement were numerically predicted by Heiningen et al. [14], Saad et al. [15], and Law and Masliyah [16]. Besides, the results from the computation for the turbulent impinging jets were reported by Hosseinalipour and Mujumdar [17] and Morris and Garimella [18]. The corresponding heat transfer coefficient for the confined impinging jets was measured by Lin et al. [19]. A combined experimental and numerical study was recently conducted by Incropera and his colleagues [20 & 21] to explore the impinging liquid jets confined in a cylindrical container. The detailed flow characteristics in the impinging jets recently received considerable attention. The presence of a confinement plate above the target plate was noted to induce a big flow recirculation around the jet axis (Behnia et al. [22], Chua et al. [23], Voke and Gao [24]). The size and location of the recirculation center can be influenced by the jet Reynolds number and nozzle-to-plate spacing (Fitzgerald and Garimella [25], and Marple et al. [26]). The center of the flow recirculation was noted to move away from the jet axis when the nozzle-to-plate spacing was increased. This is in qualitative agreement with the experimental observation from Garimella and Rice [27]. The presence of the confinement plate is also known to restrict the jet flow entrainment from the surrounding, which reduces the jet spreading rate and leads to an increase in the potential core length (Ashforth-Frost et al. [28], and Ashforth-Frost and Jambunathan [29]). Additionally, a low pressure region is induced near the impinging
plate for single and double jets as the nozzle-to-plate spacing H/D is less than 2 (Baydar [30]). The pressure defect in the flow becomes more severe for a higher jet Reynolds number and a smaller nozzle-to-plate spacing. A round jet impinging onto a flat plate often results in double peaks in the Nusselt number distribution along the plate. The inner peak was considered to result from a local thinning of the boundary layer flow along the plate (Lee and Lee [31]) and it disappears for a large nozzle-to-plate spacing (Pamadi and Belov [32]). Lytle and Webb [33] and Li and Garimella [34] showed that the outer peak was more pronounced for a smaller nozzle-to-plate spacing and it moves radially outward for a higher jet Reynolds number. Schafer et al. [36] indicated that the outer heat transfer peak was due to the heat transfer enhancement associated with the secondary recirculation cell on the plate. Moreover, the flow in a confined jet was found to be dominated by a large recirculation vortex around the jet axis and a comparatively smaller adjacent secondary vortex right above the impinging plate (Law and Masliyah [16 & 35]). The location of the outer peak moves further away from the stagnation point at increasing jet Reynolds number but the location of the inner peak is independent of the Reynolds number (Colucci and Viskanta [37]).
The influences of the nozzle exit velocity profile on the impinging jet flow have been examined by Deshpande and Vaishnav [38]. Their results reveal that the peak values of the wall shear stress are lower for the uniform (flat) velocity profile. The results are attributed to the smaller momentum and kinetic energy for the same mass flux as compared with the parabolic velocity profile (fully developed velocity). Moreover, the potential core of the jet resulting from a fully developed velocity profile is longer than that from a flat velocity profile (Ashforth-Frost et al. [28]). Recently, Huang and El-Genk [39] examined a swirling impinging jet and found that the swirl caused the flow to spread radially outward much more rapidly than without
swirl. Besides, the swirl impinging jet induced markedly higher local and surface average Nusselt numbers and improved the radial uniformity of heat transfer on the impinged surface.
1.3 Literature Review—unsteady transitional impinging jets
More recently, the steady-to-unsteady flow transition for a confined laminar impinging jet (Rej<1000) was numerically investigated by Chiriac and Ortega [40].
They pointed out that the critical jet Reynolds number for the onset of unsteady flow was between 585 and 610. The unsteady jet was characterized by a dominant frequency corresponding to the formation of shear layer vortices at the jet exit. More complete information on various characteristics of the impinging jets can be found from the recent critical reviews by Viskanta [41] and Jambunathan et al. [42]. It should be pointed out that in the above studies [6 - 40] the buoyancy force exhibits negligible effects on the jet flow. Recently, the importance of the buoyancy effects in a confined water impinging jet was illustrated by Ichimiya et al. [43] and a number of somewhat deformed buoyancy induced vortices were noted. Santen et al. [44, 45] indicated that the thermal instability for a confined jet impinging onto a heated circular plate did exist and the onset was affected by the Reynolds, Rayleigh and Prandtl numbers. Elison and Webb [46] found that during the transition between the laminar regime (Rej 1500) and the turbulent regime (Rej 1500) the Nusselt number decreases for an increase in the jet Reynolds number. Some studies characterize the state of impinging jets according to jet’s centerline turbulence intensities. Lin et al. [19] measured the turbulence intensities in a confined slot jet and found that for Rej 1226 the turbulent intensity is less than 5% at the stagnation point. The jet flow is considered to be laminar. As the jet Reynolds number gradually
increases to 1226, the turbulence intensities at stagnation point increase sharply. Additionally, McNaughton and Sinclair [47] reported four characteristic jet regimes for circular free jets: dissipated-laminar jets for Rej 300, fully laminar jets for
1000 Re
300 j , semi-turbulent jets for 1000Rej 3000, and fully turbulent jets for Rej 3000.
1.4 Literature review—confined jet flow associated with CVD
reactors and RTP processors
In the impinging jet flow encountered in the CVD and RTP processes, the gases input to the CVD reactors and RTP processors are at relatively low flowrates and the silicon wafer upon which semiconductor thin crystal films are grown and processed is at an elevated temperature. Under such circumstance the buoyancy in the flow is no longer small compared with the jet inertia. Significant flow recirculation can be induced by the buoyancy and the impinging jet flow is driven by the combined effects of inertia and buoyancy. The importance of the buoyancy on the recirculating flow in a vertical CVD reactor was demonstrated by Wahl [48]. Similar investigations have been carried out for various types of CVD reactors including the metal organic CVD [49-53] and single-wafer RTP processors [54, 55]. In these studies for the processing of the microelectronic circuits [45-55] various vortex flow patterns were reported in the jet impinging flow. Buoyancy induced symmetry breaking of the jet flow was also noted [53]. The optimal geometry of a MOCVD reactor was numerically investigated by Kusumoto et al. [56]. They found that the optimal geometry for a larger flow rate should have a smaller inlet-to-pedestal spacing and a larger inlet pipe diameter. In addition, Santen et al. [57] reported nonuniform deposition rate caused by the nonuniformity of heat transfer resulting from a larger vortex roll near the cold side
wall. Their data also shows that the rotating wafer and geometrical adjustments can be used to improve the deposition rate.
1.5 Objective of the research project
The above literature review clearly reveals that the detailed vortex flow and thermal characteristics associated with a mixed convective low speed vertical gas jet impinging onto a heated horizontal circular plate in a confined vertical chamber, which is directly related to the gas recirculation in CVD and RTP processes, are still poorly understood. In this study an experimental system is established to delineate how the inertia and buoyancy forces affect the vortex flow patterns in this confined impinging jet flow through the detailed flow visualization and transient temperature measurement. Attention is focused on the effects of the jet flow rate, the temperature difference between the heated plate and jet, disk rotation speed, and the geometry of the processing chamber, which includes diameter of the injection pipe and jet-to-disk separation distance, on the steady and time-dependent vortex flow patterns and their onset. Moreover, the formation of the inertia-driven rolls will be explored in detail.
Chapter 2
Experimental Apparatus and Procedures
In order to conduct the experiment at reasonably low cost, we use air as the working fluid to replace the inert gases normally employed in real CVD and RTP processes. In view of the similar thermodynamic and thermophysical properties for various gases, the results obtained here are still applicable to the CVD and RTP systems. The schematics of the experimental system established in the present study to investigate the mixed convective vortex flow characteristics resulting from a round air jet impinging vertically downwards onto a horizontal circular heated disk confined in a cylindrical chamber and the test section are respectively shown in Figs. 2.1 and 2.2. The system consists of four major parts – the processing chamber, temperature measurement and data acquisition unit, heating unit, and gas injection unit. The gas is first brought into the processing chamber through an injector and then injected directly onto a circular heated disk. The major parts are briefly described in the following.
2.1 Experimental apparatus
The processing chamber, which is made of 6.0-mm thick quartz glass to allow for the observation of the vortex flow in it, is cylindrical and has a diameter of 291.0 mm. The vertical distance between the jet inlet and exhaust ports of the processing chamber is 200.0 mm. The chamber can be installed with a horizontal top or an inclined top. For the horizontal top the distance between the injection pipe and the circular disk are, respectively, 10.0, 15.0, 20.0 and 30.0 mm (Fig. 2.3(a)). For the case with the tapering top the top of the processing chamber is inclined linearly downwards in the radial direction. More specifically, the top-to-disk separation
distance is reduced from 20.0 mm at the exit of the injection pipe to 10.0 mm at the chamber side (Fig. 2.3(b)). To facilitate the flow visualization, the two chamber tops are both made of acrylic plates. Air is injected vertically downwards from a long straight circular pipe into the cylindrical chamber along the axis of the chamber and impinges directly onto the heated disk. The air flows first over the heated disk, then moves through the annular section of the chamber, and finally leaves the chamber via twenty circular outlets of 12.7 mm in diameter opened at the bottom of the chamber (Fig. 2.2(a)). The chamber is sealed to prevent any gas leakage. The top, bottom and side walls of the chamber are thermally well insulated to reduce the heat loss from the processing chamber to the ambient by covering the entire chamber with a superlon insulator of 100.0-mm thick. The insulator can be opened during the flow visualization.
The heating unit is designed to maintain the circular disk at the preset uniform temperature during the experiment. It is composed of a 10.0 mm thick high purity circular copper plate of eight-inch in diameter, acting as the disk, placed on 15-mm thick stationary copper disk. The 10.0 mm thick circular disk is rotated by A.C. motor driver. The heater attached onto the back side of the stationary copper plate is divided into 3 concentric zones. The heating unit consists of a resistance heating element, a holder and an insulator. The holder which is made of stainless steel can support the resistance heating element and copper disk at the high temperature. The heater attached onto the back side of the copper plate is divided into 3 concentric zones (Fig. 2.4). Each zone is independently heated by a power supply with the D.C. current passing through the nickel coil placed on the stainless steel holder. The entire heating unit is then placed on a Teflon plate. Additionally, to reduce the heat loss from the sidewall of the copper plate and Teflon plate, the lateral surface of the entire heating unit is wrapped with a 16.0 mm thick thermal insulation layer of superlon. A proper
control of the voltage from each power supply allows us to maintain the copper plate at a nearly uniform temperature. Moreover, the copper plate temperature is measured by several corrected and calibrated T-type thermocouples at selected detection points located at 1-mm below the upper surface of the copper plate, which are fixed the detection points through the small holes drilled from the backside of the plate.
The gas injection unit consists of a 2HP air compressor, a flow meter, a smoke generator, filters, pressure regulator, connection pipes and injector. In the experiment, air is drawn from the ambient by the compressor and sent into a 300-liter and 100-psi high-pressure air tank and is filtered to remove moisture and tiny particles. The installation of the high-pressure air tank is to suppress the fluctuation of the air flow and extends the life of the compressor. Then, the air is mixed with smoke tracers in the smoke generator, and regulated by the pressure regulator and is later injected into the processing chamber through the straight circular injection pipe which is coaxial with the processing chamber. The downward vertical air jet issuing from the pipe outlet impinges directly onto the heated plate. In the present study, two injection pipes with diameters, 10.0 and 22.1 mm, are tested and the straight portions of the pipes are both 600.0 mm long. The length of the injection pipes is selected to ensure that they are long enough to allow us to have a fully developed air flow at the exits of the injection pipes. The air temperature at 600.0 mm upstream of the exits of the injection pipes is measured by a corrected and calibrated T-type thermocouple. The measured value is considered as the temperature of the air injected into the processing chamber since the whole injection pipe is thermally well insulated by a superlon insulation layer of 16.0-mm thick.
A smoke-tracer flow visualization technique is employed to observe the flow patterns resulting from the jet impinging onto the heated disk in the cylindrical chamber. The air flow pattern in the chamber is illuminated by the vertical and
horizontal plane light sheets produced by passing parallel lights from an overhead projector through two adjustable knife edges. The experimental system is located in a darkroom to improve the contrast of the flow photos. The time variations of the flow pattern during the entire transient stage from the top and side views are recorded by the Sony digital video camera DCR-PC100. The recorded images are later examined carefully in a personal computer.
2.2 Analysis of time-average and instantaneous air temperature
To understand thermal characteristics of the steady and unsteady vortex flows, the temperature of the air flow in the processing chamber is measured by inserting a thermocouple probe into the chamber through twenty-four holes of 1-mm in diameter opened at the selected locations on the top of the chamber. In the experiment, the thermocouple tip is positioned at selected vertical distances from the upper surface of the disk. More specifically, the thermocouple probe is an OMEGA (model HYPO) mini hypodermic extremely small T-type thermocouple implanted in a 1 inch long stainless steel hypodermic needle.
2.3 Experimental procedures
For each case the experiment starts with the air at the room temperature Ta
compressed first into the high pressure tank and the smoke generator through the connection pipe, and then injected into the processing chamber. The air moves over the disk and finally leaves the chamber through the twenty circular outlets at the bottom of the chamber. In the meantime the temperature of disk and the air flow rate are controlled at the preset levels. As the air flow in the processing chamber reaches steady or statistically stable state, we begin to visualize and record the vortex flow pattern in the chamber.
2.4 Uncertainty analysis
Uncertainties in the Rayleigh number, Reynolds number and other independent parameters are calculated according to the standard procedures established by Kline and McClintock [58]. The uncertainties of the thermophysical properties of the air are included in the uncertainty analysis. The properties of the working fluid (air) are α=0.22(cm2
/s), β=0.0034 (1/k), ν=0.16 (cm2/s) and Pr=0.72 at 30℃ and 1.0 bar. In addition, the uncertainties of the control unsteadiness and temperature nonuniformity of the heated disk are accounted for in the evaluation of the data uncertainty. The uncertainties of the temperature, volume flowrate, dimensions, Reynolds number and Rayleigh number measurements from this analysis are summarized in Table 2.1.
2.5 Verification of the experiment
To validate our experimental setup, the flow observed in the processing chamber for the limiting case when the disk is unheated (Ra=0) is compared with the numerical results from Law and Masliyah [16] for the impinging jet flow with the top plate confinement but without the sidewall confinement. The comparison is illustrated in Fig. 2.5 by showing the steady side view flow photo for an axisymmetric flow with the jet Reynolds number around 400 at Dj=10.0 mm and H/Dj=2. Note that in the
region surrounding the jet axis the resulting vortex flow from our flow visualization is qualitatively the same as their numerical prediction. In the side wall region we have another circular vortex roll which results from the deflection of the boundary layer flow along the disk by the chamber side. But this is not seen in their prediction obviously due to the absence of a sidewall in their study. Thus, the experimental system established here is considered to be suitable for the present study.
Table 2.1 Summary of the uncertainty analysis
Parameter and Estimate Uncertainty
Parameters
Uncertainty
D
j, D
w, H (m)
± 0.00005 m
T (℃)
± 0.2℃
ΔT (℃)
0.3℃
Q
j(slpm)
± 2%
μ (Nm/s
2)
± 0.05%
ρ (kg/m
3)
± 0.05%
υ (m
2/s)
± 0.07%
Ra
8.6%
Re
j2.3%
Air Outlet
Air Inlet
Control Unit ( Heating Control Unit & Data Acquistion Sysem)
291mm Test Section 12.7mm Air Compressor Dryer Water Filter Water Filter Air Tank Flowmeter 0~20 slpm 0~1 slpm Particle Filter Oil Filter By pass Pressure Regulator
Smoke Generator Developing Section (Adiabatic)
600mm Thermocouple T 1 0 ~ 30 m m Copper
Resistance heating coil Holder Superlon (Insulator) Teflin (Insulator) Heater
z
r
16mm 108mm Processing Chamber Air OutletFig. 2.1 Schematic diagram of the experimental system.
ω
Control Unit
(Heating Control Unit, Data Acquisition system & Motor)
r Quartz cylinder Exhaust ports 20 Insulator Copper disk Insulator Holder (a) (b)
Resistance heating elements
Fig. 2.2 Schematic of the test section from the top view (a) and 3-zone concentric heater (b).
θ
16mm 291mm 200mm
r
12.7mm 2 0m m Processing Chamber 108mm Air Inletz
Heater Test Section 10 & 22.1 mm Dj Insulator O. (a) 12.7mm 10 & 22.1mm 20m m 10m m Air Inlet Dz
r
(b)Fig. 2.3 Schematic diagram of the test section with (a) horizontal and (b) inclined chamber tops. For clear illustration the diagrams are not plotted in proportion to the actual geometrical dimensions.
O
10~30
m
Holder Insulator
Electrical resistance heating coils 214.6mm 180mm 123mm 166mm 3 3.15 m m 1 3mm
Electrical resistance heating coils
Holder (Stainless steel)
Insulator (Teflon)
(b)
Fig. 2.5 The flow field for H/Dj=2 and Ra=0, left: the result from the present study at
Rej=406 for Dj=10.0 mm; right: contours of stream function from Law and
Masliyah (1984) at Rej=400. 8 8 8 . 6 j D r 6 . 7 j D r 0 j D r 14.5 j D r 5 . 14 j D r
Chapter 3
Characteristics of Vortex Flow at Long Time
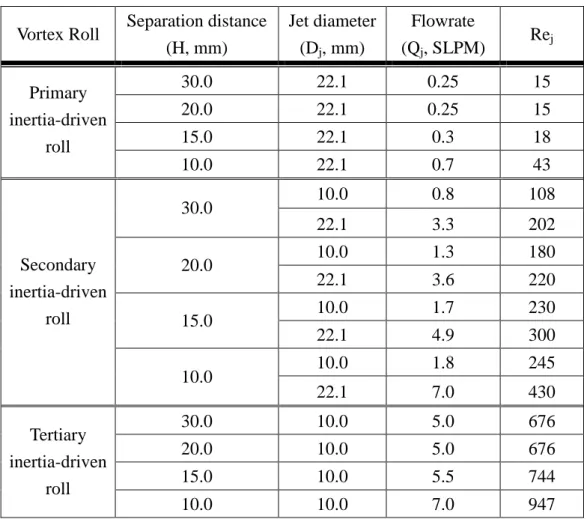
As mentioned in Chapter 1, the flow characteristics associated with the air jet impinging onto the heated disk confined in the cylindrical space under investigation are affected by the jet inertia, buoyancy force due to the heated disk, and the geometry of the chamber including the injection pipe diameter and jet-to-disk separation distance. The present study intends to explore the effects of these parameters on the flow and thermal characteristics in the processing chamber. More specifically, in the present experiment the air flow rate Qj is varied from 0.2 to 9.3 slpm (standard liter
per minute) and the temperature difference between the heated plate and injected air ΔT is varied from 0 to 25.0℃ for two injection pipes with Dj=10.0 and 22.1 mm. Four
jet-to-disk separation distances are considered with H=10.0, 15.0, 20.0, and 30.0 mm. The dimensionless groups governing the flow are the jet Reynolds number and the Rayleigh number. They are respectively defined as
j j j j j V D / 4Q / D Re (3.1) and g TH / Ra 3 (3.2)
In addition, the local Reynolds number and average radial velocity of the flow in the wall-jet region are respectively defined as
Rew = ūH/ν (3.3)
and
ū = Qj / 2πrH= RejDjν / (8rH) (3.4)
Hence Rew can be rewritten as r 8 / D Re Rew j j (3.5)
Thus, in this part of the study the jet Reynolds number ranges from 12 to 1,258 and the Rayleigh number from 0 to 63,420. At this low Reynolds number the impinging
jet when unheated is laminar and steady, according to Chiriac and Ortega [40]. Only in examining the critical condition for the appearance of the inertia-driven and buoyancy-driven rolls, however, the maximum jet Reynolds number is increased to 1,258 (Qj=9.3 slpm). The ranges of the parameters chosen above are in accordance
with the values of the governing dimensionless groups for the flow often encountered in the CVD processes [4]. In what follows selected flow photos from the top and side views taken at steady or statistically stable state in the present study are examined closely to unravel how the jet Reynolds number, Rayleigh number, jet-to-disk separation distance and injection pipe diameter affect the recirculating gas flow patterns resulting from the impinging air jet in the processing chamber.
3.1 Typical steady vortex flow pattern
At first, the typical vortex flow pattern observed in the processing chamber with the jet issued from the small injection pipe (Dj=10.0 mm) at long time when the flow
already reaches steady state for the case with a low buoyancy-to-inertia ratio Gr/Re2j is illustrated in Fig. 3.1. Here Gr is the Grashof number and Gr=Ra/Pr. In the figure the steady flow photos from the top and side views taken respectively at the selected horizontal and vertical planes along with the schematic sketch of the flow based on the detailed flow visualization for a typical case with Qj=3.0 slpm, ΔT=10.0℃ and
H=15.0 mm (Rej=406, Ra=3,170 and
2 j Re
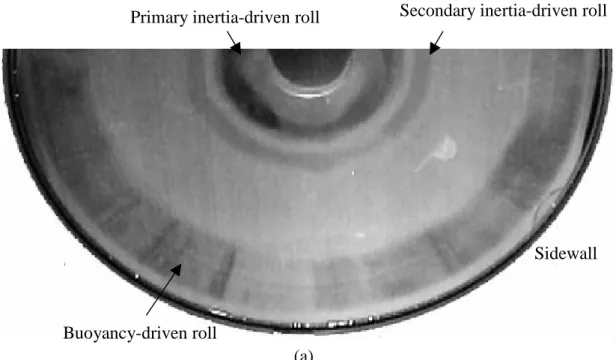
Gr/ =0.019) are shown. Since the flow is axisymmetric at this low Gr/Re2j, only a half of the top view flow photo and the side view flow photo at the vertical plane θ=0° & θ=180° are given here. Examining the top and side view photos together reveals that the steady vortex flow consists of three circular vortex rolls in the processing chamber. The first (inner) circular roll directly surrounds the downward air jet and is much larger than the second vortex roll induced
in the middle zone of the chamber. The third (outer) roll is also large in size and dominates in the outer zone of the chamber. A close inspection of the successive top and side view flow photos in the video tapes taken during the transient stage of the flow formation indicates that immediately after the impinging, the jet is deflected by the circular disk to move obliquely upwards (Fig. 3.1(c)). Then the oblique flow is divided into two streams as it encounters the chamber top. One stream moves radially inwards towards the low pressure region created by the jet injection forming the inner toroidal vortex, which is considered as the primary inertia-driven vortex roll. This inner roll is also entrained by the jet and is normally stronger and larger at a higher jet Reynolds number. Another stream moves radially outwards, later turns to move downwards along the sidewall of chamber, and finally leaves the chamber through the outlets in the chamber bottom. Besides, the smaller second circular roll is found to be induced through the viscous shearing effects produced by the stronger and larger inner vortex roll, which is termed as the secondary inertia-driven roll. Moreover, the local maximum pressure occurs at the stagnation point and sharply decreases to minimum value after stagnation point. The local pressure after minimum value gradually increases since the available flow area increases as the air flows past the center of the primary inertia-driven roll. In the pressure recovering region, the positive pressure gradient enhances the occurrences of the flow separation. It should be mentioned that this secondary roll is induced only when the jet Reynolds number exceeds certain level around 180 for the small injection pipe (Dj=10.0 mm) when the disk is unheated
with Ra=0. Moreover, the outer roll near the cold chamber side is driven by the buoyancy force associated with the heated disk and is regarded as the buoyancy-driven roll. For the large injection pipe (Dj=22.1 mm) at the same gas flow
rate the secondary inertia-driven roll is weaker and smaller since the jet Reynolds number is much lower (Equ. (3.1)). In addition, for a further increase in the jet
Reynolds number a small circular roll appears near the top wall around the impinging jet at Dj=10.0 mm and it is considered as the tertiary inertia-driven roll. At this high
Rej for the small injection pipe the primary roll is strong enough to induce a tertiary
roll through the viscous shearing of the stagnant flow around the primary roll. For Dj=22.1 mm the range of the jet Reynolds number covered in the present study is not
high enough to induce a tertiary roll. The inertia-driven steady tertiary flow is illustrated in Fig. 3.2 by showing the steady side view flow photos taken at the cross plane θ=0? for slightly supercritical jet Reynolds numbers at various jet-to-disk separation distances for Dj=10.0 mm. Since the steady flow is still axisymmetric, only
the results in the half plane are shown. The results in Fig. 3.2 manifest that the tertiary roll is small and appears in the region near the chamber top adjacent to the primary inertia-driven roll. The primary, secondary and tertiary inertia-driven rolls are smaller at the smaller jet-to-disk separation distance. This simply reflects the fact that at a smaller H the available space in the processing chamber for the rolls to develop is less. Note that at H=10.0 mm the tertiary roll is rather small. Besides, the tertiary roll grows slightly in size and in vortex intensity with the jet Reynolds number. At the larger jet-to-disk separation distance for H=20.0 mm the growth of the tertiary roll with Rej is slightly larger, as evident from the results in Fig. 3.2(a). Moreover, the
tertiary roll becomes smaller and weaker for an increase in Ra.
3.2 Onset of inertia- and buoyancy-driven vortex flow
The understanding of the critical condition for the appearance of the inertia- and buoyancy-driven vortex rolls in the chamber is of fundamental interest in the fluid flow study. Here we investigate the onset of the inertia-driven rolls by visualizating the flow in the processing chamber at various jet Reynolds numbers for an unheated disk (Ra=0). Note that the lowest jet flow rate which can be accurately resolved in the
present experimental apparatus is 0.1 slpm. Even at this small Qj the primary
inertia-driven roll is already seen in the chamber for all H with the jet issued from the small injection pipe (Dj=10.0 mm). For the large injection pipe (Dj=22.1 mm) the
critical Rej for the onset of the primary inertia-driven roll is somewhat higher and thus
can be located here. The present data are summarized in Table 3.1 for the onset of the primary and secondary inertia-driven rolls at various jet-to-disk separation distances. The results suggest that as the jet Reynolds number exceeds certain low level the primary inertia-driven roll appears. The secondary inertia-driven roll is initiated at somewhat higher jet Reynolds numbers (Table 3.1). Some inertia-driven rolls at slightly supercritical Rej are shown in Fig. 3.3 for the jet-to-disk separation distance
fixed at 20.0 mm. The results manifest that the primary inertia-driven roll is much smaller and weaker for the large injection pipe (Figs. 3.3 (c) & (d)). More specifically, for Dj=10.0 and 22.1 mm the primary inertia-driven roll respectively appears at
Rej=13.6 and 15. Note that at the low Rej near the critical level the roll is relatively
small and appears near the exit of the injection pipe (Figs. 3.3 (a) & (d)). It should be mentioned that for an unheated disk an outer roll also appears in the duct (Figs. 3.3 (a) & (b)). This roll is formed by the deflection of the wall-jet flow along the disk by the chamber side. At a higher Rej this outer roll is smaller and weaker (Fig. 3.3(b)) due to
the radial thickening of the boundary layer flow along the disk and the deflection of the flow at the chamber side is milder. It has nothing to do with buoyancy effect since Ra=0. Besides, the onset conditions of the tertiary inertia-driven roll are also given in the table. It is of interest to note that at a smaller jet-to-disk separation distance the primary inertia-driven roll is induced at a slightly higher jet Reynolds number, as evident from comparing the results in Figs. 3.4 and 3.5.
The results summarized in Table 3.1 indicate that at given Dj the critical jet
rolls increase when the jet-to-disk separation distance is reduced from 20.0 mm to 10.0 mm. However, it is of interest to note that the critical Rej does not experience any
change when H is reduced from 30.0 to 20.0 mm for the primary and tertiary rolls. The increase of the critical Rej at decreasing H is conjectured to mainly result from
the more significant retarding of the jet by the disk at a smaller H, which in turn yields a higher viscous damping effect on the impinging jet and a higher Rej is needed to
induce the flow recirculations.
As we continue to increase the jet Reynolds number slightly beyond the critical Rej for the onset of the tertiary roll, the flow in the processing chamber does not reach
any steady state at long time. Instead, the flow becomes time dependent and experiences a transition from steady to unsteady states. Obviously, this transition is driven by the jet inertia since ΔT=0 and no buoyancy-driven rolls appear. The present data for the inertia driven steady-to-unsteady transition are summarized in Table 3.2 for Dj=10.0 mm. The results indicate that the critical Rej for this flow transition
increases when the jet-to-disk separation distance is shortened, similar to those for the onset of the inertia-driven rolls. It is of interest to note that the critical Rej for this
steady-unsteady transition increases with Ra at given H. The above results suggest that the time-dependent flow induced by the jet inertia can be stabilized by increasing the Rayleigh number Ra at H≦20.0 mm. However, for H=30.0 mm an opposite trend is noted. This is due to the fact that at the longest H (=30.0 mm) tested here the radial extent of the buoyancy-driven roll is so large and it directly contacts with the primary inertia-driven roll. As Rej gradually increases, both the primary inertia-driven and
buoyancy-driven rolls squeeze each other resulting in time-dependent flow.
When the disk is heated, our flow visualization further shows that for given Dj,
ΔT and H the buoyancy-driven roll begins to appear in the region near the heated disk edge as Rej is below certain critical level for a given Ra. This critical condition is
considered to be reached as long as we can barely see the buoyancy-driven roll in the video films recording the images of the vortex rolls. This is exemplified in Fig. 3.6. Moreover, Table 3.3 summarizes the critical condition for the onset of the buoyancy-driven roll based on the present data. The data indicate that for given Dj and
H the critical Rej for the onset of the buoyancy driven roll is higher for a higher Gr. It
should be mentioned that how the onset condition of the buoyancy roll is affected by the jet-to-disk separation distance is reflected in the Grashof number since Gr is proportional to H3. Note that the critical buoyancy-to-inertia ratio Gr/Rej2 for the
onset of the buoyancy roll is nearly constant for a given Dj, irrespective of the
jet-to-disk separation distance. For Dj=10.0 and 22.1 mm the critical ratio Gr/Rej2 is
nearly equal to 0.0045 and 0.021, respectively. It is also noted that the onset of the buoyancy-driven roll occurs when the wall-jet flow in the radial direction is reversed by the upward buoyancy associated with the heated disk and hence the onset should be mainly determined by the local flow condition characterized by the local Reynolds number of the wall-jet flow Rew and the Grashof number Gr. Besides, the onset is
most likely to take place near the outer edge of the disk. Therefore, the onset condition is expected to depend primarily on the local buoyancy-to-inertia ratio Gr/Rew2. The data given in Table 3.3 do show that the buoyancy roll begins to appear
when the local buoyancy-to-inertia ratio at the edge of the disk Gr/Rewe2 is around
33.0 with the deviations within the experimental uncertainty for all Dj and H
considered.
3.3 Effects of jet Reynolds number
How the Reynolds number of the impinging jet affects the gas flow pattern at long time in the processing chamber is demonstrated in Figs. 3.7-3.12 by presenting the steady side view flow photos for the cross plane θ=0° & 180° for selected Ra at
various jet Reynolds numbers for two injection pipes with the jet-to-disk separation distance H=20.0 mm. As the disk is unheated, apparently the primary and secondary inertia-driven rolls are dominated by the jet flowrate for a fixed H (Fig. 3.7). The secondary inertia-driven roll first appears in the processing chamber when Rej
approximately exceeds 180 for Dj=10.0 mm and 220 for Dj=22.1 mm. The
inertia-driven rolls grow in size and intensity and its center moves radially outward at increasing Rej. It should be mentioned that for an unheated disk an outer roll also
appears in the chamber, as mentioned earlier (Fig. 3.7). This roll results from the deflection of the wall-jet flow along the disk by the chamber side. At a higher Rej this
outer roll is smaller due to the radial thickening of the boundary layer flow along the disk and the deflection of the flow at the chamber side is milder. It is nothing to do with the buoyancy effect since Ra=0. When the disk is heated with ΔT=5.0℃ (Ra=3,760), the results in Fig. 3.8(a) for the small injection pipe indicate that at this low buoyancy the gas flow in the chamber is still dominated by the three circular vortex rolls as the typical flow pattern shown in Fig. 3.1. We further note from Fig. 3.8(a) that at increasing Reynolds number the primary and secondary inertia-driven rolls grow in size and intensity with the accompanying decay of the buoyancy-driven roll. Similar trend is noted in Figs. 3.9-3.12 for the high buoyancies. In general, the stronger forced flow for a higher Rej suppresses the buoyancy effects. Besides, the
results clearly show that at higher Rej(≧406) the secondary inertia-driven roll can be
large enough to merge with the buoyancy-driven roll for the small injection pipe (Figs. 3.9(a)-3.12(a)). The gas flow in the chamber then is dominated by two large circular vortex rolls. Additionally, it is important to note from the results in Figs. 3.7(b) and 3.8(b) that for the large injection pipe even at Rej≧245 the secondary inertia-driven
roll disappears as Ra increases from 0 to 3,760 and higher, so we only have two circular vortex rolls in the chamber. Besides, the primary inertia-driven roll for the
large injection pipe is much weaker than that for the small injection pipe. It is also interesting to note that at the higher Ra the size of the primary inertia-driven roll changes insignificantly with the jet Reynolds number (Figs. 3.10-3.12).
It is of interest to investigate the effects of the jet Reynolds number on the vortex flow patterns in the processing chamber for a shorter jet-to-disk separation distance. This is shown in Figs. 3.13-3.17 for H=15.0 mm. These results, qualitatively similar to those for the larger H given in Figs. 3.7-3.12, indicate that for H=15.0 mm we still have three circular rolls in the chamber for the higher Rej. The inertia-driven
rolls also increase in size and intensity at increasing Rej except at high Ra (Fig. 3.17).
The secondary inertia-driven roll is seen in the processing chamber at Rej≧270 for
Dj=10.0 mm and at Rej≧306 for Dj=22.1 mm (Fig. 3.13) when the disk is unheated. A
close inspection of the results in Figs. 3.7-3.17 does reveal some differences in the vortex flow patterns for the change in the jet-to-disk separation distances. Besides, the inertia and buoyancy-driven rolls are much smaller for the smaller H and the merging of the secondary inertia-driven roll and buoyancy-driven roll does not occur even at the highest Ra considered here. The corresponding top view flow photos for several selected cases shown in Figs. 3.18-3.21 for H=15.0 mm clearly demonstrate the circular nature of the vortex rolls for the lower Ra.
For completeness, the long time vortex flow patterns in the processing chamber are presented in Figs. 3.22-3.30 for various Rej for the smallest jet-to-disk separation
distance considered here with H=10.0 mm. Similar trends are again noted. But at this smallest H no secondary inertia-driven roll is induced even for Rej=306 for the large
injection pipe. It is important to note that at this H (=10.0 mm) the buoyancy-driven vortex flow is somewhat different especially at low Rej. More specifically, at the high
buoyancy-to-inertia ratio for the small Rej the steady buoyancy-driven vortex flow