368
Feeding Habits of the Pantropical Spotted Dolphin, Stenella attenuata,
off the Eastern Coast of Taiwan
Ming-Chih Wang1, William A. Walker2, Kwang-Tsao Shao3and Lien-Siang Chou1,*
1Department of Zoology, National Taiwan University, Taipei, Taiwan 106, R.O.C.
2National Marine Mammal Laboratory, Alaska Fisheries Science Center, National Marine Fisheries Service, NOAA, Seattle, WA, USA 3Institute of Zoology, Academia Sinica, Taipei, Taiwan 115, R.O.C.
(Accepted January 19, 2003)
Ming-Chih Wang, William A. Walker, Kwang-Tsao Shao and Lien-Siang Chou (2003) Feeding habits of the
pantropical spotted dolphin, Stenella attenuata, off the Eastern coast of Taiwan. Zoological Studies 42(2): 368-378. Stomach contents were analyzed from 45 pantropical spotted dolphins, Stenella attenuata, confiscated by Taiwan police and as by-catches by in fisheries off eastern Taiwan from February 1994 to November 1995. Mesopelagic prey species dominated the stomach contents. Sixty-four species of fish made up 67.5% and 21 species of cephalopods made up 32.5% by number. Myctophid lanternfishes and enoploteuthid squid account-ed for 78.3% of all prey consumaccount-ed. The enoploteuthid squid, Enoploteuthis chunii, was the primary prey and represented 25.8% by number of the total prey, with an overall occurrence of 66.7%. Results of this study are generally similar to those at earlier food habits studies conducted on this species in the eastern tropical Pacific. In both regions, the ratio of fish and cephalopods consumed and the trophic levels of the dominant prey were similar. Stenella attenuata in the eastern tropical Pacific and off the eastern coast of Taiwan are feeding primar-ily on myctophid lanternfishes and species of the cephalopod families Enoploteuthidae and Ommastrephidae. The ANOSIM analysis demonstrated a significant difference in prey composition by season. The most numeri-cally abundant prey species, Enoploteuthis chunii, play an important role in the observed seasonal differences, which contributed 16.8% to the average dissimilarity between fall-winter and spring-summer.
http://www.sinica.edu.tw/zool/zoolstud/42.2/368.pdf
Key words: Enoploteuthis chunii, Myctophum asperum, Lanternfish, Otolith, Squid beak.
C
etaceans are exceptional divers and can be excellent collectors of fish and cephalopods (Clarke et al. 1980, Clarke 1986a b).Studies on the diets of cetaceans can contribute to the infor-mation on predator-prey relationships in the marine food web ecosystem. Information on prey distribution and habitat can further provide new insights on cetacean distribution, movements, feeding behavior, and trophic relationships. In addition, dietary studies of cetaceans can extend our knowledge of prey species distribution, life his-tory and habitat of the fish and cephalopods they consume (Clarke 1986a, Walker 1996, Silva 1999).Pantropical spotted dolphins, Stenella
attenu-ata, inhabit tropical and warm temperate waters of
the world and are one of the most common cetaceans along the eastern Taiwanese coast (Yeh 2000, Chen 2001). Food habits studies of S.
attenuata have been conducted in other regions of
the North Pacific Ocean. These previous studies on the stomach contents of this species reported high number of mesopelagic lanternfish of the family Myctophidae (Fitch et al. 1968, Perrin et al. 1973). However, epipelagic prey was also found to be important and included species of the fami-lies Ommastrephidae (flying squid), Onychoteu-thidae (hooked squid), and Exocoetidae (flying fish) (Shomura et al. 1965, Fitch et al. 1968, Perrin et al. 1973, Bernard et al. 1989, Robertson et al. 1997). A recent report on the stomach contents of spotted dolphins caught in the eastern tropical
368
*To whom correspondence and reprint requests should be addressed. Tel: 886-2-23661331. Fax: 886-2-23639902. E-mail: chouls@ccms.ntu.edu.tw
Pacific (ETP) showed that the most common prey fish were lanternfishes (Myctophidae), and the most frequently occurring cephalopods were species of the family Ommastrephidae (Robertson et al. 1997).
Information on feeding habits of S. attenuata is lacking in the waters of Taiwan. In this paper, we present a quantitative description of the diet. The relative importance of prey species is assessed through the frequency of occurrence, as well as numerical and biomass indices. Prey size of some of the commonly ingested species is esti-mated from measurements of otoliths and squid beaks recovered from the stomach contents. Seasonal variability of prey species is also ana-lyzed.
MATERIALS AND METHODS Sample collection
In total 45 stomach samples were collected from pantropical spotted dolphins confiscated by Taiwan police for being sold illegally and as by-catch specimens at the port of Nanfanao, Ilan County, Taiwan (24
°
25'N, 121°
50'E), from Feb. 1994 through Nov. 1995. Those pantropical spot-ted dolphin specimens were all from local fisheries. Stomachs were tied off at the esophageal and pyloric ends prior to being removed intact from the animal at the port. Each stomach was tagged with an individual specimen number and placed in frozen storage. Data recorded on each individual cetacean collected included length and sex. Stomachs were thawed overnight at room temper-ature prior to preliminary sorting and content preservation. The stomach of each specimen was weighed in both its full and empty condition to the nearest 0.1 g.In the laboratory, stomach contents were carefully removed, separated into identifiable com-ponents, and drained of excess fluid. The stom-ach lining was then thoroughly rinsed into a shal-low tray and the residual run through a series of sieves of 1.4-mm, 0.5-mm, and 500-µ mesh sizes in order to recover all isolated fish otoliths, bones, and cephalopod beaks. The standard length of fish, the dorsal mantle length of cephalopods, and weights were recorded for specimens that were whole or nearly whole. Otoliths and beaks were extracted from identifiable, intact specimens and saved as reference material for species identifica-tion and development of prey-size regressions. All
otoliths, key fish bones and skeletons were placed in dry storage. Key cephalopod remains and beaks were sorted and preserved in 70% ethanol.
Prey identification and enumeration
Because of rapid digestion, identification and enumeration of fish and cephalopod prey species relied almost exclusively on hard remains. Fish otoliths from known species used for comparison in this study were from the John Fitch reference collection at the Los Angeles County Museum of Natural History, Department of Ichthyology, as well as the private collections of W.A. Walker and the senior author. The minimum number of individual fish ingested was determined by the greater num-ber of left or right otoliths.
Cephalopod beaks were identified using the private reference collection of W.A. Walker and from the illustrations and keys presented in Clarke (1986b). The maximum number of upper or lower beaks was used to estimate the minimum number of cephalopods ingested. The relative importance of prey species was evaluated by means of the fre-quency of occurrence and the percentage by num-ber (Hyslop 1980).
Estimation of prey size
Estimation of the original length and weight of the most commonly occurring prey is based on the regression of prey body length in relation to otolith or lower beak rostral length. Otolith lengths were measured to the nearest 0.01 mm using a camera (JVC TK-1270 color video camera) and image pro-cessing software (HLImage++97, 1997). The lower beak rostral length of cephalopod beaks was measured to the nearest 0.01 mm with vernier calipers or an optical micrometer. Damaged or eroded specimens were not measured.
The sizes of fish prey were estimated by regression equations of fish length and wet weight on otolith length. Standard length (SL) and weight estimates for Mytophum asperum were derived from equations developed from specimens and data maintained in the reference collection of W.A. Walker. Standard length and weight estimates for
Diaphus schmidti, D. watasei, Decapterus macro-soma, Trichiurus lepturus, and Scomber australasi-cus were derived from regression equations of
standard length on otolith length developed from specimens obtained by the senior author from local fisheries in Ilan, northeastern Taiwan. Standard length and weight of Engraulis japonicus,
S. japonicus, and Lampanyctodes hectoris were estimated by regression equations presented in Smale (1995).
Cephalopod prey size, and dorsal mantle length and weight were estimated from the lower beak rostral length. Dorsal mantle length (DML) and weight of Enoploteuthis chunii were estimated using a regression equation developed from intact specimens in stomach contents. Regression equations of the ommastrephid squid, Sthenoteuthis oualaniensis, Euleoteuthis luminosa, and the onychoteuthid squid, Onychoteuthis banksii were from Clarke (1986b).
Seasonal variation
Samples were pooled into 2 seasons: fall-win-ter (Oct.-Mar.) and spring-summer (Apr.-Sept.). Non-parametric multivariate techniques used to compare differences between the 2 seasonal biotic communities follow (Clarke 1993). The data were placed into triangular matrices based on Bray-Curtis similarities. An ANOSIM permutation test was performed to test the null hypothesis that there were no differences between seasons (Clarke et al. 1988). Another technique (Similarity Percentages, SIMPER) was used to reveal the
percentage contribution of each taxon to the aver-age dissimilarity between samples of each season. The mean contribution of each species to the dis-similarity of the 2 clusters is defined as an average over all cross-group pairs of samples. This yields an assessment of which prey species are diagnos-tic species between seasons (Clarke 1993). The computer software package PRIMER (Plymouth Routines in Multivariate Ecological Research) was used in the analysis.
RESULTS
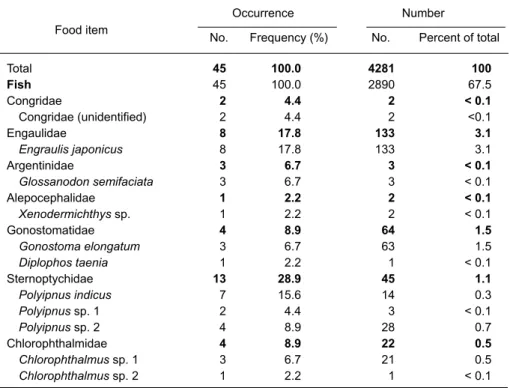
Stomach contents were from 24 female and 21 male pantropical spotted dolphins. All 45 stom-achs contained prey remains. Sixty-four species of fish and 21 species of cephalopods were identi-fied by fish otoliths, squid beaks, or undigested prey remains. Twenty-five families of fish made up 67.5% of the total number of prey items, with an overall occurrence of 100%. Thirteen families of cephalopods made up 32.5% of the total number of prey ingested, with an overall occurrence of 100% (Table 1).
There were 1 fish family, Myctophidae, and 2 cephalopod families, Enoploteuthidae and
No. Frequency (%) No. Percent of total
Table 1. Frequency of occurrence and number of prey recovered from
pantropical spotted dolphins, Stenella attenuata, (n = 45) from the eastern waters of Taiwan Occurrence Number Total 45 100.0 4281 100 Fish 45 100.0 2890 67.5 Congridae 2 4.4 2 < 0.1 Congridae (unidentified) 2 4.4 2 <0.1 Engaulidae 8 17.8 133 3.1 Engraulis japonicus 8 17.8 133 3.1 Argentinidae 3 6.7 3 < 0.1 Glossanodon semifaciata 3 6.7 3 < 0.1 Alepocephalidae 1 2.2 2 < 0.1 Xenodermichthys sp. 1 2.2 2 < 0.1 Gonostomatidae 4 8.9 64 1.5 Gonostoma elongatum 3 6.7 63 1.5 Diplophos taenia 1 2.2 1 < 0.1 Sternoptychidae 13 28.9 45 1.1 Polyipnus indicus 7 15.6 14 0.3 Polyipnus sp. 1 2 4.4 3 < 0.1 Polyipnus sp. 2 4 8.9 28 0.7 Chlorophthalmidae 4 8.9 22 0.5 Chlorophthalmus sp. 1 3 6.7 21 0.5 Chlorophthalmus sp. 2 1 2.2 1 < 0.1 Food item
No. Frequency (%) No. Percent of total Occurrence Number Paralepididae 8 17.8 12 0.3 Lestidiops similis 1 2.2 2 < 0.1 Lestrolepis intermedia 6 13.3 8 0.2 Paralepis sp. 2 4.4 2 < 0.1 Notosudidae 1 2.2 11 0.3 Notosudidae (unidentified) 1 2.2 11 0.3 Myctophidae 37 82.2 2131 49.3 Benthosema fibulatum 2 4.4 4 < 0.1 Benthosema panamense 1 2.2 1 < 0.1 Ceratoscopelus warmingii 4 8.9 11 0.3 Diaphus jenseni 2 4.4 3 < 0.1 Diaphus mollis 4 8.9 7 0.2 Diaphus schmidti 21 46.7 564 13.2 Diaphus sp. 1 1 2.2 1 < 0.1 Diaphus sp. 2 1 2.2 2 < 0.1 Diaphus sp. 3 4 8.9 100 2.3 Diaphus sp. 4 2 4.4 2 < 0.1 Diaphus sp. 5 2 4.4 10 0.2 Diaphus watasei 13 28.9 203 4.7 Lampadena luminosa 1 2.2 2 < 0.1 Lampanyctodes hectoris 5 11.1 103 2.4 Lampanyctodes sp. 1 2.2 1 < 0.1 Lampanyctus australis 2 4.4 3 < 0.1 Lampanyctus sp. 1 5 11.1 66 1.5 Lampanyctus sp. 2 4 8.9 25 0.6 Myctophum asperum 19 42.2 871 20.3 Myctophum aurolaternatum 20 44.4 65 1.5 Myctophum nitidulum 5 11.1 9 0.2 Myctophum obtusirostre 7 15.6 24 0.6 Myctophum sp. 1 7 15.6 22 0.5 Myctophum sp. 2 2 4.4 14 0.3 Myctophum sp. 3 1 2.2 1 < 0.1 Myctophum spinosum 1 2.2 5 0.1 Symbolophorus evermanni 5 11.1 6 0.1 Myctophidae (unidentified) 5 11.1 6 0.1 Bregmacerotidae 3 6.7 33 0.8 Bregmaceros nectabanus 3 6.7 33 0.8 Exocoetidae 3 6.7 6 0.1 Exocoetidae (unidentified) 3 6.7 6 0.1 Belonidae 3 6.7 3 < 0.1
Tylosurus acus melanotus 3 6.7 3 < 0.1
Percichthyidae 3 6.7 9 0.2 Synagrops japonicus 3 6.7 9 0.2 Acropomatidae 1 2.2 2 < 0.1 Malakichthys elegans 1 2.2 2 < 0.1 Serranidae 1 2.2 1 < 0.1 Serranidae (unidentified) 1 2.2 1 < 0.1 Priacanthidae 4 8.9 17 0.4 Priacanthus macracanthus 4 8.9 17 0.4 Apogonidae 3 6.7 19 0.4 Apogon carinatus 3 6.7 19 0.4 Carangidae 10 22.2 105 2.5 Decapterus macrosoma 8 17.8 86 2.0 Decapterus maruadsi 3 6.7 6 0.1 Food item Table 1. (Cont.)
No. Frequency (%) No. Percent of total Occurrence Number Decapterus russelli 5 11.1 8 0.2 Decapterus sp. 1 2.2 1 < 0.1 Carangidae (unidentified) 1 2.2 4 < 0.1 Gempylidae 10 22.2 59 1.4 Rexea prometheoides 10 22.2 59 1.4 Trichiuridae 5 11.1 125 2.9 Trichiurus lepturus 5 11.1 125 2.9 Scombridae 13 28.9 50 1.2 Auxis thazard 1 2.2 1 < 0.1 Scomber australasicus 10 22.2 32 0.7 Scomber japonicus 6 13.3 17 0.4 Stromateidae 1 2.2 2 < 0.1 Pampus argenteus 1 2.2 2 < 0.1 Tetraodontidae 4 8.9 34 0.8 Lagocephalus sp. 1 2.2 1 < 0.1 Tetraodontidae (unidentified) 3 6.7 33 0.8 Cephalopods 45 100.0 1391 32.5 Loliginidae 8 17.8 20 0.5 Loligo sp. 8 17.8 20 0.5 Lycoteuthidae 6 13.3 11 0.3 Lycoteuthis sp. 1 2 4.4 4 < 0.1 Lycoteuthis sp. 2 2 4.4 5 0.1 Selenoteuthis sp. 2 4.4 2 < 0.1 Enoploteuthidae 37 82.2 1243 29.0 Enoploteuthis chunii 30 66.7 1103 25.8 Abraliopsis lineata 20 44.4 140 3.3 Octopoteuthidae 1 2.2 1 < 0.1 Octopoteuthis sp. cf. O. deletron 1 2.2 1 < 0.1 Onychoteuthidae 8 17.8 23 0.5 Onychoteuthis banksii 8 17.8 23 0.5 Pholidoteuthidae 2 4.4 2 < 0.1 Pholidoteuthis sp. cf. P. boschmai 2 4.4 2 < 0.1 Histioteuthidae 3 6.7 4 < 0.1 Histioteuthis miranda 2 4.4 3 < 0.1 Histioteuthis sp. 1 2.2 1 < 0.1 Chtenopterygidae 1 2.2 1 < 0.1 Chtenopteryx sp. cf. C. sicula 1 2.2 1 < 0.1 Ommastrephidae 28 62.2 80 1.9 Sthenoteuthis oualaniensis 9 20.0 23 0.5 Eucleoteuthis luminosa 16 35.6 47 1.1 Ornithoteuthis volatilus 5 11.1 8 0.2 Ommastrephidae (unidentified) 2 4.4 2 < 0.1 Thysanoteuthidae 1 2.2 1 < 0.1 Thysanoteuthis rhombus 1 2.2 1 < 0.1 Mastigoteuthidae 2 4.4 2 < 0.1 Mastigoteuthis sp. 2 4.4 2 < 0.1 Cranchiidae 2 4.4 2 < 0.1 Galiteuthis sp. cf. G. armata 1 2.2 1 < 0.1 Galiteuthis sp. cf. G. pacifica 1 2.2 1 < 0.1 Tremoctopodidae 1 2.2 1 < 0.1 Tremoctopus violaceus 1 2.2 1 < 0.1
“Frequency of occurrence”, the number of stomachs in which that species was found;“Number”, the total number of times a species was recovered from all stomachs.
Table 1. (Cont.)
Ommastrephidae, found in more than 60% of the stomachs examined. The enoploteuthid squid, Enoploteuthis chunii, was the primary prey and represented 25.8% of the total, with an overall occurrence of 66.7%. The lanternfish, Myctophum asperum, ranked second and made up 20.3% of the total number of prey ingested, with an overall occurrence of 42.2%. Another lanternfish, Diaphus schmidti, was the third most abundant prey item representing 13.2% of the total, with an
occurrence of 46.7% by number.
Twenty-eight of the prey species belonging to the lanternfish family Myctophidae made up 49.3% of the total prey and occurred in 82.2% of the stomachs examined. Two species of the family Enoploteuthidae were the dominant cephalopods ingested and represented 29.0% of the total with an overall frequency of occurrence of 82.2% of the stomachs (Table 1).
Table 2. Regression equation, and information used in estimating standard length
and weight for the 13 major species in the diet of pantropical spotted dolphin from the eastern waters of Taiwan
Species Regression equation r2 n Reference
Fish
Myctophum asperum y = 5.3621 + 18.8036 x 0.931 56 This study
Diaphus schmidti y = -17.1602 + 23.8106 x 0.940 13 This study
Diaphus watasei y = -15.4378 + 22.0426 x 0.952 9 This study
Engraulis japonicus ln y = 3.4527 + 0.9812 ln x 0.939 168 Smale et al. 1995
Trichiurus lepturus y = 65.8751 + 120.5387 x 0.933 8 This study
Decaptuerus macrosoma y = - 42.451 + 47.561 x 0.934 12 This study
Scomber australasicus y = -275.3961 + 118.0851 x 0.977 6 This study
Scomber japonicus ln y = 3.6437 + 1.2317 ln x 0.968 163 Smale et al. 1995
Lampanyctodes hectoris ln y =2.9403 + 1.3463 ln x 0.900 103 Smale et al. 1995 Cephalopods
Enoploteuthis chunii y = 3.520 + 17.942 x 0.986 48 This study
Sthenoteuthis oualaniensis y = 6.98 + 39.25 x Clarke 1986b
Euleoteuthis luminosa y = 11.12 + 37.61 x Clarke 1986b
Onychoteuthis banksii y = -28.9 + 61.0 x Clarke 1986b “x”, standard length or dorsal mantle length;“y”, otolith length or lower rostral length.
Table 3. Information on the length-weight relationships [weight = a(length)b] used to
estimate the weight for the 13 major species in the diet of the pantropical spotted dolphin from the eastern waters of Taiwan
Species Regression equation r2 n Reference
Fish
Myctophum asperum ln w = -0.9400 + 2.2311 ln x 0.923 56 This study
Diaphus schmidti ln w = -3.2705 + 3.7548 ln x 0.908 13 This study
Diaphus watasei ln w = -2.6190 + 3.0922 ln x 0.931 9 This study
Engraulis japonicus ln w = -1.0158 + 2.8541 ln x 0.937 168 Smale et al. 1995
Trichiurus lepturus ln w = -0.0699 + 2.9280 ln x 0.920 8 This study
Decaptuerus macrosoma ln w = -1.485 + 3.758 ln x 0.878 12 This study
Scomber australasicus ln w = -2.9787 + 5.624 ln x 0.944 6 This study
Scomber japonicus ln w = -0.7220 + 4.0055 ln x 0.958 163 Smale et al. 1995
Lampanyctodes hectoris ln w = -2.5907 + 4.2197 ln x 0.878 97 Smale et al. 1995 Cephalopods
Enoploteuthis chunii ln w = -0.196 + 5.985 ln x 0.982 48 This study
Sthenoteuthis oualaniensis ln w = 0.892 + 3.0 ln x Clarke 1986b
Euleoteuthis luminosa ln w = 0.718 + 2.75 ln x Clarke 1986b
Onychoteuthis banksii ln w = 0.58 + 3.70 ln x Clarke 1986b “w”, the weight;“x”, the otolith length or lower rostral length.
Estimation of prey size
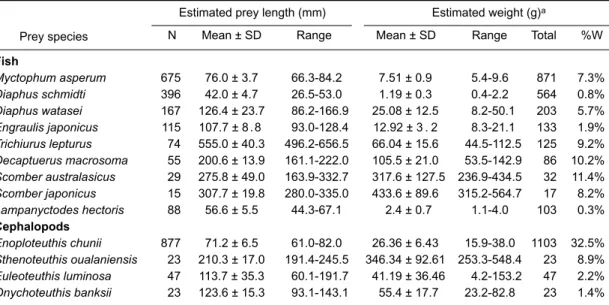
Reliable regression equations were available for only 9 fish species and 4 cephalopod prey species identified in this study (Tables 2, 3). These 13 prey species made up 77.8% of the total number of prey consumed. The estimated length of the prey species ranged from 26.5 to 656.5 mm and the weight of the prey species ranged from 0.4 to 564.7 g (Table 4).
The most abundant fish prey species, M. asperum, ranged in size from 66.3 to 84.2 mm standard length with a mean length of 76.0 mm (SD, ± 3.7). The second abundant fish species, Diaphus schmidti, ranged from 26.5 to 53.0 mm standard length with a mean length of 42.0 mm (SD, ± 4.7). The reported maximum dorsal mantle length of Enoploteuthis chunii is 100 mm (Young et al. 1986). Estimated dorsal mantle lengths for this species in the stomach contents ranged from 61.0 to 82.0 mm with a mean length of 71.2 mm (SD, ± 6.5). Of the 13 species for which regressions were available, the longest prey ingested was the large-head hairtail, Trichiurus lepturus, which ranged from 496.2 to 656.6 mm standard length with a mean length of 555.0 mm and weight of 66.0 g. The largest prey species in terms of unit mass was the mackerel, Scomber japonicus, which had a
mean standard length of 307.7 mm (SD, ± 19.8) and mean weight of 433.6 g (SD, ± 89.6).
Seasonal variation
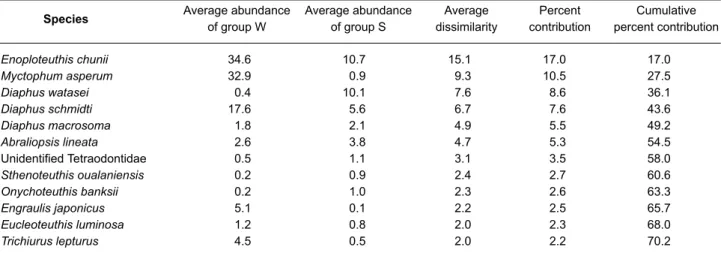
A total, eighty-five taxa were identified in the stomach contents. The data matrices were stan-dardized and analyzed by ANOSIM test, which demonstrated a significant difference (R = 0.15, p < 0.01) in similarities of samples between the 2 seasons, fall-winter and spring-summer. The SIM-PER analysis identified 12 prey species that con-tributed to greater than 70% of the dissimilarity between the 2 seasons. These included 5 cephalopod species, Enoploteuthis chunii , Sthenoteuthis oualaniensis, Eucleoteuthis lumi-nosa, Abraliopsis lineata, Onychoteuthis banksii, and 7 fish species, Myctophum asperum, Diaphus watasei, Diaphus schmidti, Decapterus macroso-ma, an unidentified Tetraodontidae, Engraulis japonicus, and Trichiurus lepturus (Table 5). Enoploteuthis chunii ranked first and contributed 16.8% to the average dissimilarity. Comparing the average abundance by number between the 2 seasons, fall-winter and spring-summer, it is evi-dent that the predominant prey species by number changed seasonally.
Table 4. Mean, standard deviation, and range of prey length (standard length in fish and
dorsal mantle length in cephalopods) and weight of prey species consumed by the pantropi-cal spotted dolphin, pantropi-calculated with regression equations of otolith length or lower rostral length to prey length and weight
N Mean ± SD Range Mean ± SD Range Total %W
Estimated prey length (mm) Estimated weight (g)a
Fish Myctophum asperum 675 76.0 ± 3.7 66.3-84.2 7.51 ± 0.9 5.4-9.6 871 7.3% Diaphus schmidti 396 42.0 ± 4.7 26.5-53.0 1.19 ± 0.3 0.4-2.2 564 0.8% Diaphus watasei 167 126.4 ± 23.7 86.2-166.9 25.08 ± 12.5 8.2-50.1 203 5.7% Engraulis japonicus 115 107.7 ± 8 . 8 93.0-128.4 12.92 ± 3 . 2 8.3-21.1 133 1.9% Trichiurus lepturus 74 555.0 ± 40.3 496.2-656.5 66.04 ± 15.6 44.5-112.5 125 9.2% Decaptuerus macrosoma 55 200.6 ± 13.9 161.1-222.0 105.5 ± 21.0 53.5-142.9 86 10.2% Scomber australasicus 29 275.8 ± 49.0 163.9-332.7 317.6 ± 127.5 236.9-434.5 32 11.4% Scomber japonicus 15 307.7 ± 19.8 280.0-335.0 433.6 ± 89.6 315.2-564.7 17 8.2% Lampanyctodes hectoris 88 56.6 ± 5.5 44.3-67.1 2.4 ± 0.7 1.1-4.0 103 0.3% Cephalopods Enoploteuthis chunii 877 71.2 ± 6.5 61.0-82.0 26.36 ± 6.43 15.9-38.0 1103 32.5% Sthenoteuthis oualaniensis 23 210.3 ± 17.0 191.4-245.5 346.34 ± 92.61 253.3-548.4 23 8.9% Euleoteuthis luminosa 47 113.7 ± 35.3 60.1-191.7 41.19 ± 36.46 4.2-153.2 47 2.2% Onychoteuthis banksii 23 123.6 ± 15.3 93.1-143.1 55.4 ± 17.7 23.2-82.8 23 1.4% Prey species
aThe percentage of the total contribution by weight for a given species is based only the total contribution by weight
of these 13 species.
DISCUSSION
Our samples demonstrate that pantropical spotted dolphins eat a wide variety of fish and cephalopod prey. The 64 species of fish made up 67.5%, and 21 species of cephalopods made up 32.5% of the total number of prey ingested. Of these, mesopelagic prey were the primary species represented in the samples. Myctophid lantern-fishes and enoploteuthid squid accounted for 78.3% of all prey consumed. Although regional faunal differences in prey species composition may be expected, our results are generally similar to the findings of Robertson and Chivers (1997) for this dolphin in the eastern tropical Pacific (ETP). In the ETP region, they also found that the percent by number of fish (66.6%) was higher than that for cephalopods (32.6%). There were also similarities in the prey consumed in that myctophid lantern-fishes and species of the cephalopod families Enoploteuthidae and Ommastrephidae were domi-nant in their stomach samples.
Species of myctophid fish and enoploteuthid squid are most abundant in the mesopelagic zone. Squid of the family Enoploteuthidae demonstrate a number of characteristic features that may facili-tate their being preyed upon by cetaceans, in that they typically have elaborate luminescent organs, are small in size, school in large numbers, and are diel vertical migrators (Clarke 1986b). The fre-quency of distribution of prey size collected or esti-mated from dolphin stomachs could shed light on the age structure of prey species consumed
through this particular food chain, but also could reveal the foraging diurnal patterns. Many cephalopods are well known as diel vertical migra-tors. However, some variations in diel vertical migrating patterns have been demonstrated between adult and larval growth stages. Enoploteuthid larval squids are most abundant at depths of 100-150 m during the day, and at 30-50 m at night (Young et al. 1986). Adults occur at depths of 300-600 m during the day, migrating to the upper 150 m at night (Roper et al. 1975). Females of enoploteuthid squid are typically mature at about 50 mm dorsal mantle length (Kubota et al. 1982, Riddell 1982). Estimated dor-sal mantle length for E. chunii in our stomach sam-ples ranged from 61.0 to 82.0 mm which suggests that pantropical spotted dolphins off eastern Taiwan were feeding on adult E. chunii. The adult enoploteuthids migrated to shallower water layers in the evening, which caused them to be good can-didates for food items. Our results indicated that our spotted dolphins may forage for squid at night at depths beyond upper 150 m. In the coastal waters of Taiwan, E. chunii has been previously reported from the stomach of 1 Cuvier,s beaked whale beach stranded in northwestern Taiwan at Houlong, Miaoli County (Wang et al. 1995) Wang et al. (2003) also found that dwarf sperm whales and pygmy sperm whales primarily fed on E. chunii. These evidence shows that E. chunii may be an important food resource in Taiwanese waters.
Myctophid fishes are also very abundant in
Average abundance of group S Average dissimilarity Percent contribution Cumulative percent contribution Table 5. Average abundance of important prey species in groups W (fall-winter) and S (spring-summer) in
the stomach contents of the pantropical spotted dolphin listed in order of their contribution to the average dissimilarity between the 2 groups, with a cut off when the cumulative percent contribution to average dis-similarity reaches 70%
Species Average abundance
of group W Enoploteuthis chunii 34.6 10.7 15.1 17.0 17.0 Myctophum asperum 32.9 0.9 9.3 10.5 27.5 Diaphus watasei 0.4 10.1 7.6 8.6 36.1 Diaphus schmidti 17.6 5.6 6.7 7.6 43.6 Diaphus macrosoma 1.8 2.1 4.9 5.5 49.2 Abraliopsis lineata 2.6 3.8 4.7 5.3 54.5 Unidentified Tetraodontidae 0.5 1.1 3.1 3.5 58.0 Sthenoteuthis oualaniensis 0.2 0.9 2.4 2.7 60.6 Onychoteuthis banksii 0.2 1.0 2.3 2.6 63.3 Engraulis japonicus 5.1 0.1 2.2 2.5 65.7 Eucleoteuthis luminosa 1.2 0.8 2.0 2.3 68.0 Trichiurus lepturus 4.5 0.5 2.0 2.2 70.2
the mesopelagic zone, representing 25% of the biomass of all mesopelagic fishes (Karnella 1987, Tzeng 1989). Most myctophid species found in our study are known to undergo diel vertical migra-tions and are at depths of 200-700 m during the daytime and ascend to 0-200 m during the night-time (Kawaguchi 1974). Myctophid fishes are also small in size and have elaborate photogenic light organs.
These mesopelagic prey species are associ-ated with the deep scattering layer and most undergo diel vertical migrations, moving into the surface layer at dusk to feed and retreating to depths at dawn to avoid predation (Roper et al. 1975, Mccrone 1981, Karnella 1987, Sogard et al. 1987, Tzeng 1989, Chiu 1991). Pantropical spot-ted dolphin may primarily feed at night and may occur in layers shallower than 200 m as reported in another study (Baird et al. 2001).
In Hawaii S. attenuata is reported to feed pri-marily on diurnally migrating myctophid fish as well as enoploteuthid and ommastrephid cephalopods (Shomura et al. 1965, Clarke 1998). Recent stud-ies using time-depth recorder-tagged S. attenuata in Hawaii have revealed a marked increase in dive activity after dark suggesting that spotted dolphins in this region feed primarily at night (Baird et al. 2001). Robertson and Chivers (1997) used the stomach fullness index (SFI) technique of Bernard and Hohn (1989) to analyze their spotted dolphin stomach samples from the ETP. In this region they found that the SFI was highest in the morning hours (0600-0900), suggesting that pantropical spotted dolphin fed during the night when their prey are nearest the surface.
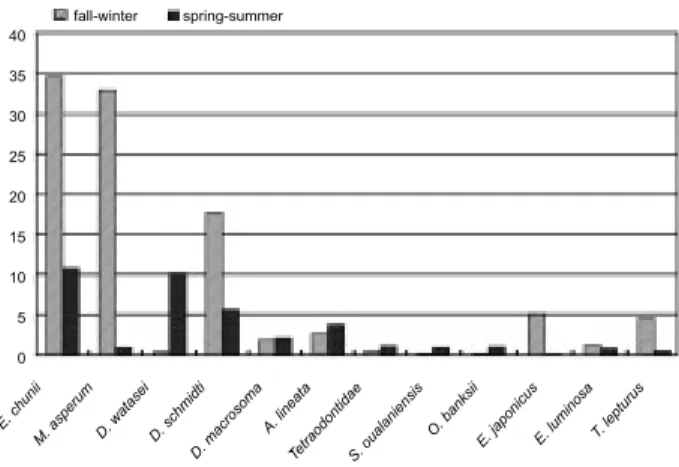
The average abundance of some commercial fish found in the samples of dolphin stomachs from Taiwan correspond with the fisheries production by season (Fig. 1). According to the fish landing records of 1994-1995 in the Fisheries Yearbook in Taiwan (Anon. 1995 1996), the fisheries catch of spotted chub mackerel, Scomber australasicus; chub mackerel, Scomber japonicus; and largehead hairtail, Trichiurus lepturus; is higher during fall and winter (Oct.-Mar.), while fisheries catch of shortfin scad, Decapterus macrosoma, is higher during spring and summer. The Japanese anchovy, Engraulis japonicus, migrates into the eastern waters of Taiwan to spawn during Feb. and Mar. (Shen 1971, Young et al. 1992). The purpleback flying squid, Sthenoteuthis oualaniensis, is used for bait in the longline fisheries, it migrates into the eastern waters of Taiwan, and the fisheries catch reaches its peak during May through Aug. (Dong
1981). These species had higher average abun-dance by number in the stomach contents of this cetacean during the same fishing season. This consistent phenomenon supports the pantropical spotted dolphin being an opportunistic feeder.
This conclusion is also supported by other studies on various dolphin species (Brown et al. 1965, Jones 1981, Fiscus 1982, Gaskin 1982, Ross 1984, Evans 1987, Young et al. 1994, Robertson et al. 1997). Pantropical spotted dol-phins were associated with the warmest water in the southeastern waters of Taiwan, and while they could be sighted year round (Yeh 2000), they were sighted more often in summer and fall in the north-eastern waters of Taiwan (Chen 2001). Seasonal changes in prey composition could be a result of many factors such as prey seasonal movements or migration, prey spawning seasons, or simply prey distribution. It has been suggested that dolphin movements may correspond to the movement or availability, of prey (Jones 1981, Reilly 1990, Young et al. 1994, Robertson et al. 1997, Silva 1999). The stomach contents of opportunistic feeders in different geographic regions may not only reflect the fish and cephalopod fauna (Young et al. 1994), but may also shed light on their tem-poral fluctuations in an area. Hence, in addition to providing information on predator-prey relation-ships, dietary studies of cetaceans can also be used to monitor the distribution and seasonal varia-tions of natural resources of dolphin prey species.
Acknowledgments: We gratefully acknowledge
the assistance for much the field work from the members of the Cetacean Research Laboratory,
Fig. 1. Average abundance of important prey species in fall-winter and spring-summer in the stomach contents of the pantropical spotted dolphin.
40 35 30 25 20 15 10 5 0 fall-winter spring-summer E. c huni i M. a sper um D. w atas ei D. s chm idti D. m acro som a A. l inea ta Tetra odon tidae S. o uala nien sis O. b anks ii E. j apon icus E. l umin osa T. le ptur us
Department of Zoology, National Taiwan University. We also thank R. Lavenberg for the use of the John Fitch otolith reference collection at the Los Angeles County Museum of Natural History, Department of Ichthyology. The work was supported by grants from the Council of Agriculture, Executive Yuan (83-NC-04(13), 84-ST-2.3-FC-24(02)) and the National Science Council (NSC-89-2311-B-002-090) of Taiwan.
REFERENCES
Anon. 1995. Fisheries Yearbook, Taiwan area, 1994. Taipei: Taiwan Fisheries Bureau, Department of Agriculture and Forestry, Provincial Government of Taiwan.
Anon. 1996. Fisheries Yearbook, Taiwan area, 1995. Taipei: Taiwan Fisheries Bureau, Department of Agriculture and Forestry, Provincial Government of Taiwan.
Baird RW, AD Ligon, SK Hooker, AM Gorgone. 2001. Subsurface and nighttime behaviour of pantropical spot-ted dolphins in Hawaii. Can. J. Zool. 79: 988-996. Bernard HJ, AA Hohn. 1989. Differences in feeding habits
between pregnant and lactating spotted dolphins (Stenella
attenuata). J. Mammal. 70: 211-215.
Brown DH, KS Norris. 1965. Observations of captive and wild cetaceans. J. Mammal. 37: 313-326.
Chen Y. 2001. Ecological aspects of cetaceans in Ilan waters of Taiwan: abundance, distribution, habitat partitioning,
and acoustics. Master,s thesis, Univ. of Charleston,
Charleston, SC.
Chiu TS. 1991. Diurnal depth change of ichthyoplankton in the Kuroshio edge exchange front. Acta Oceanogr. Taiwanica 26: 53-65.
Clarke KR. 1993. Non-parametric multivariate analyses of changes in community structure. Aust. J. Ecol. 18: 117-143.
Clarke KR, RH Green. 1988. Statistical design and analysis for a‘biological effects’study. Mar. Ecol. Prog. Ser. 46: 213-226.
Clarke MR. 1986a. Cephalopods in the diet of odontocetes. In MM Bryden, R Harrison, eds. Research on dolphins. New York: Oxford Science Publications, pp. 281-321. Clarke MR. 1986b. A handbook for the identification of
cephalopod beaks. Oxford, UK: Clarendon Press. Clarke MR. 1998. Description and analysis of cephalopod
beaks from stomachs of six species of odontocete cetaceans stranded on Hawaiian shores. J. Mar. Biol. Assoc. UK 78: 623-641.
Clarke MR, N MacLeod, HP Castello, MC Pinedo. 1980. Cephalopod remains from the stomach of a sperm whale stranded at Rio Grande do Sul in Brazil. Mar. Biol. 59: 235-239.
Dong Z. 1981. The present status and the prospects of cephalopod resources in the West Pacific. J. Fish. China 5: 263-270.
Evans PGH. 1987. The natural history of whales and dolphins. New York, NY: Facts on File, pp. 119-158
Fiscus CH. 1982. Predation by marine mammals on squids of the eastern North Pacific Ocean and the Bering Sea. Mar. Fish. Rev. 44: 1-10.
Fitch JE, RL Brownell. 1968. Fish otoliths in cetacean
stom-achs and their importance in interpreting feeding habits. J. Fish. Res. Bd. Can. 25: 2561-2574.
Gaskin DE. 1982. The ecology of whales and dolphins. London: Heinemann.
Hyslop EJ. 1980. Stomach contents analysis -- a review of methods and their application. J. Fish Biol. 17: 411-429. Jones RE. 1981. Food habits of smaller marine mammals from
northern California. Proc. CA Acad. Sci. 42: 409-433. Karnella C. 1987. Family Myctophidae, lanternfishes. In JRH
Gibbs, WH Krueger, eds. Biology of midwater fishes of the Bermuda Ocean acre No. 452. Washington, DC: Smithson. Contrib. Zool, pp. 51-156.
Kawaguchi K. 1974. Ecological study on the micronektonic fishes of the western North Pacific Ocean. J. Oceanogr. Soc. Jpn. 30: 23-37.
Kubota T, K Lizuka, T Okutani. 1982. Some biological aspects of Abralia andamanica from Suruga Bay, Japan (Cephalopoda: Enoploteuthidae). J. Facul. Mar. Sci. Technol., Tokai Univ. 15: 333-343.
Mccrone LE. 1981. Diel vertical migration and feeding behavior of some mesopelagic fishes in the eastern subarctic Pacific Ocean. PhD dissertation, Univ. of Washington, Seattle.
Perrin WF, RR Warner, CH Fiscus, DB Holts. 1973. Stomach contents of porpoise, Stenella spp., and yellowfin tuna,
Thunnus albacares, in mixed-species aggregations. Fish.
Bull. 71: 1077-1092.
Reilly SB. 1990. Seasonal changes in distribution and habitat differences among dolphins in the eastern tropical Pacific. Mar. Ecol. Prog. Ser. 66: 1-11.
Riddell DJ. 1982. The systematics, distribution and biology of the Enoploteuthidae (Cephalopoda: Oegopsida) in the
New Zealand region. Master,s thesis, University of
Auckland, Auckland, New Zealand.
Robertson KM, SJ Chivers. 1997. Prey occurrence in pantropi-cal spotted dolphins, Stenella attenuata from the eastern tropical Pacific. Fish. Bull. 95: 334-348.
Roper CFE, RE Young. 1975. Vertical distribution of pelagic cephalopods. Smithson. Contr. Zool. 85: 205-222. Ross GJB. 1984. The smaller cetaceans of the southeast
coast of the southern Africa. Ann. Cape Provin. Mus., Natural History 15: 173-410.
Shen SC. 1971. Preliminary report on the study of Wen-Yu resources of Taiwan. Acta Oceanogr. Taiwanica 1: 101-126.
Shomura RS, TS Hida. 1965. Stomach contents of a dolphin caught in Hawaiian waters. J. Mammal. 46: 500-501. Silva MA. 1999. Diet of common dolphin, Delphinus delphis, off
the Portuguese continental coast. J. Mar. Biol. Assoc. UK 79: 531-540.
Smale MJ, G Watson, T Hecht. 1995. Otolith atlas of Southern African marine fishes. Grahanstown, South Africa: J.L.B. Smith Institute of Icthyology.
Sogard SM, DE Hoss, JJ Govoni. 1987. Density and depth dis-tribution larval Gulf menhaden (Brevoortia patronus), Atlantic croaker (Micropoginias undulatusa) and spot (Leiostomus zanthurus) in northern Gulf of Mexico. Fish. Bull. 85: 601-609.
Tzeng WN. 1989. Preliminary studies on species composition of fish larvae and juveniles in the Kuroshio waters adja-cent to Taiwan with reference to water mass and diurnal variation. Acta Oceanogr. Taiwanica 22: 102-115.
Walker WA. 1996. Summer feeding habits of Dall,s porpoise,
Phocoenoides dalli, in the southern sea of Okhotsk. Mar.
Wang JY, LS Chou, CJ Yao, AS Neimanis, WH Chou. 1995.
Records of Cuvier,s beaked whales (Ziphius cavirostris)
from Taiwan, Republic of China. Asian Mar. Biol. 12: 111-118.
Wang MC, WA Walker, KT Shao, LS Chou. 2002. Comparative analysis of the diets of pygmy and dwarf sperm whales in Taiwanese waters. Acta Zoologica Taiwanica 13: 53-62. Yeh CC. 2000. Fauna, distribution and habitat features of
cetaceans in coastal waters of southeastern Taiwan.
Master,s thesis, National Taiwan University, Taipei.
Young DD, VG Cockcroft. 1994. Diet of common dolphin
(Delphinus delphis) off the south-east coast of southern Africa: opportunism or specialization? J. Zool. Lond. 234: 41-53.
Young RE, RF Harman. 1986. Early life history stages of eno-ploteuthin squids (Cephalopoda, Teuthoidea, Enoploteuthidae) from Hawaiian water. Vie Milieu 35: 181-201.
Young SS, CC Chen, TS Chiu. 1992. Resource characteristics of young herring-like fish in the I-Lan Bay area - fishing season, major species and size variation. J. Fish. Soc. Taiwan 19: 273-281.
![Table 3. Information on the length-weight relationships [weight = a(length) b ] used to estimate the weight for the 13 major species in the diet of the pantropical spotted dolphin from the eastern waters of Taiwan](https://thumb-ap.123doks.com/thumbv2/9libinfo/8756707.207074/6.892.170.730.801.1084/information-relationships-estimate-pantropical-spotted-dolphin-eastern-taiwan.webp)