College of Management
I-Shou University
Master Thesis
A Study of Factors Affecting Electricity
Saving Behavior of the Governmental Offices
in Binh Thuan Province
Advisor
Co-Advisor
:
:
Prof. CHARIE LAI
Dr. HO SY TAN
Graduate Student
:
Duong Tan Long
ACKNOWLEDGEMENTS
In order to successfully finish this project, I have received many helps, supports and guidance from many persons who I would like to thank for the helps during conducting this research as bellows.
First of all, I would like to thank all the professors for their good teaching and advice and to the staff of I – Shou University throughout the learning process of this MBA program.
Next, I would like to specially thank Prof. CHARLIE LAI and Dr. HO SY TAN who rendered the valuable helps and supports in this final project. I am sincerely grateful to what Prof. CHING SUNG LAI and Dr. HO SY TAN have guided me for my final project. This would be valuable experience that could be useful for me not only for my final project but also in my businesses for the coming future. I would also like to thank my classmates, the members of the MBA program, for sharing interesting and useful knowledge and experience involved in this research.
Finally, I would like to express my thanks to my family, specially, to my wife who created convenient conditions, encouragement and understanding for me to complete this MBA.
December 2015 Duong Tan Long
Abstract
In Vietnam, the impact of climate change has become visible in the recent years. Thus, the promotion of sustainable development and the prevention of climate change has become leading missions in Vietnam and over the world. This thesis was conducted to explore factors influencing the electricity saving behavior of public employees in Binh Thuan Province. Thus, the author expected the findings of this study to help improve the electricity saving behavior of public employees in Binh Thuan Province, thus, contributing to the development of the province and Vietnam as well. The author used the quantitative research method in the study to explore the influencing factors. Findings of this thesis showed that there are two factors “Control Solution” and “Electricity Saving Intention” influencing the electricity saving behavior of public employees. The result also indicated that the factor “Control Solution” is the most influencing factor to the electricity saving behavior. The author also compared the electricity saving behavior based on various demographic groups. While there is no difference in the saving behavior regarding the gender, working position, specialized field, age and marital status, the result shows that participants with different education background display different electricity saving behavior.
Keywords: electricity saving behavior, Binh Thuan, control solution, electricity saving intention
Table of Contents
ACKNOWLEDGEMENTS ... I ABSTRACT ... II TABLE OF CONTENTS ... III LIST OF TABLES ... VI LIST OF FIGURES ... VIII LIST OF ABBREVIATIONS ... IX
CHAPTER I – INTRODUCTION ... 1
1.1BACKGROUND OF THE RESEARCH ... 1
1.2.BENEFITS OF ELECTRICITY SAVING ... 2
1.3.SHORTCOMINGS OF THE PREVIOUS STUDIES ... 2
1.4.INTRODUCTION OF BINH THUAN PROVINCE ... 2
1.5.MOTIVATION OF THE RESEARCH ... 3
1.6.RESEARCH OBJECTIVES ... 4
1.7.SIGNIFICANCE OF THE RESEARCH ... 4
1.8.SCOPE OF THE RESEARCH ... 4
1.9.RESEARCH METHODOLOGY ... 5
1.10.RESEARCH QUESTIONS ... 5
1.11.STRUCTURE OF THE RESEARCH ... 5
CHAPTER 2 - LITERATURE REVIEW ... 6
2.1.ELECTRICITY SAVING... 6
2.2.GENERAL INTRODUCTION TO THE ELECTRICITY CONSUMPTION IN VIETNAM AND BINH THUAN ... 6
2.2.1. Electricity consumption divided by sectors in Vietnam ... 6
2.2.2. Electricity consumption divided by sectors in Binh Thuan ... 8
2.3.THEORIES ON CONSUMER BEHAVIOR ... 10
2.3.1. Concept of consumer behavior ... 10
2.3.2. Consumer behavior theories in economics and psychology ... 10
2.3.3. Theory of Reasoned Action ... 12
2.3.4. Theory of Planned Behavior ... 12
2.3.5. Technology Acceptance Model ... 14
2.3.6. The Norm Activation Model ... 14
2.3.7. United Theory of Acceptance and Use of Technology ... 15
2.4.RESEARCH FINDINGS ON ENERGY CONSUMPTION BEHAVIOR AND ENERGY SAVING BEHAVIOR ... 16
2.4.1. Energy saving behavior ... 16
2.4.2. Factors affecting the energy saving behavior ... 17
2.4.3. Theories on attitude, awareness and concern toward environment ... 17
2.4.4. Influence of demographic factors and socio-economic factors on energy saving behavior ... 18
2.5.STUDIES USING INTERFERENCE STRATEGY TO CHANGE ENERGY CONSUMPTION BEHAVIOR ... 19
2.5.1. Antecedent strategies ... 19
2.5.2. Consequences strategies ... 20
2.6.PROPOSED RESEARCH MODEL AND HYPOTHESES ... 21
CHAPTER 3 - RESEARCH METHODOLOGY ... 25
3.1.RESEARCH DESIGN ... 25 3.1.1. Research process ... 25 3.1.2. Quantitative Research ... 26 3.2.SCALE DESIGN ... 26 3.3QUESTIONNAIRE DESIGN ... 29 3.4.SAMPLING DESIGN ... 29 3.5.DATA ANALYSIS ... 29 3.5.1. Cronbach’s Alpha ... 30
3.5.2. Exploratory Factor Analysis (EFA)... 31
3.5.3. Multiple regression analysis ... 31
CHAPTER 4 - ANALYSIS AND DISCUSSION ... 32
4.1.DESCRIPTIVE STATISTICS ... 32 4.1.1. Age ... 32 4.1.2. Gender ... 32 4.1.3. Education background ... 33 4.1.4. Specialized Field ... 33 4.1.5. Position ... 34
4.1.6. Marital status of the participants ... 34
4.2.MODEL ASSESSMENT ... 35
4.2.1. Reliability test ... 35
4.2.2. Exploratory Factor Analysis... 36
4.2.4. Adjusted research model ... 39
4.2.5. Pearson Correlation Analysis... 39
4.3.REGRESSION ANALYSIS ... 40
4.4.DEMOGRAPHIC COMPARISON ON THE ELECTRICITY SAVING BEHAVIOR ... 42
4.4.1. Gender comparison on the electricity saving behavior ... 42
4.4.2.Age group comparison on the electricity saving behavior ... 43
4.4.3. Education level comparison on the electricity saving behavior ... 43
4.4.4. Specialized field comparison on the electricity saving behavior ... 44
4.4.5. Working position comparison on the electricity saving behavior ... 45
4.4.6. Marital status comparison on the electricity saving behavior ... 45
4.5.DISCUSSION ... 46
CHAPTER 5 - CONCLUSION AND RECOMMENDATION ... 47
5.1.RESEARCH SUMMARY ... 47
5.2.RESEARCH CONTRIBUTIONS ... 48
5.3.RESEARCH LIMITATIONS ... 48
5.4.RECOMMENDATIONS TO PROMOTE THE ELECTRICITY SAVING BEHAVIOR ... 48
5.5.SUGGESTIONS FOR FUTURE RESEARCH ... 49
REFERENCES ... 50
APPENDIX QUESTIONNAIRE ... 53
List of Tables
Table 2.1. National electricity consumption from 2005 to 2014 ... 7
Table 2.2. Predicted Electricity Consumption in the period 2015-2020-2030 ... 7
Table 2.3. Predicted demand and production of electricity in Vietnam in the period 2013-2030 .... 8
Table 2.4. Electricity consumption in Binh Thuan in the period 2010 – 2014 ... 8
Table 2.5. Electricity consumption in Binh Thuan in the period 2010 – 2030 ... 9
Table 2.6. Four-fold typology of behavior ... 11
Table 3.1. Contents of observed variables ... 27
Table 3.2. Cronbach’s Alpha results ... 30
Table 4.1. Age group of the participants ... 32
Table 4.2. Gender of the participants ... 33
Table 4.3. Education backgroundof the participants ... 33
Table 4.4. Specialized field of the participants ... 34
Table 4.5. Workingposition of the participants ... 34
Table 4.6. Marital status of the participants ... 35
Table 4.7. Reliability test ... 36
Table 4.8. KMO and Barlett’s Test results ... 37
Table 4.9. Rotated Component Matrix ... 38
Table 4.10.Correlation Analysis Result... 40
Table 4.11. Model Summary ... 41
Table 4.12. Regression Analysis result ... 41
Table 4.13. Gender comparison on the electricity saving behavior ... 42
Table 4.14. Age group comparison on the electricity saving behavior ... 43
Table 4.15: Education level comparison on the electricity saving behavior ... 43
Table 4.16. Descriptive statistics on the electricity saving behavior across different education level ... 46
Table 4.17. Specialized field comparison on the electricity saving behavior ... 46 Table 4.18. Working position comparison on the electricity saving behavior ... 45 Table 4.19. Marital status comparison on the electricity saving behavior ... 45
List of Figures
Figure 2.1. Factors influencing purchasing behavior ... 10
Figure 2.2. Theory of Reasoned Action ... 12
Figure 2.3. Theory of Planned Behavior ... 13
Figure 2.4. Technology Acceptance Model (TAM) ... 14
Figure 2.5. Norm Activation Model ... 15
Figure 2.6. United Theory of Acceptance and Use of Technology (UTAUT)... 16
Figure 3.1. Proposed research model ... 26
Figure 4.1. Adjusted Research Model ... 39
Figure 4.2. Influence level of independent variables ... 42
List of Abbreviations
GDP Gross Domestic Product
TRA theory of reasoned action
TPB theory of planned behavior
TAM Technology Acceptance Model
NAM Norm Activation Model
UTAUT United Theory of Acceptance and Use of
Technology
VBN Value – Belief – Norm
EFA Exploratory Factor Analysis
KMO Kaiser-Meyer – Olkin
Chapter 1 Introduction
1.1 Background of the Research
To produce electricity, human must exploit fossil fuels such as coal, oil, natural gas to supply their electricity plants. This act is exhausting the natural resources, polluting the environment and producing industrial wastes that in turn cause natural disasters such as greenhouse effect, global warming or ice melting. The construction and operation of hydropower plants are destroying forests and wild animal and vegetation within these forests. For nuclear power plants, the incidents in these plants may deal terrible damage to human, such as the disaster in Chernobyl (Ukraine), Fukushima (Japan). Facing the possible damage of electricity production to the earth and human, it is very important to ensure that the electricity must be produced and used in efficiently and economically.
For Vietnam, based on the development indicators such as Gross Domestic Production (GDP), population size, and urbanization rate, it is estimated that the electricity demand of Vietnam would increase by 4-5 times in the next 15 years, or year 2030. To meet that huge demand, the electricity authorities estimated that they would have to increase the supply by 4-5 times as well. The supply of electricity mostly comes from plants using fossil fuels, especially coal. However, it also means that the increase in supply would deal a heavy blow to the environment of Vietnam.
Thefore, along with promoting and using green energy, solutions to use electricity in a saving way also are very necessary. Surveys showed that the cheap price of electricity in Vietnam was a hindrance to the technology change and energy saving. Consequently, most of industries in Vietnam, especially cement and steel industries are using electricity in a very wasteful way. However, this manner of production would negatively impact the competitive advantages of Vietnam in many fields.
Besides, Vietnam is still a developing country. Therefore, the investment in electricity network expansion faces many difficulties because of the lack of budget and the low price of electricity. Therefore, saving electricity would help the government to save investment for more urgent tasks.
Saving electricity is important not only for the common benefits of human kind such as environment, climate change and natural resources exhaustion but also the energy security and
economic development of Vietnam. Thus, saving electricity is one of the most effective and economical solutions to ensure the national energy security, the sustainable development and the budget saving.
1.2. Benefits of Electricity Saving
- Saving natural resources- Saving money for family and society - Ensure energy security
- Reducing electricity shortage
- Reducing greenhouse effects, climate change and protecting environment
1.3. Shortcomings of the Previous Studies
On the national level, there were many studies on the user behavior toward saving electricity. However, most of these studies were conducted in businesses, factories, restaurants and hotels. In Binh Thuan Province, the State had supported budget for many units to evaluate the usage of energy in sectors that required a lot of electricity such as hospital, maritime products processing factories, hotels… However, for the government offices in Binh Thuan, there has been no study on electricity usage situation and behavior of public servants.
Thus, this study focused on investigating and analyzing factors influencing the electricity saving intention and behavior. Through the findings of this research, the author proposed several solutions to improve the electricity saving in the governmental offices in Binh Thuan province.
1.4. Introduction of Binh Thuan province
Binh Thuan is a province that lies on the Southern Central Coast of Vietnam with a beach 192 kilometers long. The province is near to the strategic economic zone of Vietnam. The provincial capital is Phan Thiet City which is 200 kilometers east from Ho Chi Minh City, 250 kilometers south from Nha Trang City, 120 kilometers north from Vung Tau and 130 kilometers far from Da Lat. The national road 1A, national road 28, national road 55 and the North-South railroad all cross Binh Thuan and connect the provincial city with other hubs of the country. The total area of Binh Thuan is 7,812 square kilometers and the population was 1,201,239 people in 2013.
The province’s economy growth rate is moderate with the average GDP growth rate at 8.96
percent per year. The economic structure of the province is shifting to the industrialization and mordernization way. In 2014, the service sector accounted for 48.3% of the province’s GDP, the industry-construction sector accounted for 32.7%, the forestry-agriculture-maritime only accounted for 19%. The GDP per capita in Binh Thuan was 1,580 USD in 2013.
In the near future, with the large energy projects approved by the government, along with the advantage from its sea economic potential and traffic development, Binh Thuan will become a rapidly developing area. Since 2011, the government and the Ministry of Industry and Commerce have approved and issued many energy projects to Binh Thuan including: project of Vinh Tan Electricity Centre with capacity of 6,224 MW; Son My General Energy Project with Son My Electricity Centre with capacity of 3,900 MW. Binh Thuan also has a network of hydropower plants with total capacity of 900MW. It also has a huge potential for wind power with total estimated capacity of 1,500 MW and some solar projects with capacity of 300 – 500 MW.
With its strategic geography with many important roads and railroads cross the province, Binh Thuan may become a commercial hub for the central regions including Central Highlands and South East region of Vietnam. The projects issued by the government will greatly contribute to the socio-economic development of Binh Thuan, and the province is promised to become an energy centre of Vietnam.
1.5. Motivation of the Research
In general, it is estimated that the electricity usage of the government offices is still very wasteful. Although the government has issued many policies to reduce the waste of public assets, the results were not as expected. In particular, there has been no study on the situation of electricity usage in the government offices or identifying the reasons of the electricity waste.
In Binh Thuan, the awareness and knowledge toward electricity saving of public servants is still limited and they have not formed the habit of saving electricity. Many staff do not show their concern to the task of saving electricity to the common benefits such as environment protection, climate change and saving for future generations. One of the main reasons is that the public servants did not pay the electricity bill and the organizations do not have good policies to enforce the saving behavior.
Therefore, the author conducted the research on the factors influencing the electricity intention and behavior to find solutions to improve the electricity saving behavior of the public servants.
1.6. Research Objectives
This research was conducted to build a model of factors influencing the electricity saving intention and behavior of the public servants in Binh Thuan province, and the study also investigated the influence level of each factors on the staff’s intention and behavior. Based on the findings of the research, the author proposed solutions to use electricity efficiently and economically. In specific, the author would do the following tasks:
- Identifying the influence of factors related to the behavior of saving electricity including personal attitude toward saving electricity, perceived behavior control, subjective norms. The author also investigated the influence level of these factors.
- Identifying the influence of factors related to personal standard and awareness toward the intention and behavior of saving electricity including awareness of consequences of wasting electricity, personal moral standard, awareness of responsibility as well as the influence level of these factors.
- Identifying the influence of infrastructure, demographic characteristics of staff on their electricity saving intention and behavior.
1.7. Significance of the Research
The author aims to fulfill the following tasks:- Investigating, assessing and analyzing the current situation of electricity usage at the governmental offices in Binh Thuan province as well as the policies, decisions and difficulties so that the author can propose suitable solutions to improve the electricity saving in these units.
- Identifying the factors that strongly influence the electricity saving intention and behavior. - Findings of the research can help managers to better understand the problem and provide necessary information for policy makers to make suitable policies to boost the electricity saving result in Binh Thuan and Vietnam.
1.8. Scope of the Research
The research targets are public servants working in the government offices in Binh Thuan province. The author collected data on the influence of attitude, perceived behavior control, subjective norm (or social influence) as well as other factors related to personal awareness, and
demographic characteristics on the electricity saving intention and behavior. The research was conducted from March, 2015 to November, 2015.
1.9. Research Methodology
The author used the quantitative method by delivering questionnaires to 150 public servants in Binh Thuan province. The collected data were analyzed by the statistical software SPSS 18 with analytical methods of T-Test, ANOVA and regression analysis.
1.10. Research Questions
There are 3 research questions in this thesis:
1. What are the factors influencing the electricity saving behavior in the office?
2. Are there differences in electricity saving behavior among different demographic groups (age, sex, educational level, specialized field, position, family status)?
3. What solutions to implement the electricity saving behavior in the office?
1.11. Structure of the Research
The thesis is divided into 5 chapters
- Chapter I: Introduction - Chapter II: Literature Review - Chapter III: Research Methodology - Chapter IV: Results & Analysis
- Chapter V: Conclusions & Suggestions
Chapter 2 - Literature Review
2.1. Electricity saving
Saving electricity means using electricity effectively and efficiently. In other words, saving electricity is using energy reasonably, reducing energy usage and energy cost for all devices while still ensuring the energy supply for all devices in production, service or living purposes.
Saving electricity is using electronic devices reasonably (right time, right place, and right way). For example, setting lights at the suitable places or setting suitable temperature for air conditioners.
Saving electricity also means using electricity at the lowest level while still satisfying demand, for example, using energy-saving bulbs such as compact bulb or Led bulb which have low energy consumption.
2.2. General introduction to the electricity consumption in Vietnam and
Binh Thuan
2.2.1. Electricity consumption divided by sectors in Vietnam
During the period 2010-2013, the energy consumption in Vietnam has increased by 9.9% per year averagely, lower than the period 2006-2010. The main reason is that the economic recession of Vietnam decreases the demand for electricity. However, the general demand of electricity still increases through years. The electricity consumption increased from 86.7 billion kWh in 2010 to 115.069 billion kWh in 2013. In 2014, the commercial electricity level was 126.5 billion kWh, increased 10.8% compared to 2013. The energy consumption of Vietnam from 2005 to June, 2014 is shown in Table 2.1
Table 2.1. National electricity consumption from 2005 to 2014 TT Category 2005 2010 2011 2012 2013 2014 I Electricity consumption (GWh) 1 Agriculture – Forestry - Maritime 574.0 943.5 1079 1265 1532 2106.5 2 Industry - Construction 21302 45568 50085 55300 60337 69689.1 3 Commerce – Hotel - Restaurant 2162.3 3893.6 4335 4988 5412 5605.5 4
Civil Management and
Consumption 19830.6 33139 34455.8 38691 42177 45502.7
5 Other sectors 1734.0 3211.8 4703.0 5230.0 5611.0 4696.2
6 Total 45603 86756 94658 105474 115069 127600
II Electricity consumption percentage (%)
1 Agriculture – Forestry - Maritime 1.3 1.1 1.1 1.2 1.3 1.7 2 Industry - Construction 46.7 52.5 52.9 52.4 52.4 54.6 3 Commerce – Hotel - Restaurant 4.7 4.5 4.6 4.7 4.7 4.4 4
Civil Management and
Consumption 43.5 38.2 36.4 36.7 36.7 35.7
5 Other sectors 3.8 3.7 5.0 5.0 4.9 3.7
According to the Adjusted National Electricity Development Plan, the predicted electricity consumption in the period 2015-2020-2030 is shown in Table 2.2.
Table 2.2. Predicted Electricity Consumption in the period 2015-2020-2030
Sector 2015 2020 2025 2030
GWh % GWh % GWh %
Agriculture – Forestry - Maritime 1869 1 2529 1 3179 1 3841 1
Industry - Construction 73623 53 126386 55 200405 58 305135 62
Commerce – Hotel - Restaurant 6385 5 10375 4 16440 5 25097 5
Civil Management and
Consumption 51658 37 80447 35 109155 32 136100 27
Other sectors 6465 5 11186 5 17133 5 25680 5
Total 140000 100 230924 100 346312 100 495853 100
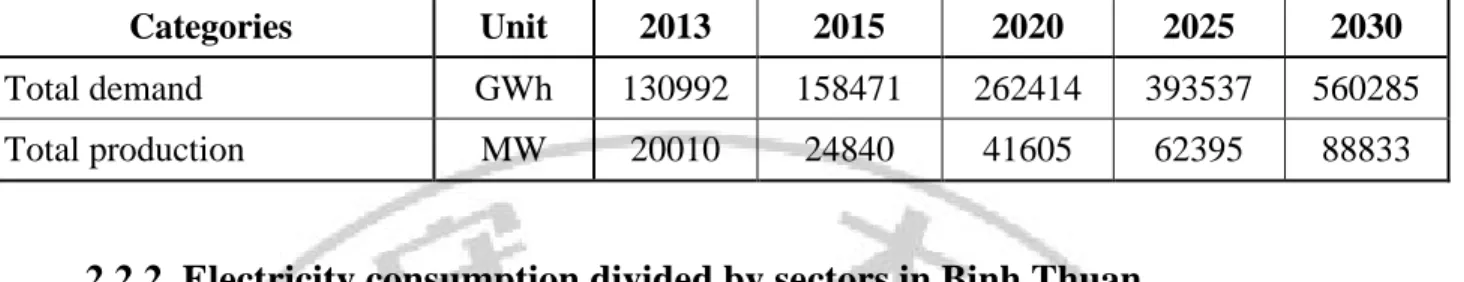
The predicted demand and production of electricity in Vietnam in the period 2013-2030 is shown in table 2.3.
Table 2.3. Predicted demand and production of electricity in Vietnam in the period 2013-2030
Categories Unit 2013 2015 2020 2025 2030
Total demand GWh 130992 158471 262414 393537 560285
Total production MW 20010 24840 41605 62395 88833
2.2.2. Electricity consumption divided by sectors in Binh Thuan
The commercial electricity consumption of Binh Thuan in 2013 was 1.464 billion kWh which is 14.2% higher than the consumption in 2010. The electricity consumption percentage of farming activities increased from 26.2% in 2010 to 30% in 2013 due to the rising demand of red dragon fruit plantation. The consumption percentage of industry rised from 20.4% in 2010 to 23% in 2013. The electricity consumption of Binh Thuan in the period 2010 – 2014 is shown in Table 2.4.
Table 2.4. Electricity consumption in Binh Thuan in the period 2010 - 2014
Unit: GWh 2010 (%) 2011 (%) 2012 (%) 2013 (%) 2014 (%) Increase rate: 2010-2014 Agriculture - Forestry - Maritime 257.8 26.2 312.3 27.2 371.5 28.2 439.7 30.0 517.7 32.2 19,0% Electricity for red dragon in irregular seasons 248.5 301.3 362.7 429.8 507.0 19,5% Industry - Construction 200.9 20.4 278.0 24.3 317.5 24.1 336.7 23.0 334.8 20.8 13,6% Commerce – Hotel - Restaurant 66.3 6.7 74.7 6.5 90.5 6.9 103.3 7.1 116.1 7.2 15.0% Civil Management and Consumption 435.8 44.3 459.7 40.1 513.7 39.0 560.5 38.3 612.7 38.1 8,9% Other sectors 22.5 2.3 21.5 1.9 23.3 1.8 24.8 1.7 27.4 1.7 5,0% Total 983,3 100,0 1146,2 100.0 1316,4 100.0 1464,9 100.0 1608.7 100 13,1% 8
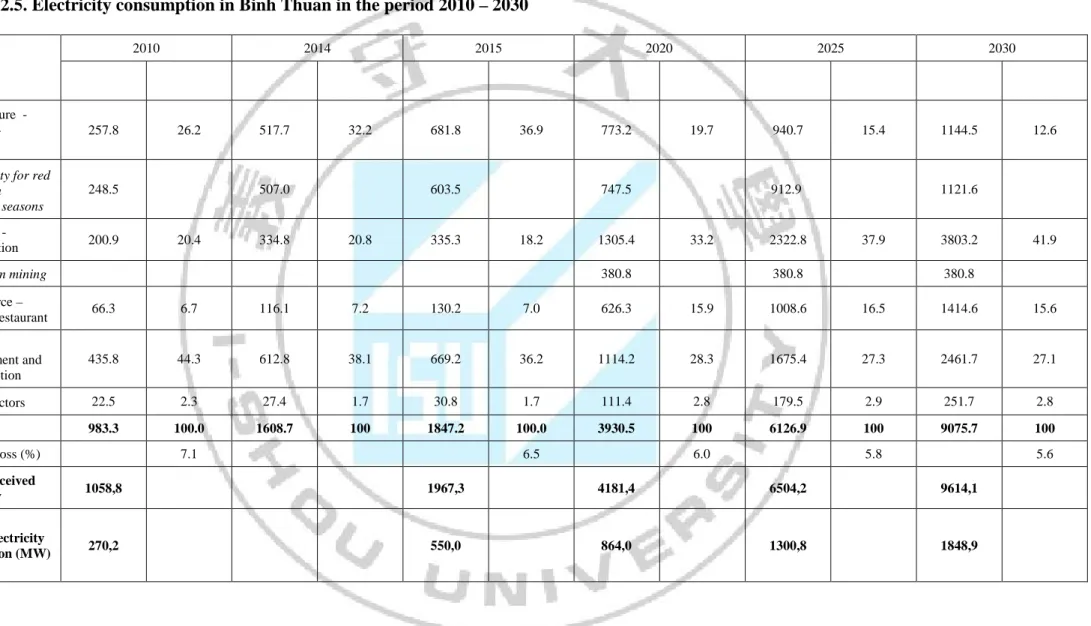
Table 2.5. Electricity consumption in Binh Thuan in the period 2010 – 2030 Content 2010 2014 2015 2020 2025 2030 1 Agriculture - Forestry - Maritime 257.8 26.2 517.7 32.2 681.8 36.9 773.2 19.7 940.7 15.4 1144.5 12.6
Electricity for red dragon in irregular seasons 248.5 507.0 603.5 747.5 912.9 1121.6 2 Industry - Construction 200.9 20.4 334.8 20.8 335.3 18.2 1305.4 33.2 2322.8 37.9 3803.2 41.9 Titanium mining 380.8 380.8 380.8 3 Commerce – Hotel - Restaurant 66.3 6.7 116.1 7.2 130.2 7.0 626.3 15.9 1008.6 16.5 1414.6 15.6 4 Civil Management and Consumption 435.8 44.3 612.8 38.1 669.2 36.2 1114.2 28.3 1675.4 27.3 2461.7 27.1 6 Other sectors 22.5 2.3 27.4 1.7 30.8 1.7 111.4 2.8 179.5 2.9 251.7 2.8 7 Total 983.3 100.0 1608.7 100 1847.2 100.0 3930.5 100 6126.9 100 9075.7 100 8 Energy loss (%) 7.1 6.5 6.0 5.8 5.6 9 Total received electricty 1058,8 1967,3 4181,4 6504,2 9614,1 10 Total electricity production (MW) 270,2 550,0 864,0 1300,8 1848,9 9
As shown in Table 2.5, the electricty demand of Binh Thuan in 2030 is predicted to increase by nearly 500% compared to 2015. Although the electricy company of Binh Thuan has had plan to increase the production of electricity, there are potential risks such as disaster may cause the shortage of electricity supply. Thus, it is important to promote the electricity saving behavior on the province. The success of this action will bring significant benefits to the province and the nation.
2.3. Theories on consumer behavior
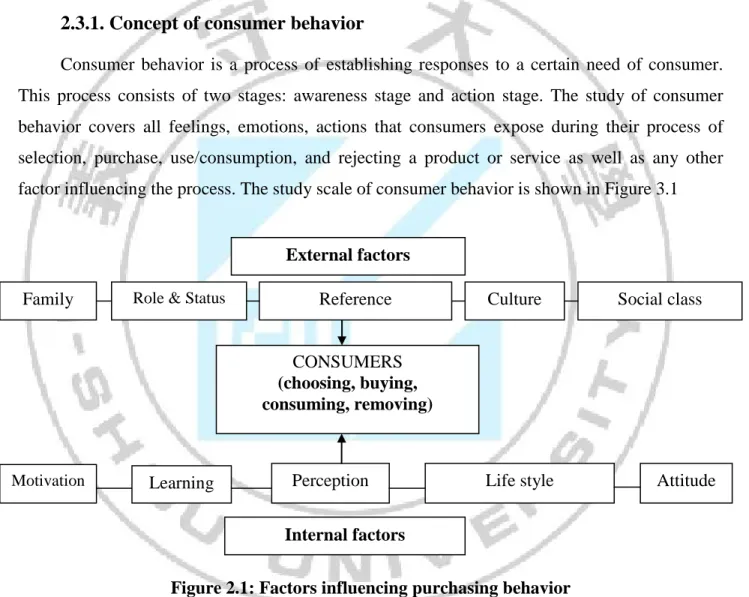
2.3.1. Concept of consumer behaviorConsumer behavior is a process of establishing responses to a certain need of consumer. This process consists of two stages: awareness stage and action stage. The study of consumer behavior covers all feelings, emotions, actions that consumers expose during their process of selection, purchase, use/consumption, and rejecting a product or service as well as any other factor influencing the process. The study scale of consumer behavior is shown in Figure 3.1
Figure 2.1: Factors influencing purchasing behavior
(Source: Nguyen, 2008)
2.3.2. Consumer behavior theories in economics and psychology
Hansen et al. (2007) said that “consumers in the market should be sovereign and that they are indeed sovereign, at least partly. Prerequisites for consumer sovereignty are freedom of consumption, on the demand side and (perfect) competition, on the supply side. Given their preferences, consumers can decide which goods they want to purchase at what price”
External factors
CONSUMERS
(choosing, buying, consuming, removing)
Motivation Learning Perception Life style Attitude
Family Role & Status Reference Culture Social class
Internal factors
(p.447).
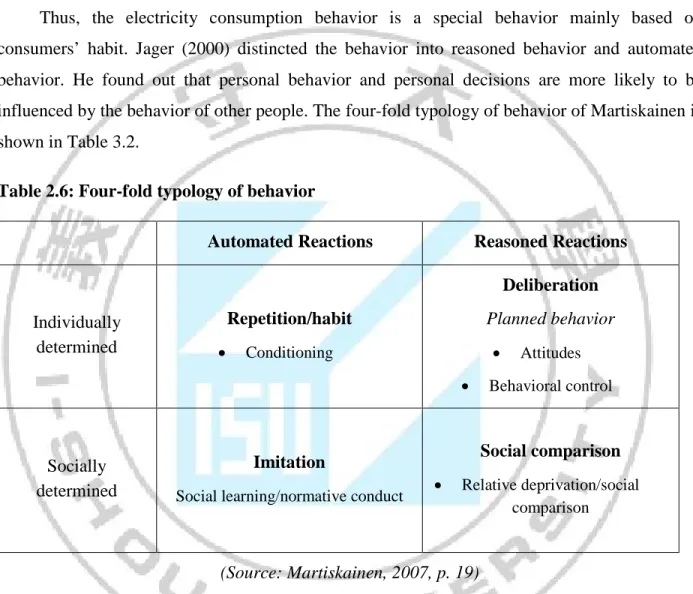
The perspective of sustainable world development focuses on the change of behavior and personal decision in each individual. Specificially in the electricity consumption, Martiskainen (2007) said that personal electricity consumption is not a behavior, but consequence of the switch on and switch off actions and electricity reduction.
Thus, the electricity consumption behavior is a special behavior mainly based on consumers’ habit. Jager (2000) distincted the behavior into reasoned behavior and automated behavior. He found out that personal behavior and personal decisions are more likely to be influenced by the behavior of other people. The four-fold typology of behavior of Martiskainen is shown in Table 3.2.
Table 2.6: Four-fold typology of behavior
Automated Reactions Reasoned Reactions
Individually determined Repetition/habit • Conditioning Deliberation Planned behavior • Attitudes • Behavioral control Socially determined Imitation
Social learning/normative conduct
Social comparison
• Relative deprivation/social comparison
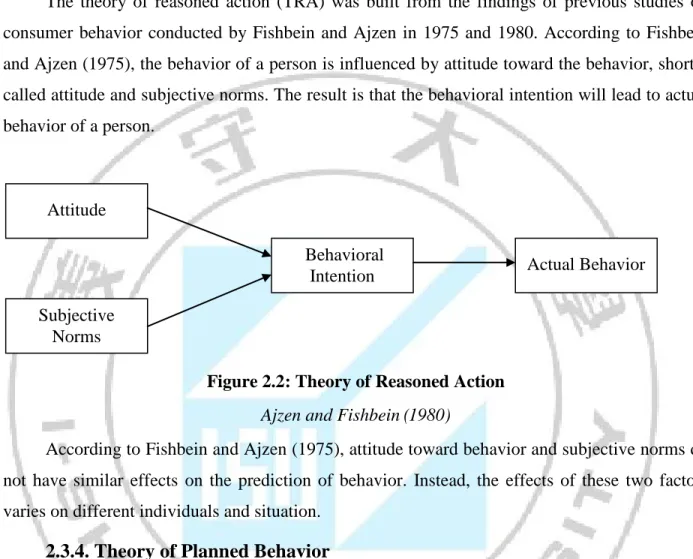
(Source: Martiskainen, 2007, p. 19)
There were many theories in psychology that tried to explain the concept of consumer behavior (Fishbein & Ajzen, 1975; Skinner, 1979; Ajzen 1985, 2002; Bandura, 1986; Stern, 2000; Kaplan, 2000; Corbett, 2005). According to Heiskanen et al. (2006), “behavioral research is used to analyze individual reactions to different initiatives; experimental (or cognitive) research is used to analyze the “social meaning of the costs and benefits of current energy use” (p.8). Attitude behavioral models analyzing behaviors, attitudes, norms are frequently used in social psychology research. The ethical aspects of the behaviors, norms and values are analyzed using the Social Cognitive Theory or Value Belief Theory (pro-social attitudes and personal
moral norms are predictor of pro-environmental behavior). The Theory of Reasoned Action considers that individual aspect certain benefits from the outcome of their behavior.
2.3.3. Theory of Reasoned Action
The theory of reasoned action (TRA) was built from the findings of previous studies on consumer behavior conducted by Fishbein and Ajzen in 1975 and 1980. According to Fishbein and Ajzen (1975), the behavior of a person is influenced by attitude toward the behavior, shortly called attitude and subjective norms. The result is that the behavioral intention will lead to actual behavior of a person.
Figure 2.2: Theory of Reasoned Action
Ajzen and Fishbein (1980)
According to Fishbein and Ajzen (1975), attitude toward behavior and subjective norms do not have similar effects on the prediction of behavior. Instead, the effects of these two factors varies on different individuals and situation.
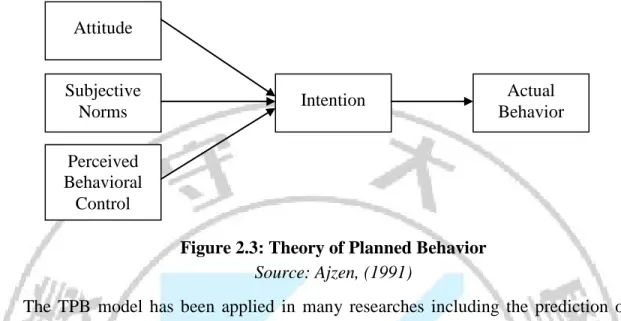
2.3.4. Theory of Planned Behavior
The theory of planned behavior (TPB) is a modified and extended version of theory of reasoned action (Ajzen, 1991). The theory of reasoned action had been widely used in the field of social psychology study (Eagly & Chaiken, 1993; Olson & Zanna, 1993; Sheppard, Hartwick, & Warshaw, 1988, retrieved from Mark, C & Christopeher J.A., 1998, p. 1430). Although the effect of attitude and subjective norms were studied and accepted by many researchers, there was a shortage of TRA model noticed by scholars who raised a question about the case in which consumer lack confidence or control over behavior (Ajzen 1991). Thus, the theory of planned behavior was introduced by Ajzen in 1991 to overcome this shortage of the TRA model. In TPB model, Ajzen (1991) added a new major factor called perceived behavioral control. The perceived behavioral control refers to the individual perception of whether a behavior is difficult to perform or not, and whether the performance of that behavior is limited or not (Ajzen, 1991).
Attitude
Subjective Norms
Behavioral
Intention Actual Behavior
For example, families may not be willing to reduce the energy consumption if they think it is too difficult to do it. The TPB model is shown in Figure 3.4.
Figure 2.3: Theory of Planned Behavior
Source: Ajzen, (1991)
The TPB model has been applied in many researches including the prediction of energy saving behavior and effective energy using behavior (Harland, Staats, & Wilke, 1999; Lindenberg & Steg, 2007). In general, perceived behavioral control and attitude are in close relationship with the environment friendly behavior while subjective norms tend to have less influence (Armitage & Conner, 2001).
According to Taylor and Todd (1995), perceived behavioral control consists of 2 elements: (1) facilitating conditions and (2) self-efficacy.
The limitation of the TPB model and the TRA model is that the authors do not take into consideration the operational components or determinants of behavior for attitude, subjective norms or in some cases, perceived behavioral control. To overcome this limitation, some researchers suggested the addition of factors related to operational components and determinants into the TPB model. Bhattacherjee (2001) suggested the combination between the TAM model and the TPB model by adding two elements, namely perceived usefulness and user friendliness, as determinants of attitude. He also suggested that subjective norms should be decided based on external influence and interpersonal influence.
Taylor and Todd (1995) suggested that the TPB model should be divided and the TAM model should be used as the attitude factor of the TPB model. Besides, Taylor and Todd (1995) also added the factor compatibility as the third element for the factor attitude. Finally, Taylor and Todd (1995) suggested that self-efficacy, resource facilitating conditions and technology facilitating conditions should be used as determinants of perceived behavioral control.
Attitude Subjective Norms Perceived Behavioral Control Intention Actual Behavior 13
2.3.5. Technology Acceptance Model
The Technology Acceptance Model (TAM) was introduced by Davis in 1986. The model helps identifying the influence of external factors on belief, attitude and intention.
In the TAM model, behavioral intention to use technology is influence by two factors: perceived usefulness and perceived ease of use. The TAM model is shown in Figure 3.5.
Figure 2.4: Technology Acceptance Model (TAM)
Source: Davis et al. (1989), Venkatesh et al. (2003)
Although perceived usefulness and perceived ease of use have relationship with attitude toward using technology, Davis et al. (1989) also found out that perceived ease of use also indirectly influence attitude toward using through perceived usefulness.
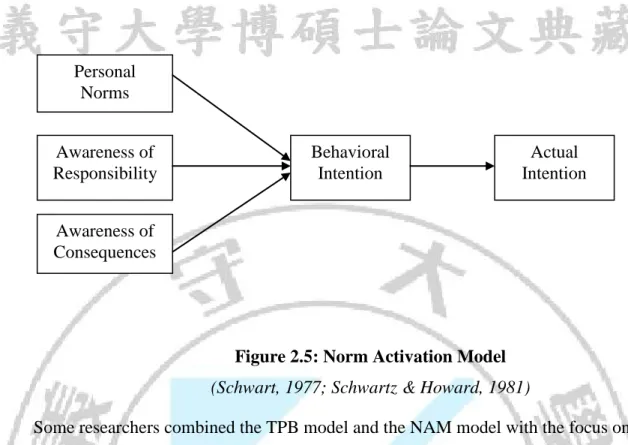
2.3.6. The Norm Activation Model
The Norm Activation Model (NAM) considers the friendly attitude toward environment is a form of altruism where an individual give up his/her personal benefit for the collective benefit such as environment (Schwart, 1977; Schwartz & Howard, 1981). The altruist behavior is identified by personal norms including personal experience and ethical duties. Behaviors fitting personal norms will lead to the feeling of pride, in contrary, bad behaviors lead to the feeling of guilt. The other two factors influencing behavioral intention are awareness of responsibility and awareness of consequences. The NAM model is shown in Figure 3.6.
Perceived Usefulness External Variables Perceived Ease of Use Attitude toward Using Behavioral Intention to Use Actual System Use 14
Figure 2.5: Norm Activation Model
(Schwart, 1977; Schwartz & Howard, 1981)
Some researchers combined the TPB model and the NAM model with the focus on personal norms (Parker, Manstead, và Stradling, 1995). Personal norms in the combined model helped explaining many environmental behaviors such as the use of energy saving bulb or energy saving cars (Harland et al., 1999; Abrahamse, 2009).
2.3.7. United Theory of Acceptance and Use of Technology
The United Theory of Acceptance and Use of Technology (UTAUT) is used to explain the intention and the behavior of using information system. The UTAUT model is shown in Figure 3.7. Personal Norms Awareness of Responsibility Awareness of Consequences Behavioral Intention Actual Intention 15
Figure 2.6: United Theory of Acceptance and Use of Technology (UTAUT)
Source: Venkatesh et al. (2003)
Within the UTAUT model, there are four factors including performance expectancy, effort expectancy, social influence and facilitating conditions that directly influence intention and behavior. Gender, age, experience and voluntaries are factors that indirectly influence intention and behavior through performance expectancy, effort expectancy, social influence and facilitating conditions. The UTAUT model is the combination of several models and theories such as TRA, TAM, and TPB. Researches showed that the UTAUT model can explain 70% of the differences in usage intention.
2.4. Research findings on energy consumption behavior and energy
saving behavior
2.4.1. Energy saving behavior
Barr et al. (2005) divided energy saving behavior into two major groups: behavior by habit and behavior by purchasing energy saving devices. Behavior by habit has been mentioned in many researches such as energy saving choices (Stern, 1992), home adjustments (Dillman et al., 1983), usage related (Van Raaij & Verhallen, 1983). People who reduce the usage of energy without any external influence are counted in the group of behavior by habit. For example, people
Performance Expectancy Effort Expectancy Social Influence Intention Behavior Experience
Gender Age Voluntaries
Facilitating Conditions
who turn off electrical devices not in use without being asked by other people. The behavior in this group is related to daily habit based on the past experience of an individual.
Behavior by purchasing energy saving devices were also mentioned in other researches in different names such as technology choices (Stern, 1992), conservation actions (Dillman et al., 1983), purchase related behavior (Van Raaij & Verhallen, 1983). This behavior group is related to the change of energy consumption devices such as switching to energy saving devices.
2.4.2. Factors affecting the energy saving behavior
The energy saving behavior has been widely studied during the recent decades, especially with the visible threat of energy crisis and energy exhaustion. Besides, serious environmental issues such as pollution, global warming, climate change and biological diversity decrease have further motivated researchers to study the energy using behavior to find solutions to reduce negative effects on environment (Abrahamse et al, 2005; Gardner & Stern, 2002).
Sardianou, 2007; Ščasný & Urban, 2009; Urban & Ščasný, 2012; Wang & cộng sự, 2011). Previous studies have identified major factors affecting energy saving behavior including: (1) socio-economic and demographic characteristics, (2) housing characteristics, and (3) attitude, awareness and concern toward environment and energy saving (Hori et al., 2013; Mills & Schleich, 2012; Sardianou, 2007; Ščasný & Urban, 2009; Urban & Ščasný, 2012; Wang et al., 2011).
2.4.3. Theories on attitude, awareness and concern toward environment
According to Abrahamse and Steg (2011), there are two theories which are used widely to explain the relationship between attitude, perception and concern toward environment and energy saving behavior. The two theories are the Theory of Planned Behavior and the Theory of Value – Belief – Norm (VBN).
In TPB theory, the factor that pushes the actual behavior is the intention to perform a behavior (Ajzen, 1985, 1991). The intention is decided by three factors: attitude, subjective norms and perceived behavioral control. Attitude refers to the positive or negative assessment of a person toward a certain behavior. Subjective norms refers to social pressure or standard that a person perceived toward a behavior. Perceived behavioral control refers to whether a behavior is easy to perform or not.
According to the VBN theory, value refers to guiding principles of an individual behavior. Value is usually measured through New Environmental Paradigm Index. Belief refers to the
awareness of the environmental consequence resulted from a behavior. Higher belief will lead to higher personal responsibility toward environment. The responsibility leads to personal norms which have positive relationship with the environment friendly behavior.
Researches showed that attitude, perception and concern toward environment influence energy saving behaviors (Black et al., 1985; Brandon & Lewis, 1999; Hori et al., 2013; Sardianou, 2007; Ščasný & Urban, 2009; Urban & Ščasný, 2012; Wang et al., 2011).
Sardinou (2007) found out that people tend to perform the energy saving behavior more when they have information about the global environment and they realize their contribution to environmental issues.
According to Ščasný & Urban (2009), the energy saving behavior when using electrical devices is correlated with the concern toward environment. Urban and Ščasný (2012) also found evidence of positive influence of the concern toward environment on the energy saving behavior when using electrical devices or investing into these devices.
Wang et al. (2011) found out that the understanding of electricity saving has positive relationship with the willingness to save electricity. Hori et al. (2013) built an awareness index of global warming that includes questions on (1) reasons of global warming, (2) cost sharing to prevent global warming, (3) understanding the consequences of global warming. The result showed that the energy saving behavior is correlated with the awareness index of global warming in Dalien and Bangkok.
2.4.4. Influence of demographic factors and socio-economic factors on
energy saving behavior
Age
In a study on 600 households in Switzerland, Lindén et al. (2006) claimed that younger households tend to have better knowledge on electrical devices than older ones. Sardinou (2007) said that older people generally are less likely to perform energy saving behavior, especially on purchasing energy efficient devices because to they have less time to benefit from this action. Besides, they seem to be less educated on energy saving knowledge.
However, recent studies showed the positive effect of age on energy saving behavior (Lynn & Longhi, 2011; Ščasný & Urban, 2009; Urban & Ščasný, 2012; Wang et al., 2011) According to Ščasný & Urban (2009), age has correlation with energy saving behavior when using electrical
devices. Similarly, Lynn & Longhi (2011) claimed that age is in positive relationship with energy saving behavior.
Gender
Female tends to perform energy saving behavior more often than male (Lynn & Longhi, 2011; Ščasný & Urban, 2009). However, other studies did not find the significant role of gender on the energy saving behavior (Sardianou, 2007; Urban & Ščasný, 2012; Wang et al., 2011).
Education
Mixed opinions were proposed to the effects of education on energy saving behavior. Some studies showed the positive effect of education on energy saving behavior (Brounen et al., 2013; Mills & Schleich, 2012). While other studies did not find the influence of education on the energy saving behavior (Lynn & Longhi, 2011; Sardianou, 2007; Ščasný & Urban, 2009).
Housing characteristics
According to Black et al. (1985), Guerin et al. (2000) and Walsh (1989), housing characteristics (size and number of rooms) are in positive relationship with the energy saving behavior. In other words, the bigger the house is, the more willing owners of those house to perform the energy saving behavior. Sardianou (2007) found out that families living in detached house tend to save energy more frequently. However, according to Wang et al. (2011), the housing size in Beijing is in negative relationship with the willingness to save electricity.
2.5. Studies using interference strategy to change energy consumption
behavior
Abrahamse (2005) conducted various studies on energy usage, especially in the field of social studies and environmental psychology. The studies were divided into two strategies: antecedent strategies and consequence strategies.
2.5.1. Antecedent strategies
The antecedent strategies refer to interference steps to energy using behavior such as commitment, goal setting, information and modeling.
Commitment is “oral or written pledge or promise to change behavior” (Abrahamse et al., 2005, p.275). Goal setting is similar to commitment in the way that the defined reference point makes the difference in behavior. Information is usually used to influence the personal behavior on energy saving.
Staats (1996) conducted a study to estimate the effectiveness of a mass media campaign on greenhouse effect. He found out that although there was a slight increase in the knowledge of greenhouse effect, no significant effect was found in the campaign. In another study in a U.S military base, McMakin (2002) noticed that the households in the base are willing to save energy to set example for their children. McMakin (2002) concluded that “some aspects of social-psychological model appear useful in motivating energy-use behavior change, but others are not as effective” (p.15).
2.5.2. Consequences strategies
The consequences strategies assume that behavior will be influenced by positive or negative consequences. The most common strategies are feedback and rewards.
Feedback includes “providing households information about their energy consumption or energy savings” (Abrahamse et al., 2005, p.278). Feedback represents the frequency of energy using of households. Van Houwelingen (1989) found out that feedbacks on electricity usage, electricity cost and housing size have positive effect on personal energy saving behavior.
Staats (2004) conducted a research with an ecological team to identify behaviors related to energy using behavior. After two years of research, Staats (2004) concluded that “perceived behavioral control and habit, two components that have become stronger during participation in the Eco Team Program, are factors that promote the use of more environmentally friendly transportation means” (p.6).
Wilhite (2007) suggested that technology plays a significant role in the increase of energy usage. However, the introduction of new technology may also create potentials for efficient energy usage. Wilhite (2007) emphasized the need to change technologies in the context of rapid social – economic – cultural development.
Martiskainen (2007) identified two behavior groups of energy saving: (1) curtailment behavior and (2) efficiency behavior. However, there are still arguments on whether curtailment behavior or efficiency behavior are more effective in energy saving behavior (Martiskeinen, 2007).
Kagawa (2007) suggested that 90% of students in his research showed positive attitude and support toward sustainable development. Gam (2004) explored that the electricity consumption depends a lot on income while age, education, gender and ethnicity tend to have low influences on the electricity consumption.
2.6. Proposed research model and hypotheses
Based on the theory of planned behavior which assumes that behavior is resulted from a process of utilizing costs and benefits. The electricity saving behavior is defined by the electricity saving intention. The intention is, in turn, influenced by three factors: (1) attitude, (2) perceived behavioral control, (3) subjective norms (or social influence). Attitude refers to the positive or negative assessment of a person toward a certain behavior. Subjective norms refers to social pressure or standard that a person perceived toward a behavior. Perceived behavioral control refers to whether a behavior is easy to perform or not.
According to the norm activation model, the intention to save electricity can be influenced by environmentally friendly behavior. The intention is decided by: (1) personal norms, (2) awareness of consequences, and (3) awareness of responsibility. Personal norms refer to personal perception of electricity usage. Awareness of responsibility refers to the attitude toward environmental issues. Awareness of consequences means how much a person understands the consequences of his/her behavior.
With the technology acceptance model, the behavioral intention on accepting technology is influenced by two beliefs: (1) perceived usefulness and (2) perceived easy of use.
Brandon and Lewis (1999) proposed a hypothesis that the electricity usage of an organization is in close relationship with the infrastructure and the demographic – social factors within that organization.
The propose research model of this thesis is the combination between the TPB model, the NAM model, the TAM model, the UTAUT model and other factors (infrastructure and demographic – social factors). In this thesis, the author chose the following factors for the model: (1) attitude, (2) perceived behavioral control, (3) subjective norms, (4) personal norms, (5) awareness of consequences, (6) awareness of responsibility, (7) infrastructure and (8) demographic – social factors.
Hypotheses of the research
Based on the chosen factors, the author proposed 8 hypotheses on the relationship between these factors with the electricity saving intention and electricity saving behavior.
1. Hypothesis H1: Attitude positively influences electricity saving intention
H1+
2. Hypothesis H2: Perceived behavioral control positively influences electricity
saving intention
H2+
3. Hypothesis H3: Subjective norms positively influence electricity saving intention
H3+
4. Hypothesis H4: Personal norms positively influence electricity saving intention
H4+
5. Hypothesis H5: Awareness of consequences positively influences electricity
saving intention Attitude
a. Simplicity
b. Still performing well c. Ensured work quality
Electricity saving behavior
Personal norms
a. Awareness of saving electricity b. Do not use electricity for personal purposes
c. Saving money for organziation d. Saving anytime possible
Electricity saving behavior Perceived behavioral control
a. Knowing electricity saving methods b. Able to save energy at work
Electricity saving behavior
Subjective norms
a. Organizational regulations b. Electricity price increase
c. Management responsibility in electricity usage monitoring
d. Suggestions from leaders e. Rewards and punishment f. Periodical review
Electricity saving behavior
H5+
6. Hypothesis H6: Awareness of responsibility positively influences electricity
saving intention
H6+
7. Hypothesis H7: Infrastructure positively influence electricity saving behavior
H7+
8. Hypothesis H8: Electricity saving intention positively influences electricity
saving behavior
H8+
Awareness of consequences
a. Exhausting resources
b. Pollution and climate change c. Unstable electricity network and electricity shortage
Electricity saving behavior
Awareness of responsibility
a. Follow government and organization demands
b. Saving national budget
c. Protecting environment and preventing climate change
d. Saving natural resources
e. Electricity network is stabilized
Electricity saving behavior
Impact of infrastructure
a. Office design
b. Use of energy saving devices c. Good electricity network
d. Good arrangement of electronic devices
Electricity saving behavior
Electricity saving intention
a. I will learn and implement the solutions to save electricity in the office
b. I will learn the rules about the electrical eqiupment with energy-saving label
c. I will form the habit to use the electricity sparingly
Electricity saving behavior
Conclusions of Chapter 2
This chapter mentioned the concept of electricity saving. It also introduced the general situation of energy consumption in Vietnam and Binh Thuan. The chapter covered various theories, models and findings on consumer behavior, energy consumption and energy saving behavior. Various factors that may influence electricity saving intention and electricity saving behavior were also listed.
From the propsed research model and hypotheses, the author will proceed to build questionnaire and suitable scale for the research. With the data collected, the author will perform necessary analyses to find out the factors influencing electricity saving intention and electricity saving behavior in the administrative office in Binh Thuan Province.
Chapter 3 - Research Methodology
Chapter 3 mentioned the research methods used in the study to build the official scales for the research. The chapter also proposed the research process, questionnaire design, sampling design. Besides, the author mentioned the analytical tools of this study including Cronbach’s Alpha, EFA, descriptive statistics, ANOVA, t-test, and regression analysis.
3.1. Research Design
3.1.1. Research process
The research process is shown in Figure 3.1.
Figure 3.1. Proposed research model
Attitude Subjective norms Perceived behavioral control Awareness consequences Awareness responsibility Infrastructure Electricity saving intention Electricity saving behavior Personal norms 25
3.1.2. Quantitative Research
The thesis used the quantitative research method through survey using questionnaires. The collected data will be input by SPSS software. After coding and cleaning data, the analysis was conducted through the following tests:
- Reliability test: the reliability of scale is assessed through the coefficient Cronbach’s
Alpha, variables that have the item-correlation value lower than 0.3 will be removed. Only variables that have the item-correlation value higher than 0.6 will be accepted for the scale.
- Exploratory Factor Analysis – EFA: The EFA analysis is used to test the convergence of the data and help the author to explore the underlying structure of the constructs. In Bartlett’s Test of Sphericity, if the significant value is lower than 0.05, the null hypothesis is rejected and data is ready for further EFA test. The KMO (Kaiser-Meyer – Olkin) value should also range from 0.5 to 1 to ensure the factor analysis is suitable for the data. Variables that have the factor loading lower than 0.5 will be removed. The KMO test Then the Principle axis factoring analysis with Varimax will be conducted. Criteria for acceptance factor analysis with cumulative variance greater than 50% with Eigenvalue must be greater than 1.
- After the EFA analysis, the regression analysis will be run to test the research model and predict the relationship between constructs.
3.2. Scale design
The scale and questionnaires were built and developed based on the literature review and the research model. The scale was drawn from scales used in the study of Abrahamse and Steg (2009) and added new items proposed by the author. Thus, before establishing the official scale for the study, the author also conducted interviews and pilot test to make sure that all the items in the questionnaires are clearly understood.
The author used the 5-point Likert scale for the study to measure the items and constructs. The 5 points of the scale are:
+ 1 - Completely disagree + 2 - Disagree + 3 - Neutral + 4 - Agree + 5 - Completely agree 26
In the proposed research model, there are 9 constructs and 30 observed variables. The content of the variables is shown in Table 3.1.
Table 3.1 Contents of observed variables
Statements Completely Disagree (1) Disagree (2) Neutral (3) Agree (4) Completely Agree (5) 1. ATTITUDE
a. The electricity savings in the office is very easy
b. If I save electricity, I can still work well
c. The quality work of office is assured even when I save electricity
2. PERCEIVED BEHAVIORAL CONTROL a. I know the electricity saving solutions
in the office
b. I think I can save electricity when I am working in the office
3. SUBJECTIVE NORMS
a.When the office issues fixed monthly electricity usage norm, it will influence electricity saving behavior of staff
b. When the State increases electricity price, it will influence electricity saving behavior of staff
c. The fact that managers show responsibility in managing electricity usage will influence electricity saving behavior of staff
d. The constant notices of managers on saving electricity will impact on electricity savings of staffs
e. The policy of reward and punishment on electricity usage will influence electricity saving behavior of staff
f. Periodic review on electricity usage will influence electricity saving behavior of staff
4. PERSONAL MORAL STANDARD a. I always care about electricity savings in my office
b. I do not use the electricity of the office for my personal gains
c. I save electricity to save money for my office
d. I think I have to save electricity whenever possible
5. AWARENESS OF CONSEQUENCES a. Wasteful use of electricity will waste natural resources
b. Wasteful use of electricity will cause the environmental pollution and climate change
c. Wasteful use of electricity will cause the imbalance of the national electricity system and power shortage
6. AWARENESS OF RESPONSIBILITY a. Saving electricity is to follow the regulation of the State and the office b. Saving electricity is saving the national budget
c. Saving electricity will contribute to the environmental protection and reduce the climate change
d. Saving electricity will save natural resources of the nation
e. Saving electricity will improve the balance of national electricity system and ensure the electricity supply
7. IMPACT OF INFRASTRUCTURE a. Building with closed structure and thermal insulation will save electricity b. Building with cool air will save electricity
c. Building with natural light will save electricity
d. The scientific arrangement of main electric equipment (lamp, fan, air-conditioned) will save electricity
e. The replacement of old electric equipment with energy-saving equipment will save electricity
f. Good electricity quality will save electricity
g. Good electric grid quality will save electricity
8. ELECTRICITY SAVING INTENTION a. I will learn and implement the solutions to save electricity in the office b. I will learn the rules about the electrical equipment with energy-saving label
c. I will form the habit to use the electricity sparingly
9. ELECTRICITY SAVING BEHAVIOR a. I use electricity based on the necessary and reasonable demand in order to save electricity
b. I give priority to electric equipment with energy-saving label
c. I turn off unused electric equipment when no person in the room
d. I take full advantage of natural light and cool natural air in the office to save the electricity
3.3 Questionnaire design
The questionnaire was designed based on the literature review, experts’ opinions, and pilot test. The official questionnaire is shown in Appendix 3.
3.4. Sampling design
The sample size is 150 staff of administrative offices in Binh Thuan Province. According to Bollen (1989), there should be 5 samples for each observed variables and the sample size should not be less than 100. Thus, with 30 observed variables, the author chose the sample size of 150. The sampling method is convenient sampling due to the limitation of time and resources of this study. The questionnaires were directly handed to respondents or sent to them through emails. After collecting answers from 150 respondents, the author coded and cleaned the data. Out of 150 questionnaires, there are 108 questionnaires accepted for the research. Data from the accepted questionnaires were then analyzed by the statistical software SPSS version 18.
3.5. Data analysis
Analytical tools used in this study are the reliability test (Cronbach’s Alpha), the EFA test, ANOVA (Analysis Of Variance), t-test and the multiple regression analysis.
3.5.1. Cronbach’s Alpha
The formula of the Cronbach α isα = Nρ/[1 + ρ(N – 1)].
The reliability test helps researchers to identify and remove observed variables not suitable for the scale through the coefficient Cronbach’s Alpha. Observed variables with the item-correlation values lower than 0.3 will be removed. Only variables that have the item-item-correlation value higher than 0.6 will be accepted for the scale.
In this study, the author ran the preliminary test with 40 samples to test and adjust the scale for the official study. Results from the reliability test showed that all observed variables met the requirements for the scale except the scale “Impact of infrastructure” that only had the coefficient of 0.37. However, as the reliability test is the necessary condition, but not the sufficient condition. Thus, the author decided to keep the scale “Impact of infrastructure” in the official research. The Cronbach’s Alpha result is shown in Table 3.2
Table 3.2: Cronbach’s Alpha results
No. Scale Observed
Variables
Cronbach’s Alpha
1 ATTITUDE 3 0,807
2 PERCEIVED BEHAVIORAL CONTROL 2 0,776
3 SUBJECTIVE NORMS 6 0,780
4 PERSONAL MORAL STANDARD 4 0,811
5 AWARENESS OF CONSEQUENCES 3 0,758
6 AWARENESS OF RESPONSIBILITY 5 0,909
7 IMPACT OF INFRASTRUCTURE 7 0,870
8 ELECTRICITY SAVING INTENTION 3 0,838
9 ELECTRICITY SAVING BEHAVIOR 4 0,902
3.5.2. Exploratory Factor Analysis (EFA)
The EFA analysis is used to test the convergence of the data and help the author to explore the underlying structure of the constructs. In Bartlett’s Test of Sphericity, if the significant value is lower than 0.05, the null hypothesis is rejected and data is ready for further EFA test. The KMO (Kaiser-Meyer – Olkin) value should also range from 0.5 to 1 to ensure the factor analysis is suitable for the data. Variables that have the factor loading lower than 0.5 will be removed. The KMO test Then the Principle axis factoring analysis with Varimax will be conducted. Criteria for acceptance factor analysis with cumulative variance greater than 50% with Eigenvalue must be greater than 1.
3.5.3. Multiple regression analysis
The auther use the multiple-regression for statistic analyzing. Multiple-regression is a statistical technique that enables the statisticians to predict the score of independent variables (or predictor variables) impacting on dependent variable (or criterion variable), in order to consider the relationship between independent variables and dependent variable. This relationship may be linear or non-linear, predictor variables may be quantitative or qualitative (Cohen et al, 2003).
Based on the theoretical framework, the general formula of regression is: Y = f(Xi).
Y is dependent variable and Xi = X1, X2, X3,… are independent variables. In this way, the
formula of regression is:
Y = B1X1 + B2X2 + B3X3 + … + BnXn + B0 Y: dependent variable X1, X2, X3,… Xn: independent variables B0, B1, B2… Bn: Beta coefficients 31
Chapter 4 - Analysis and discussion
In this chapter, the author provided the analysis results including reliability test, exploratory factor analysis, and regression analysis on the electricity saving behavior of public employees in BinhThuan Province.
4.1. Descriptive Statistics
4.1.1. Age
The result shows that the age group 31-40 years old is the largest group with 43.5% of the samples. Employees below 30 years old account for 24.1%, while the age group 41-50 years old takes 16.7% and the age group 51-60 years old takes 15.7%. The result means that the majority of the public employees are at the young age, thus, they are likely to be more aware of the energy saving activity.
Table 4.1: Age group of the participants
Age N Percentage (%) Below 30 26 24.1 From 31 to 40 47 43.5 From 41 to 50 18 16.7 From 51 to 60 17 15.7 Total 108 100
4.1.2. Gender
Table 4.2 shows that male participants take the majority of the surveyed employees (67.6%) while female participants only account for 32.4%. Based on the author’s experience, this result is quite close to the reality as the number of male employees is normally higher than the number of female employees.
Table 4.2: Gender of the participants Gender N Percentage (%) Female 35 32.4 Male 73 67.6 Total 108 100.0
4.1.3. Education background
The result in table 4.3 shows that the majority of the participants have the bachelor degree (84.3%). The number of the participants who have vocational degree are quite small, only 8.3%. This is quite true as the new policy of Vietnamese government dictated that public employees should be at the higher education level.
Table 4.3: Education backgroundof the participants
Education Background N Percentage
(%) Vocational level 09 8.3 Bachelor 91 84.3 Graduate 08 7.4 Total 108 100
4.1.4. Specialized Field
The result in table 4.4 shows that the majority of the participants are working in the Technology and Economy – Finance fields with each category accounts for 45.4% of the participants. Only a small number of the participants are working in the Culture – Social field and Other Fields.
Table 4.4: Specialized field of the participants
Specialized Field N Percentage
(%) Technology 49 45.4 Economy - Finance 49 45.4 Culture - Social 04 3.7 Other Fields 06 5.6 Total 108 100
4.1.5. Position
Table 4.5 shows that the Head of Organization position only takes a small percentage (11.1%). Next, 29.6% of the participants are head of department while the majority of the participants are employees (59.3%). This is understandable as employees are always the largest group in an organization.
Table 4.5: Working position of the participants
Position N Percentage (%) Head of Organization 12 11.1 Head of Department 32 29.6 Employees 64 59.3 Total 108 100
4.1.6. Marital status of the participants
Table 4.6 shows that 80.6% of the participants are married and 19.4% of the participants are single. This result is aligned with the previous statistics on the age group of the participant with 24.1% are below 30 years old.
Table 4.6: Marital status of the participants
Marital status N Percentage
(%) Single 21 19.4 Married 87 80.6 Total 108 100
4.2. Model assessment
4.2.1. Reliability test
The reliability test is used to check which item really helps to measure the concepts in a study. An item that measures the same latent concept should be correlated to the other items in a group. Cronbach’s Alpha coefficient is a test on the correlation consistency among items. The variables that have the item-total correlation less than 0.3 will be removed and only variables with the item-total correlation higher than 0.65 are chosen. Though there are researchers require the correlation higher than 0.8, however, if the concepts are new to respondents, it is acceptable to have Cronbach’s Alpha value higher than 0.6 (Nunnally, 1978; Peterson, 1994; Slater, 1995).