行政院國家科學委員會專題研究計畫 成果報告
地面光達特徵資料重建模型之研究
研究成果報告(精簡版)
計 畫 類 別 : 個別型 計 畫 編 號 : NSC 95-2221-E-004-014- 執 行 期 間 : 95 年 08 月 01 日至 96 年 07 月 31 日 執 行 單 位 : 國立政治大學地政學系 計 畫 主 持 人 : 黃灝雄 計畫參與人員: 碩士班研究生-兼任助理:方偉凱 大學生-兼任助理:阮廷蓉、蔡欣達、鄭則元、楊素容、陳 青、莊璧華、陳亭霓、廖晟福、黃琇蔓、謝奇儒 報 告 附 件 : 出席國際會議研究心得報告及發表論文 處 理 方 式 : 本計畫涉及專利或其他智慧財產權,1 年後可公開查詢中 華 民 國 96 年 12 月 05 日
行政院國家科學委員會專題研究計畫成果報告
地面光達特徵資料重建模型之研究
計畫編號:NSC95-2221-E-004-014
執行期間: 95 年 8 月 1 日至 96 年 7 月 31 日
主持人:黃灝雄 執行機構與單位名稱:國立政治大學地政學系
一、 中文摘要 光達可快速大量掃瞄物體表面,並 提供高精度的三維空間資訊,對於製作 DEM 或重建立體模型上,有極大的貢 獻,其運用範圍,已不僅侷限在測量領 域,在資源調查、古蹟維護、或工業設 計上均有所發揮。 隨著技術的演進,如何快速、精確 取得資料,將不再是個難題,取而代之 的是,如何有效處理掃瞄所得的龐大資 料。無論是空載光達或是地面光達,掃 瞄所得的原始資料通常是由三維坐標 (X,Y,Z)、點位的反射強度值 I 所組成 的點雲資料。雖然可透過電腦繪圖軟體 的立體展示功能,瞭解點雲資料分佈的 特性,卻無法直接獲取所需的幾何資 訊,必須經由一些特定的步驟、或軟體, 篩選、處理資料,才能化為有用的空間 資訊。 在點雲資料的處理上,常利用幾何 特徵以重塑物體架構;無論最後使用的 是點結構或線結構,通常皆先以面結構 推算點特徵與線特徵的初始位置,再以 不同方式求取特徵的最適位置。由此可 知,面特徵的優劣攸關後續點特徵與線 特徵的好壞。本研究之主要目的,在探 討光達資料在建構面特徵上的特性,進 而瞭解平面的優劣對於重建模型的影 響。 關鍵字:地面光達、點雲、面架構、重 建模型 AbstractLidar can scan surfaces of many objects in a short time. In addition, it provides high accurately 3-D data which have contributed in the making DEM or reconstructing 3-D models. Not only in surveying, have application using Lidar also been applied to resources
investigation, ancient preservation and industrial design.
And following the advancement of Lidar, it is no longer the problem of how to get data, but instead, how to deal with the massive amount of data efficiently. Whether the airborne Lidar or terrestrial Lidar, all point clouds data perceived are usually a combination of 3-D coordinates and grey scale values. Although, anyone can easily understand the distributed
characteristics of the point clouds data by using 3-D modeling software, it is
however, very difficult to grasp and understand the geometrical properties that are relevant to get spatial science. The enormous data needs to be pre-interpreted first by special software processing in order to form useful and meaningful information that can be applied to other application.
In the process of using point clouds, often utilize the characteristic of geometry in order to rebuild the object structure. And no matter that one is used point structure or line structure finally, its is all a way that uses plane structure to calculate the initial positions of point characteristics or line characteristics, and then ask for the fitting position of geometric
characteristics by different way. Therefore, the quality of plane characteristics always affects how good the following point characteristics and line characteristics are. Among the research, the main purpose is to study what are the important features when using Lidar data to build plane characteristics, and then investigate the influence of the plane structure for rebuilding model for the scanned object.
Keywords:terrestrial Lidar, point clouds, rebuilding model.
二、緣由及目的
光達,簡稱 LIDAR (LIght Detection And Ranging),是近幾年來新興的一種 測繪技術,其基本原理主要是利用雷射 測距方式,量測雷射脈衝發射、反射後 接收其間的時間差,來計算發射源到測 定點之間的距離,同時計算方位角,從 而定出發射光源與測定點之間的位相關 係。其與全測站經緯儀最大的不同是, 光達可以大量且快速的測得物體的三維 空間資料。其種類根據載具的種類,可 分為空載光達與地面光達兩種,而空載 光達又因雷射光設計的不同,又可分為 陸域光達與測深光達兩類。一般來說, 空載光達在高空掃瞄時,必須配合全球 定位系統(GPS)及慣性導航系統(INS) 的使用,才能精確定出地表物體的三維 空間資料,並結合傳統地面測量及航空 攝影測量之技術,於產製地面高程模型 及重建建物模型上,有廣大的運用空 間。地面光達的掃瞄距離與空載光達相 比,明顯較短,一般約在數百公尺以內, 在大範圍的資料蒐集上,較不如空載光 達有利,但在小區域範圍內,地面光達 使用比較靈活,且能蒐集到比空載光達 更精密的物體的表面資訊,所以在各領 域的使用上,如在藝術、建築、機械上 的運用就較廣。 然而,透過光達雷射測距的方式, 所蒐集到的資料是一群點狀分佈的資料 型態,即所謂的點雲。資料的組成主要 有空間三維坐標(X,Y,Z),及強度值 I 等四個值。在資料儲存上,是以記錄每 個光達點的三維坐標,反射強度值為 主,有些可記錄每個光達點的 R、G、B 三個波段的色階值;但透過這些數值資 料,仍不易瞭解其內涵,尚須透過資料 的再處理,才能看出資料的全貌。 對地面光達所掃得的點雲資料而 言,當被測物無法一次涵蓋全範圍掃瞄 時,需結合多測站資料,才能涵蓋完整 範圍,此時所要解決的問題是如何有效
連結不同測站的資料。目前所知的方法 主要有四:共軛面轉換法、磁性覘標控 制點法、測站後視稜鏡法,及曲面匹配 法四種(曾義星、史天元,2002)。而在 經過資料整合之後,此時點雲資料還屬 於隱性資料,仍無法從這些點位的數值 坐標,看出些被掃瞄物的具體型態,需 要模組化的處理這些三維坐標資料後, 才得以具體描述被掃瞄之物體。 所謂的模組化,是指將點雲資料從 點型態,結合成線結構、面結構、或是 立體結構等,以利進一步的後續分析。 而其必要性在於,因為對於被掃瞄物體 的空間資訊,往往就無法從原始點雲資 料中直接獲得,必須過濾、處理這些原 始的點位資料,才能萃取出所需的物體 三維資訊。再者,光達點雲資料由於是 記錄每個光達點的三維資料,在掃瞄密 度及解析度高的情況下,所記錄的筆數 往往可能高達數百萬甚至數千萬筆等, 電腦硬體及處理軟體的相對處理能力往 往就受到了限制,且由於資料目的的不 同,對於一些非必要的細節部分可予以 刪減,藉由模組化的過程,可刪除雜訊、 非掃瞄標的物的點雲群,甚至標的物內 的多餘資訊,以加快資料在處理、展示 上的速度。 目前一般掃瞄儀廠商所提供的資料 處理軟體,多半可以達到資料瀏覽、點 位資料的查詢、分析功能,或是提供一 些簡單的模型原件來模組化,甚至一些 支援軟體會因不同的目的,設計出不同 的模型原件庫,以適應實際上的狀況, 但這些支援軟體往往都索價不斐。 本研究因此採用地面光達掃瞄物體 平面所得資料,透過其分佈的特性,以 描述平面在空間中的分佈方位。 由上所述,本研究之目的在:利用 三維坐標(X,Y,Z)的空間特性,重新結 構化點雲,萃取出所需的平面資訊。再 透過與實際模擬平面的比較,以瞭解擬 合平面與實際平面的差異,進而探討平 面的優劣對於後續模型的影響。 三、結果與討論 (一)實驗儀器 本研究使用儀器為 Leica 所製造的 HDS3000,如圖 1 所 示 , 處 理 軟 體 為 Cyclone 5.4。 圖 1、地面光達 HDS3000 (二)研究設計 為了測試掃瞄結果與實際的差異, 實驗中採用以全測站與光達兩種不同儀 器,對同一平面取樣。並以兩種取樣結 果,計算擬合平面。由於光達的坐標系 統為任意坐標系統,與全測站的坐標系 統並不一致,故須先統一兩坐標系統, 才能比較兩者。本研究採用位於掃瞄平 面之外的適當處,建立兩坐標系統轉換 的共軛點來連結,其原理是利用儀器於 取樣時,同時觀測共軛點,並以此為基 準,以三維坐標轉換方式,轉換兩組資 料為相同坐標系統。本研究同時設計兩 理想平面,以供測試驗證,如圖 2 與圖 3 所示。
圖 2、利用垂直平面測試 圖 3、利用水平平面測試 (三)平面參數的計算 在統計中,假若資料的分佈有一定 的趨勢,則可採用擬合(Fitting)方式, 藉由一個已知的數學函數,描述整個分 佈情況。對地面光達而言,所搜集的點 雲資料,其分佈同樣也會符合物體表面 的幾何特性,有一定的分佈趨勢,故可 針對不同的幾何特徵,以相對應的數學 函式表示。以研究中所採用的平面特徵 為例:設幾何平面方程式為 d cz by ax+ + = 其中, 為資料的三維坐標, 為未知量變數,經比例調整 將未知數個數縮減為三個,公式改為 ) , , (x y z ) , , , (a b c d d d z d c y d b x d a + + = 1 z c y b x a′ + ′ + ′ = 假設每一筆點資料皆為等權觀測 量,代入平面方程式中,以最小自乘法 求解平面方程式參數(a, b, c),則觀測 方程式為 ⎥ ⎥ ⎥ ⎥ ⎦ ⎤ ⎢ ⎢ ⎢ ⎢ ⎣ ⎡ + ⎥ ⎥ ⎥ ⎥ ⎦ ⎤ ⎢ ⎢ ⎢ ⎢ ⎣ ⎡ = ⎥ ⎥ ⎥ ⎦ ⎤ ⎢ ⎢ ⎢ ⎣ ⎡ ′ ′ ′ ⎥ ⎥ ⎥ ⎥ ⎦ ⎤ ⎢ ⎢ ⎢ ⎢ ⎣ ⎡ ⇒ + = n n n v v v c b a z z z y y y x x x V L AX M M M M M 2 1 2 2 1 2 1 2 1 1 1 1 再以法方程式求解 X
( )
n m V V S L AX V L A A A X T T T − = − = = − 0 1 其中, m 為觀測方程式個數,n 為點之個 數,最後以平差所得的解表達此一平面 的法向量。 (四)三維坐標轉換 由於光達掃瞄時,其坐標系統是隨 著當時的定義而定,若要與全測站比 較,兩者的坐標系統必須一致,為了確 保資料的位相關係,不因坐標轉換而改 變,一般多採行七參數轉換,也就是三 維正形轉換,藉由兩坐標系統相同共軛 點的坐標轉換,以求取七個轉換參數 ) , , , , , , (S ω φ κ Tx Ty Tz 其公式如下: ⎥ ⎥ ⎥ ⎦ ⎤ ⎢ ⎢ ⎢ ⎣ ⎡ + ⎥ ⎥ ⎥ ⎦ ⎤ ⎢ ⎢ ⎢ ⎣ ⎡ ⎥ ⎥ ⎥ ⎦ ⎤ ⎢ ⎢ ⎢ ⎣ ⎡ = ⎥ ⎥ ⎥ ⎦ ⎤ ⎢ ⎢ ⎢ ⎣ ⎡ z y x T T T z y x m m m m m m m m m S Z Y X 33 32 31 23 22 21 13 12 11上式非為線性方程式,須先線性化,並 設定初值才能求解。故觀測方程式改為 下式,以迭代方式求解七個改正數。 ⎥ ⎥ ⎥ ⎦ ⎤ ⎢ ⎢ ⎢ ⎣ ⎡ − − − = ⎥ ⎥ ⎥ ⎥ ⎥ ⎥ ⎥ ⎥ ⎥ ⎦ ⎤ ⎢ ⎢ ⎢ ⎢ ⎢ ⎢ ⎢ ⎢ ⎢ ⎣ ⎡ ⎥ ⎥ ⎥ ⎥ ⎥ ⎥ ⎥ ⎦ ⎤ ⎢ ⎢ ⎢ ⎢ ⎢ ⎢ ⎢ ⎣ ⎡ ⎟ ⎠ ⎞ ⎜ ⎝ ⎛ ∂ ∂ ⎟ ⎠ ⎞ ⎜ ⎝ ⎛ ∂ ∂ ⎟ ⎠ ⎞ ⎜ ⎝ ⎛ ∂ ∂ ⎟⎟ ⎠ ⎞ ⎜⎜ ⎝ ⎛ ∂ ∂ ⎟⎟ ⎠ ⎞ ⎜⎜ ⎝ ⎛ ∂ ∂ ⎟⎟ ⎠ ⎞ ⎜⎜ ⎝ ⎛ ∂ ∂ ⎟ ⎠ ⎞ ⎜ ⎝ ⎛ ∂ ∂ ⎟ ⎠ ⎞ ⎜ ⎝ ⎛ ∂ ∂ ⎟ ⎠ ⎞ ⎜ ⎝ ⎛ ∂ ∂ ⎟ ⎠ ⎞ ⎜ ⎝ ⎛ ∂ ∂ ⎟ ⎠ ⎞ ⎜ ⎝ ⎛ ∂ ∂ ⎟ ⎠ ⎞ ⎜ ⎝ ⎛ ∂ ∂ 0 0 0 z y x 0 0 0 0 0 0 0 0 0 0 0 0 Z Z Y Y X X dT dT dT d d d dS 1 0 0 0 1 0 0 0 1 Z Y X Z Y X Z Y X S Z S Y S X κ φ ω κ κ κ φ φ φ ω ω ω (五)平面間距 實驗中主要藉由兩平面之間的間距 變異,來判別平面的差異:假設 A 點位 於參考平面,則 A 到擬合平面的最短距 離,會隨著平面夾角θ的大小、以及 A 點到平面交線的距離不同而有所改變。 本文是透過光達點的分佈位置,界定實 際平面在空間分佈的範圍,並僅計算此 範圍內的平面差距。如圖 4 所示,計算 流程如下: (1)計算各光達點 P 投影到參考平面 的垂足 S。 (2)令直線 L 為光達點 P 與 S 的連線, 與參考平面垂直相交於 S,與擬合 平面相交於 s。 (3)計算 S 與 s 之間的距離 d,將 d 視 為該空間位置的平面間距。 (4)最後計算所有光達點 P 的平面間 距 d 的平均值。 圖 4、平面間距示意圖 (六)比較平面差異 表 1、垂直平面間距表(單位:m)
組別 Mean Std Max Min
(A) -0.0007 0.0002 -0.0004 -0.0010 (B) -0.0018 0.0004 -0.0009 -0.0025 (C) -0.0003 0.0003 0.0004 -0.0010 (D) 0.0031 0.0001 0.0033 0.0028 (E) 0.0043 0.0001 0.0046 0.0040 表 2、水平平面間距表(單位:m)
組別 Mean Std Max Min
S 0.0008 0.0002 0.0013 0.0001 L 0.0006 0.0002 0.0011 0.0000 M 0.0008 0.0004 0.0016 -0.0002 H 0.0017 0.0003 0.0023 0.0009 由平面間距的相關統計值,Mean 可判定兩平面之間的平均間距,由 Std 可大致看出間距大小的離散程度。當 Mean 趨近於 0,表示兩平面越接近重 疊。Std 趨近於 0,表示每一間距的大小 一致,也就是兩平面接近平行;並以坐 標原點相對於參考平面的位置為基準, 當擬合平面位置介於坐標原點與參考平 面之間,則間距為正;而當參考平面位 置介於坐標原點與擬合平面之間,間距 為負。 實際上,平面間距對於擬合平面的 影響,主要在於後續利用擬合平面建立 向量模型方面。假若利用光達掃瞄一正 方體,並透過平面交會方式,求得特徵 點,進而建立向量模型,此時交會平面 的好壞對向量模型的影響,可透過擬合 平面與實際平面之間的間距平均值及標 準差大小來解釋:間距的平均值表示兩 平面之間的平均距離,假設兩平面相互 平行,若平均值不等於 0,表示擬合平 s4 s3 s2 s1 d4 d3 P1 d2 d1 S2 S3 S4 S1 P4 P3 P2 參考平面 擬合平面 L1 L2 L3 L4
面與實際平面並無重疊,對向量模型的 影響在於比例上的差異,若間距平均值 為正,表示模型將會比實際物體大,若 間距平均值為負,表示模型將會比實際 物體小。間距的標準差大小,則顯示擬 合平面與實際平面的傾斜度,其與夾角 大小成正比。對於向量模型的影響,在 於模型特徵點彼此間的相對位置,是否 能與實際位置保持一致,也就是能否保 持模型形狀與實物相同。 四、計畫成果自評 經由實驗的結果得知,全測站所擬 合的平面較光達所擬合的平面,較能切 合實際水平、垂直的情況。假設由全測 站所擬合的參考平面來代替實際平面, 與光達所擬合的平面比較,在間距的比 較方面,從標準差的大小來看,標準差 皆小於 1mm,顯示平面接近平行;但是 平均值卻從 4mm 到 1mm 以下不等,顯 示利用光達資料的擬合平面,對於模型 而言,可保持物體的形狀,但仍有比例 上的差異。 由於真實的平面參數是無法得知, 實驗中是假設以全測站觀測所得的平面 來替代實際平面,但全測站本身也有其 測量誤差存在,尚不能完全替代實際平 面。另外,目前是透過建立特殊條件的 平面,如垂直或水平,以已知的參數值 作為評估平面參數的好壞。然而目前的 實驗環境經後續評估,並不能達到完全 垂直、水平的條件,因此尚不能有效辨 別誤差的歸屬,是屬於儀器本身限制, 還是平面本身不夠完全垂直或水平所造 成的,有關這一部份,仍待後續研究。 五、參考文獻 1. 林惠玲、陳正倉,2003,『應用統計學』二 版,台北市:雙葉書廊有限公司。 2. 曾義星、史天元,2002,「三維雷射掃瞄儀 技術及其在工程測量上之應用」,『土木水 利』,3(4):1-7。 3. 賴志凱,2004,「地面雷射掃瞄儀的精度分 析與檢定」,國立成功大學測量與空間資 訊學系研究所碩士論文:台南。 4. 李姝儀,2005,「從地面點雲萃取物面角特 徵供多測站資料連結之研究」,國立成功 大學測量與空間資訊學系研究所碩士論 文:台南。 5. 劉嘉銘,2005,「光達點雲資料特徵萃取之 研究」,國立成功大學測量與空間資訊學 系研究所碩士論文:台南。
6. Blais, F., Beraldin, J.-A. And El-Hakim, S. F., 2000, “Range Error Analysis of an Integrated Time-of-Flight, Triangulation, and Photogrammetry 3D Laser Scanning System” SPIE Proceedings, AeroSense, Orlando, FL. April 24-28, 2000.
7. Clark, J and Robson, S., 2004, “Accuracy of measurements made with a CYRAX 2500 laser scanner”, ISPRS.
8. Godin, G., Beraldin, J.-A., Rioux, M., Levoy, M., Cournoyer, L, 2001, “An Assessment of Laser Range Measurement of Marble Surfaces. Proceedings of the 5th Conference on Optical 3-D Measurement Techniques”, Vienna, Austria. October 1-4, 2001.
9. Yuriy Reshetyuk, 2006,”Investigation and
calibration of pulsed time-of-fight terrestrial lasers scanners”, Department of Transport
and Economics, Royal Institute of Technology, Stockholm.
行政院國家科學委員會補助國內專家學者出席國際學術會議報告
報告人姓名 黃灝雄 服務機構 及職稱 國立政治大學地政學系 副教授 時間 會議 地點 9-13 October 2006 蒙古 烏蘭巴托 計畫編號 NSC 95-2221-E-004-014 會議 名稱 (中文)第 27 屆亞洲遙測會議(英文) the 27th Asian Conference on Remote Sensing 發表
論文 題目
(中文)固定站雷射掃描建立三維模型
(英文) Establish A 3-D Model Using Laser Scanner at A Fixed Station
一、會議緣起
第一屆亞洲遙感探測會議(ACRS, Asian Conference on Remote Sensing)1980 年在泰國曼 谷舉辦,之後,輪由亞洲各國主辦,二十餘年來,不曾中斷過。第二十一屆並曾於 2000 年在 台北舉辦。第二十七屆輪由蒙古航空攝影測量與遙感探測學會(The Mongolian Society for Photogrammetry and Remote Sensing)與亞洲遙感探測學會(AARS, Asian Association on Remote Sensing)主辦,地點為烏蘭巴托之成吉思汗旅館(Chinggis Khan Hotel),日期為 2006 年 10 月 9 日至 10 月 13 日。10 月 9 日之開幕式由蒙古教育文化與科技部長 Dr. Oe. Enkhtuvshin 與亞洲遙感探測學會秘書長 Prof. Shunji Murai 主持,與會蒙古貴賓尚有曾為太空人之蒙古議 員 Dr. J. Gurragehaa,其他各國與會貴賓有泰國之 Dr. Suvit Vibulsresth 與 Manu Omakupt、澳 洲之 Bruce Forster、印度之 Narpat Rathore、日本之 Prof. Haruhisa Shimoda、馬來西亞之 Mr. Nik Nasruddin Mahmood、瑞士之 Prof. Armin Gruen、英國之 Prof. Ian Dowman、越南之 Ngyuen Dinh Duong 等,皆為遙測界之著名學者。中華民國航空測量與遙感探測學會理事長陳哲俊教授並 應邀於開幕當天下午發表“福爾摩沙衛星的展望"(Prospect of FORMOSAT)。 二、會議經過 本次會議共有 22 個國家、389 名與會者,主要參加國家為亞洲地區的國家,亦有少數歐 美國家的專家學者與會,來自台灣的約有八十餘名,僅次於來自日本的 90 名;若包含眷屬, 來自台灣的為出席人數最多者。 本次會議共 40 個場次,發表論文 294 篇,口頭發表有 36 個場次,168 篇論文;餘則為 海報式發表。會議主題涵蓋 Agriculture, Geology, Urban, Oceanography/Meteorology, Disaster, GIS, Forest, Data Processing, Mapping, Student Session/Educaton, SAR, Environment/Ecosystem, Satellite System, Land Use/Land Cover, Photogrammetry/Lidar, Thematic Processing modeling and Analysis of Remotely Sensed Data, Hydrology/Water, Improvements in referencing geospatial data:Latest status, Virtual Reality, New Satellite Imagery, 3D Modeling 等與航空攝影測量、遙感 探測、測量、空間資訊領域的各種研究。
除了論文發表以外,尚有兩次亞洲遙測學會之代表團會議,台灣代表團由中華民國航空 測量與遙感探測學會理事長陳哲俊教授擔任領隊,工研院劉進金主任與本人擔任顧問。代表
團會議主要結論如下:2007 年亞洲遙感探測會議確定 11 月 12 日至 16 日於馬來西亞之吉隆 坡舉辦;2008 年則將於斯里蘭卡的可倫坡舉行。代表團會議另有下列建議: (一)鼓勵政府與私人機構參加亞洲遙感探測會議; (二)加強全球議題; (三)自動化建立數值地形模型、影像正射、特徵目標萃取等列為研討會主題; (四)加強專業訓練(Tutorial)、技術移轉平台、學生研討論壇等活動; (五)第三十屆會議時,出版紀念刊物,包含亞洲大陸之無雲鑲嵌遙測影像,亞洲各國 首都之遙測影像地圖等。 三、與會心得 (一)會議主題涵蓋範圍甚廣,包括各種航遙測技術與空間資訊領域的研究與應用,惟特 點明顯可見遙測系統之多元感測與應用。與會學者專家來自世界各國,雖有不同的 文化背景、使用不同語言,以及不同的專長領域,惟熱心的貢獻研究心得則為共通 的特質,不論會中、會餘,均樂於與他人分享研究心得。 (二)本次研討會的國際文化交流夜,台灣團的年輕學子表演熱烈,展現合作無間的團隊 默契,以及活潑熱情,得到大會表演首獎的榮譽,使所有參與的團員都感到很光榮。 類似之國際研討會實應鼓勵年輕學子勇於參與,讓他們早日接受國際的刺激,並將 有助其餘學術研究上的發展。 四、攜回資料名稱及內容 研討會論文集光碟。 五、報告內容如附。
Establish A 3-D Model Using Laser Scanner
At A Fixed Station
Hao-Hsiung Huang
Associate Professor, Department of Land Economics National Chengchi University
64, Sec.2, ZhiNan Rd., Wenshan, Taipei, 11605, China Taipei
Wei-Kai Fang
Graduate Student, National Chengchi University
64, Sec.2, ZhiNan Rd., Wenshan, Taipei, 11605, China Taipei
Key Words: laser scanner, 3-D model, 3-D conformal coordinate transformation.
ABSTRACT: To establish a 3-D model without moving laser scanner has been the primary motivation of this study. Compared with traditional ground surveying instruments, laser scanner can be used to collect object’s spatial information in an efficient way. However, when using a laser scanner, it still needs multi-viewpoint way to establish the 3-D model completely. In general, the laser scanner has to be set up at more than two stations, and the data scanned by different
viewpoint should be joined together to complete the scan work.
On the other hand, assume that an object can be rotated, its different part can be scanned using a laser scanner set up only one time. The scanned data can be joined together and generated a 3-D model of the object by using three dimensional conformal coordinate transformations. The whole procedure will be explained in this paper. Results generated from scanning at only one station will also be compared and analyzed.
1. Introduction
The most significant difference between ground-based and airborne LiDAR is that the ground-based LiDAR needs to be fixed on the ground when scanning. To complete a scan of any stationary object, the operator has to move the scanner several times at different viewpoints since LiDAR can only acquire data from the visible side of the object.
In reality however, the ground-based LiDAR may weighs 17kg and for an average person to set and reset over different viewpoints requires careful handling, time to reset, and laborious work. If the object to be scanned covers a mass area such as a building, the operator would have no choice but to move the LiDAR around the building to acquire all the possible viewpoint of the building. But, if the object can change its orientation at one site instead of moving the LiDAR, would it be more labor saving while acquiring the same efficiency? In this study, an experiment was conducted
by changing the orientation on a remote-controlled helicopter while the ground-based LiDAR stay in the same orientation during an on going scanning operation.
2. Experiment theory
When scanning with LiDAR, there are two procedures to be done to create useful data.
Firstly, determine the viewpoint. To acquire enough points to form an object model, LiDAR has to scan at least two different viewpoints. The exact number of viewpoints is determined on the shape and size of the object to be scanned. More complex shapes require more viewpoints to incorporate more surfaces while simple shapes require less. The number of viewpoints should be chosen adequately, since more data means more data processing and more accumulation of systematic errors.
Secondly, how to connect point from different viewpoints. To use the points acquired to form an actual model, there are two major methods that could be applied:
- Connect point to point: through Iterative Closest Point method (ICP) and find the smallest distance RMSE among two data
- Connect by feature: by extracting points, lines, and plane from the point clouds and match against each other. Connect by point feature is the most commonly used. It is done by setting target in adequate positions and search the adjacent points from scans to connect different data ICP does not need target points. But, in order for ICP to achieve idea results, the two point clouds from two different viewpoint scans must have more similar points and often take longer time in post processing. Even though it take longer time to find ideal target in the second method, the post processing is just coordinate transform and accuracy check and is much faster than the first.
2.1 Three-dimensional conformal coordinate transformation
In theory, the Z-axis in the point cloud’s coordinate system is perpendicular to the earth surface. But, take account of the error in tilt and earth’s curvature, Z-axes in any two set of point clouds would not likely be parallel to each other. To correct this, a 3D conformal coordinate transformation is
applied to calculate the parameter of (S,ω,φ,κ,Tx,Ty,Tz).
φ ω φ ω φ κ ω κ φ ω cos cos cos sin sin cos sin sin sin cos 33 32 31 23 = − = = + = m m m m κ ω κ φ ω κ φ κ ω κ φ ω κ ω κ φ ω κ φ cos cos sin sin sin sin cos sin sin cos sin cos sin cos cos sin sin cos cos 22 21 13 12 11 + − = − = + − = + = = m m m m m ⎥ ⎥ ⎥ ⎦ ⎤ ⎢ ⎢ ⎢ ⎣ ⎡ + ⎥ ⎥ ⎥ ⎦ ⎤ ⎢ ⎢ ⎢ ⎣ ⎡ ⎥ ⎥ ⎥ ⎦ ⎤ ⎢ ⎢ ⎢ ⎣ ⎡ = ⎥ ⎥ ⎥ ⎦ ⎤ ⎢ ⎢ ⎢ ⎣ ⎡ z y x T T T z y x m m m m m m m m m S Z Y X 33 23 13 23 22 12 31 21 11
2.2 Examine accuracy
But after the initial processing, the coordinate system is still in free coordinate system. Therefore, for the data to be available for analyzing, the coordinate system from the scans are required to be transformed to ground coordinate system and then re-measure and re-calculate the target to compute the RMSE accuracy.
3. Experiment design
The objective of this experiment is to scan a remote-controlled helicopter with the Leica HDS3000 LiDAR and recreate a 3D model using post processing software “Cyclone 5.4”.
When scanning, the size of the target and the object surface are taken into account as physical limitations. The target size is predefined to 7.5cm in diameter and because of it size can not be placed anywhere onto the helicopter itself due to the lack of flat surfaces.
The helicopter is first mounted on a rectangular box. The targets are placed on all sides of the rectangular box and none on the helicopter. During the scanning operation, LiDAR will scan the helicopter and the rectangle box as one solid entity. After the operation, all point-cloud data have be merged and processed to remove any part of the point cloud data that does not resemble the
helicopter. The entire operation took 4 scans on object. When scanning, the rectangular box was set so that one corn was facing the LiDAR, allowing LiDAR to scan in two sides of the helicopter and the box. Following figures represent the helicopter’s and rectangular box’s respective orientation.
Figure 1: S1’s viewpoint Figure 2: S2’s viewpoint
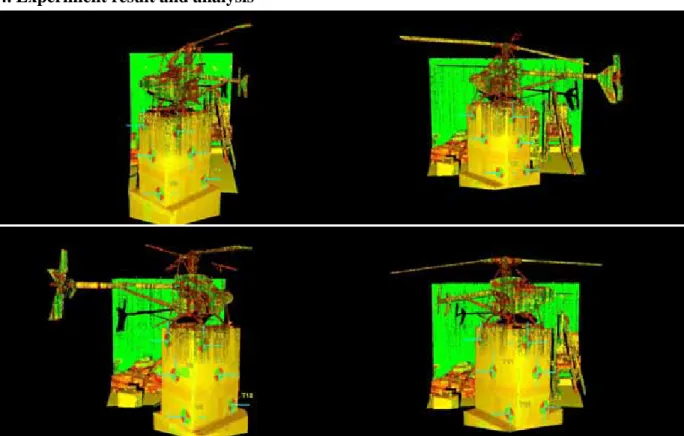
4. Experiment result and analysis
Figure 5: The helicopter’s raw data from 4 viewpoint scans and the blue crosses represent the position of the control points.
Figure 6: Represents the initial result in raw data from the 4 scans after coordinate transform.
Figure 7: The result that is after deleting unnecessary data. The frame of the helicopter is formed and the every height value range is represented by different color.
5. Integrate accuracy analysis
The quality of the result object model is evaluated by the integrated accuracy among control points. Two transform methods were used and described as the following sections.
5.1 Transform method one
By using a total station and assuming that all coordinate is in ground coordinates system, all 12 control points are measured. Then, all the coordinate are changed into S1 coordinate system and divided into two groups. T1 to T6 coordinate are used for coordinate transform while T7 to T12 are used to examine coordinate differences. The result is display below:
Table 1: Twelve control points transform to S1’ coordinate system (Unit: m) TargetID X Y Z RMSE T7 -0.0032 -0.0098 -0.0060 0.0120 T8 0.0045 -0.0082 -0.0050 0.0106 T9 0.0133 -0.0077 -0.0034 0.0157 T10 -0.0090 -0.0134 0.0040 0.0166 T11 0.0051 -0.0197 0.0092 0.0223 T12 0.0213 -0.0244 0.0127 0.0348
The RMSE is set to the range of 5mm and in this range shows a steady accuracy. When comparing X, Y, Z, Y’s proportion in RMSE is larger than X and Z. According to the scanner’s position, Y is related to distance while X and Z are related to horizontal and vertical angles. In the case where there is short distance and small angle, the affect on distance is always larger than angles which explain why Y’s error is the larger in this experiment.
5.2 Transform method two
This method changes the coordinate system into the object coordinate system. Each scan has six control points, three for transform and others for accuracy. By using this method, it does not take into account of how to connect different scans, which reduces the number of times and error accumulation in post processing.
Table 2: Four scans transform respectively into object coordinate system (Unit: m)
SW ID X Y Z RMSE SW ID X Y Z RMSE T1 0.0003 0.0003 -0.0003 0.0005 T7 0.0003 0.0026 0.0024 0.0036 T2 -0.0001 -0.0002 0.0001 0.0003 T8 -0.0004 0.0044 0.0012 0.0045 S1 T3 -0.0012 -0.0001 -0.0010 0.0016 S2 T9 -0.0004 0.0035 0.0007 0.0036 T1 0.0171 -0.0145 0.0008 0.0225 T7 0.0009 -0.0021 0.0014 0.0027 T2 0.0155 -0.0079 0.0046 0.0180 T8 0.0000 0.0007 -0.0002 0.0007 S4 T3 0.0105 0.0014 0.0068 0.0126 S3 T9 -0.0007 0.0024 -0.0015 0.0029 T4 0.0007 0.0010 -0.0004 0.0013 T10 0.0027 0.0154 -0.0018 0.0158 T5 0.0001 0.0015 0.0002 0.0015 T11 -0.0057 0.0145 -0.0040 0.0161 S1 T6 0.0004 0.0025 0.0004 0.0025 S3 T12 -0.0164 0.0132 -0.0088 0.0229 T4 -0.0511 0.0167 -0.0218 0.0580 T10 -0.0013 0.0055 0.0002 0.0057 T5 -0.0401 -0.0032 -0.0134 0.0424 T11 -0.0001 0.0055 0.0014 0.0057 S2 T6 -0.0253 -0.0257 -0.0038 0.0362 S4 T12 -0.0008 0.0049 0.0008 0.0050
But in Table2, the size of RMSE is different than in Table1 and this result in different T1, T2, and T3 in both S1 and S4. This difference will cause the two point clouds to have a bad fit when merged together.
Based upon the results, several conclusions and suggestions are drawn, as follows:
1.According to experiment result, scanning an object at a fixed location is feasible. And based on the integrate image and its accuracy; it has also achieved an acceptable accuracy.
2.Because of the equipment’s limitations, the target needs a specific size when scanning targets to build control points. When choose scan object to scan, even though object’s size isn’t a factor, the location of the control points’ position, and at least three points are needed for differentiate scans. For example, in this experiment, the helicopter isn’t large enough to set targets. Therefore, it is mounted on other rectangular box where targets can be applied on.
3.The control points on any side of the rectangular surface must retain the same distance and angle between any other points of the same side. Otherwise it may cause bias when connect points and transform after each rotation.
4.Perhaps the most important factor of this experiment is control points. By improve the size or quality of the target, the accuracy could be increased accordingly. However, if the control point could be defined as a feature on the scanned object, then there would be more choices when choosing viewpoints.
7. References
1. Boehler, W., Bordas Vicent, M., Marbs, A., 2003. Investigating Laser Scanner Accuracy. Proceedings of XIXth CIPA Symposium.
2. Geoff Jacobs, 2004. The Other “Hidden Instrument” Inside Laser Scanners, Professional Surveyor Magazine, October 2004.
3. Gordon, S., D. Lichti, and Stewart, M., 19-21 March 2001. “Application of a high-resolution, ground-based laser scanner for deformation measurements”, The 10th FIG International Symposium on Deformation Measurement.
4. Johansson M., September 2002. “Explorations into the Behavior of Three Different High-Resolution Ground-Based Laser Scanners in the Built Environment”, ISPRS Commission V.
5. Paul R. Wolf, 1997. Adjustment Computation: Statistics and Least Squares in Surveying and GIS, John Wiley & Sons, Inc.pp.347-353.
6. Soon-Yong Park, Murali Subbarao, 2004. “Automatic 3D model reconstruction based on novel pose estimation and integration techniques”, Image and Vision Computing 22, pp.623-635. 7. Tucker C., 2002. “Testing and Verification of the Accuracy of 3D Laser Scanning Data”,