國立交通大學
工業工程與管理學系
博士論文
整合精實與六標準差方法論於
服務品質之改善與創新設計
Integrating Lean and Six Sigma Methodologies for Service
Quality Improvement and Innovative Design
研 究 生:張哲明
指導教授:蘇朝墩 博士
洪瑞雲 博士
整合精實與六標準差方法論於
服務品質之改善與創新設計
Integrating Lean and Six Sigma Methodologies for Service
Quality Improvement and Innovative Design
研 究 生:張哲明 Student: Che-Ming Chang
指導教授:蘇朝墩 博士 Advisor: Dr. Chao-Ton Su/
洪瑞雲 博士 Dr. Ruey-Yun Horng
國立交通大學管理學院
工業工程與管理學系
博士論文
A Dissertation Submitted to
Department of Industrial Engineering and Management
College of Management
National Chiao Tung University
in Partial Fulfillment of the Requirements
for the Degree of
Doctor of Philosophy
in
Industrial Engineering and Management
May, 2007
Hsinchu, Taiwan, Republic of China
摘 要
在今日蓬勃發展的服務業經濟時代裡,提供顧客高品質與快速的服務已經廣 泛地被許多世界級的公司視為達成卓越企業績效的重要方法。然而,以快速方式 提供高品質服務給顧客的能力,和是否具備良好的服務流程設計有密切的關連。 因此,本研究的目標是基於下列兩個觀點,以發展能夠快速提供高品質服務的服 務流程的方法;其中一個觀點是關於如何改善現有的服務流程,而另外一個觀點 則是和設計或重新設計新的服務流程有關。 首先,針對改善服務流程這個目的而言,本研究探討了兩種當代最新發展的 品質方法,亦即精實生產(Lean Production,簡稱 Lean)與六標準差(Six Sigma)方 法,並且將其整合應用以發展精實六標準差方法論。整合當前品質管理領域中這 兩種最熱門方法的理由,是基於能夠從這兩種方法的個別執行結果中獲得互補性 質的效益。另外,在設計與重新設計新的服務流程這一方面,本研究提出一個整 合精實與六標準差設計(Design for Six Sigma)方法所發展出來的方法論。類似前 述結合精實與六標準差方法的策略,整合應用後者這兩種方法的理由也將被說 明。 最後,藉由三個實務案例的導入說明,以檢驗本研究所發展出來的這兩種整 合式方法論在服務業應用方面的功效。這些案例當中,其中兩個案例是和執行精 實六標準差方法論有關,另外一個案例則是有關精實六標準差設計方法論的執 行。從這些實務案例導入後的效益中,可彰顯本研究所提出這兩種方法論所具有 的效力,同時因此我們相信這些整合性的方法論可適用於服務業的服務流程改善 或設計的任務。 關鍵詞:服務;精實方法; 六標準差方法; 六標準差設計方法。Abstract
In today’s booming service economy, providing customers with high-quality and quick services has been widely recognized by many world-class organizations as an essential means of achieving business excellence. Moreover, the capability of delivering excellent service quality in a fast time-to-market manner is directly tied to a superior service process for the service delivery. Therefore, this doctoral research aims at developing strategies for obtaining the service processes which are capable of fast delivering higher level of service quality based on two different perspectives. One perspective is about how to improve the existing service processes, and the other one is to deal with the issues of new service process design and/or redesign.
Firstly, for the purpose of service process improvement, two state-of-the-art quality approaches, Lean Production (Lean) and Six Sigma were investigated and applied together to developing a Lean Six Sigma methodology. The rationale for the combination of these two popular initiatives in the modern quality management field is based on the complementary benefits obtained from implementing Lean and Six Sigma methodologies individually. On the other hand, to serve the need for designing and/or redesigning new service processes, an integrated methodology was developed by combining Lean with Design for Six Sigma. Similarly to the Lean Six Sigma strategy, an argument for the combined approach was also demonstrated.
Finally, three empirical case studies were conducted to examine the efficacy of these integrated methodologies for their applications to service in particular. Among them, two cases were for the implementation of the Lean Six Sigma methodology, and the other one was then for the application of the Design for Lean Six Sigma methodology. The achievement obtained from implementing these project cases have highlighted the good capabilities of the methodologies proposed in this research, and therefore it is believed that they can be applied to the service field for performing the tasks of process improvement and/or new process design.
Acknowledgments
To those who have contributed to this dissertation, first I would like to express my sincere gratitude to Professor Chao-Ton Su for his helpful guidance and support during the period of conducting my research works. Also, special thanks go to the committee members who have given me their advice that have substantially helped improve the quality of this doctoral dissertation.
In addition, my appreciations are due to the people and their respective organizations as follows: my colleagues at the Department of Business Administration, Ming Hsin University of Science and Technology who shared their thoughts and ideas on my research topics; the executives and managers in those case companies who generously rendered me their resources to facilitate the processes of case studies. Without their support and assistance, this dissertation will not become a reality.
Last but not least, I am also indebted to my lovely family who always encourage me and have patience with the long process of my doctoral research. Certainly, this is of particular importance when I have to take any challenge while doing my research. I am deeply grateful to have them on my side.
Contents
page Abstract (Chinese) ……….. i Abstract ………... ii Acknowledgments ……… iii Contents ………... iv List of Tables …...….………..…. viList of Figures ………..………..……... viii
1. Introduction ………..……… 1 1.1 Research background ………..…. 1 1.2 Research objectives ………..… 3 1.3 Research framework ………..……... 4 2. Literature Review ……….………..…….. 6 2.1 Lean ………..……… 6 2.2 Six Sigma ………. 9
2.3 Design for Six Sigma ………..…. 13
2.4 The rationale for combining Lean with Six Sigma ……….…. 15
2.5 The rationale for combining Lean with Design for Six Sigma …….... 18
2.6 Measurement of service quality ………..…….. 19
3. Developing Integrated Methodologies …………..………... 21
3.1 Developing a Lean Six Sigma methodology for service process improvement ……….………… 21
3.2 Developing a Design for Lean Six Sigma methodology for service process design and/or redesign ………... 26
4. Empirical Case Studies ……….… 32
4.1 Case: patent filing service ……….……..…. 32
4.1.2 Implementing the Lean Six Sigma methodology ………. 33
4.1.3 The implementation results and discussions …………...……. 43
4.2 Case: IT help desk service ……… 46
4.2.1 The background of the case ……….. 46
4.2.2 Implementing the Lean Six Sigma methodology ………. 46
4.2.3 The implementation results and discussions ……..……..…… 55
4.3 Case: software development process ……… 58
4.3.1 The background of the case ……….. 58
4.3.2 Implementing the Design for Lean Six Sigma methodology ….. 58
4.3.3 The implementation results and discussions …..………..….... 71
5. Conclusion and Future Research ……….. 73
5.1 Conclusion ……… 73
5.2 Future research ………. 74
List of Tables
Table 2.1 Some different versions of DFSS methodology
Table 2.2 The benefits and challenges for Six Sigma and Lean
Table 4.1 Summary of the VOCs in the external customer survey for the patent filing service
Table 4.2 Summary of the VOCs in the internal employee survey for the patent filing service
Table 4.3 Data collected for the process cycle time of the patent filing service Table 4.4 A detailed process map for the patent filing service
Table 4.5 Overall performance of the Lean Six Sigma project for patent filing service
Table 4.6 Breakdown analysis by steps for the process of patent filing service Table 4.7 The financial results of the Lean Six Sigma project for patent filing
service
Table 4.8 The Kano model analysis for the determination of the CTQs Table 4.9 Data collected for the cycle time of the IT help desk service Table 4.10 A detailed process map for the IT help desk service
Table 4.11 Overall performance of the Lean Six Sigma project for the IT help desk service
Table 4.12 Breakdown analysis by steps for the process of the IT help desk service Table 4.13 The financial results of the Lean Six Sigma project for the IT help desk
service
Table 4.14 Summary of the VOCs in the external customer survey for the software development process
Table 4.15 Summary of the VOCs in the internal employee survey for the software development process
Table 4.16 The specification levels for the performance metrics
Table 4.17 A detailed process design map for the software development process
Table 4.18 The results of the performance metrics for the software development process
Table 4.19 The achievement of the company’s goals for the software development process redesign
List of Figures
Figure 1.1 A research framework
Figure 1.2 The occasions of using DMAIC and DMADV methodologies
Figure 2.1 The DMAIC methodology and key tools
Figure 2.2 The framework of DMADV methodology
Figure 2.3 The nature of improvements that may occur in organizations that
practice Lean, Six Sigma, or Lean Six Sigma
Figure 2.4 A comprehensive view on the combination of Lean and DFSS Figure 3.1 A conceptual framework of the Lean Six Sigma methodology Figure 3.2 A conceptual framework of the Design for Lean Six Sigma
methodology
Figure 4.1 The translations of the VOCs into measurable requirements by using QFD
Figure 4.2 A current-state value stream map for the patent filing service Figure 4.3 A future-state value stream map for the patent filing service
Figure 4.4 The cause-and-effect diagram for the problem of long total process cycle time of the patent filing service
Figure 4.5 The main effect plots for identifying the significant root causes of the patent filing service
Figure 4.6 A current-state value stream map for the IT help desk service Figure 4.7 A future-state value stream map for the IT help desk service Figure 4.8 The cause-and-effect diagram for the problem of long service
processing time of the IT help desk service
Figure 4.9 Main effect plots for identifying the significant root causes of the IT help desk service
Figure 4.10 Categorization of the VOCs by using an affinity diagram
Figure 4.11 The translation of the VOCs into measurable requirements by using QFD
Figure 4.12 An initial-state value stream map for Alternative 2 of the software development process
Figure 4.13 A future-state value stream map for Alternative 2 of the software development process
1. Introduction
1.1 Research background
Services have experienced significant growth over the past decades; they now represent a major portion of the economies of the world’s more industrialized nations. Even in lesser-developed countries, the service sector still accounts for a substantial part of their economies (Davis and Heineke, 2003). In addition, the service industries not only have grown in size, but along the way they also have absorbed all the jobs shed by traditional industries such as agriculture, mining, and manufacturing. For instance, by the mid-1990s, the service industries employed nearly 80 percent of the workforce in the United States (Hoffman and Bateson, 2002).
Today, in service applications, the revenue growth potential of improving the speed of and quality of service often overshadows the cost reduction opportunities. However, service processes are typically slow processes, because there is far too much waste such that the costs of services are inflated and service quality deteriorates. Moreover, one of the characteristics of service proposed by Zeithaml et al. (1985) is the heterogeneity, which means the occurrence of variations in the level of service to customers, and it consequently results in poor service quality and customers’ dissatisfaction. These service issues represent a huge opportunity to improve the service quality by increasing the speed of service delivery and reducing the variations in service level.
Meanwhile, according to Ramaswamy (1996), excellent service quality can be achieved by developing a superior service process design. This means that a
well-designed service process is necessary for delivering higher level of service quality. In addition, as highlighted in literature, at least 80 percent of the service quality is committed in the early design phases of the process life cycle (Yang and El-Haik, 2003), and up to 80 percent of the total cost of the service is accrued in the concept development stage of these upfront phases (Fredriksson, 1994). Such research results have motivated recent attention given by various fields to shift from improving the service performance during the later phases of the process life cycle to the front-end design phases where the service was initially developed.
In recent years, Lean and Six Sigma disciplines have been popularized because their successful implementations by many world-class organizations around the world to improve business processes and reap substantial benefits of cost savings. On the other hand, to deliver a higher quality level of service than the rival, Design for Six Sigma (DFSS) works on the early stages of the process life cycle and utilizes the most powerful tools and methods presently known for developing optimized service designs. The major objective of DFSS, when applied to the service field, is to design the service right the first time to avoid painful and costly downstream experiences.
Finally, it was found in a literature study that although it is possible to have independent successes in Lean, Six Sigma, and DFSS, each magnifies the strengths of the other while compensating for the weaknesses when integrated in an overall improvement or design strategy. Therefore, it is the motivation for this research that blending the strengths of Lean and Six Sigma can be synergistic in the context of service process improvement, while the combination of Lean and DFSS can achieve the goal of providing excellent service process designs.
1.2 Research objectives
The primary objectives of this research can be outlined as follows based on the premise described in Section 1.1. Firstly, it aims at developing a unique strategy for improving the existing service processes through a combined approach of Lean and Six Sigma. Next, the focus is placed on the design and/or redesign of new service processes by fusing the powers of Lean and DFSS to develop a Design for Lean Six Sigma methodology. Finally, to demonstrate the efficacy and effectiveness of the two integrated systems, several empirical case studies in the service field are conducted.
Furthermore, a clear rationale for the integration of either Lean with Six Sigma or Lean with DFSS must be provided to justify these combined approaches. First of all, the reason for why we adopted Lean, Six Sigma, and DFSS instead of other quality methods mostly lie on the facts of the successful implementation of each discipline by numerous world-class organizations over the recent past decade. Moreover, the well-proven and previously known principles, methods, and tools used by these methodologies make the deployment strategies we developed more easily to understand and implement. The next level of the question is why we used a combined but not individual approach. The answers to this question have to be clarified and understood before we go into details for the development of an integrated system.
Lastly, one issue also need to be addressed is to explain why these integrated strategies are applicable for the service settings particularly. To work out this issue, we have to start form understanding the basics of the service, and establish a correlation between the service essentials and the strategies we intend to develop. Only after achieving this, then it would be appropriate to position these integrated approaches as being service-oriented. The final task to be done is to prove their
capabilities through practical case studies in the service field.
1.3 Research framework
Prior to starting the research work, it is helpful to provide an overview of the research structure for briefly understanding the philosophies and approaches underlying the overall research process. To fill this need, a research framework was constructed as shown in Figure 1.1.
Improvement of service process Design/redesign of service process Lean methodology Six Sigma methodology (DMAIC) Lean methodology DFSS methodology (DMADV) Service process improvement or design/redesign
Figure 1.1 A research framework
The picture in Figure 1.1 also indicated the methods utilized in the different aspects of this research topic which are service process improvement and design/redesign. For the service process improvement, the five-step methodology of Lean and Six Sigma’s well-known DMAIC methodology are applied together; while a selected DFSS methodology, DMADV, is combined with the Lean methodology for
their applications to service process design and/or redesign.
The occasions of using DMAIC and DMADV methodologies can be further distinguished and depicted in Figure 1.2. The DMAIC methodology should be used when a process is in existence in an organization but is not meeting customer specifications or is not performing adequately. On the other hand, the DMADV methodology should be used when a process is not existence and one is needed to be developed, or when the existing process exists but still doesn’t meet the level of customer specifications. Define No Yes Does a process currently exist?
Figure 1.2 The occasions of using DMAIC and DMADV methodologies
Measure Measure Analyze Improve Control Is incremental improvement enough? Yes Analyze Design No Verify
2. Literature Review
2.1 Lean
The origination of Lean can be traced back to the late 1980s when John Krafcik, a research assistant at the Massachusetts Institute of Technology with the International Motor Vehicle Program, coined the term Lean Production (Marchwinski, 2004). The concepts and practices of Lean Production was pioneered by Toyota Motors after World War II with the emphasis on making products in wider variety at lower volumes with fewer defects. Initially, the publication of the book, The Machine that
Change the World: the Story of Lean Production (Womack et al., 1990) started the
diffusion of some Lean production practices developed by the most competitive auto manufacturers in the world (Sanchez and Perez, 2001). Thereafter, Lean production was studied in other industries (Moore and Gibbons, 1997). Some scholars have even suggested that rapid change industries have adopted lean production versus mass production as a growth paradigm (Duguay et al., 1997).
The objective of Lean Production is to eliminate all forms of waste (Womack et al., 1996) including:
y Overproduction
y Waiting for machines or operators y Transportation waste
y Process waste resulting from inefficient, poorly designed processes y Excessive inventory
y Wasted motions through operators leaving workstations to fetch required
y Waste of rework through producing defects
Similarly to those waste in the manufacturing environment, typically, there are many waste in the service processes such that services are usually delivered at a slow pace. When all the waste are eliminated, the service order cycle time (time from receipt of order to receipt of payment) is compressed. The result is short cycle and delivery times, higher quality, and lower costs.
Some points of view on Lean including the pros and cons can be found in literature. They were summarized as follows.
y Lean thinking provides a way to make work more satisfying by providing
immediate feedback on efforts to convert muda into value. And, in striking contrast with the recent craze for process reengineering, it provides a way to create new work rather than simply destroying jobs in the name of efficiency (Womack, 2004).
y The overarching benefit of Lean is the ability to see cost and lead time reduction opportunities where you never saw them before. Through application of the Lean concepts and tools, the process steps once thought essential are unnecessary, and their costs and delays removable after Lean tools have been applied (George, 2003).
y Lean initiatives are great for boosting productivity, changing a culture and cleaning up factories. Lean brings action and intuition to the table and quickly attacks low hanging fruit with kaizen events (Sanchez et al., 2001).
y Since Lean was essentially defined empirically based on the practices in use at Toyota, it provides more principles than specific tools or methods (Hoerl, 2004). y Lean does not explicitly prescribe the culture and infrastructure needed to
y Lean does not value statistical analysis to reduce variation and bring a process under statistical control (Nave, 2002).
The Lean methodology consists of a five-step thought process which is developed by Womack and Jones (1996) to guide managers through a lean transformation. These steps are:
Step 1: Value
Define value from the perspective of the final customer. Express value in terms of a specific product or service which meets the customer’s needs at a definite price and at an explicit point in time.
Step 2: Map
Identify the value stream, the set of all specific actions required to bring a specific product through the three critical management tasks of any business including the problem-solving task, the information management task, and the physical transformation task. Create a map of the current state and the future state of the value stream. Identify and categorize waste in the current state, and eliminate it.
Step 3: Flow
Incorporate the remaining steps to streamline the value stream. Eliminate functional barriers, reduce interruptions, and develop a process-focused organization that dramatically improves lead time.
Step 4: Pull
When flow is introduced, the ability to design, schedule, and make exactly what the customer wants just when the customer wants it, is established. In other words, let the customer pull products on an as needed basis rather than push products, often unwanted, onto the customer.
There is no end to the process of reducing effort, time, space, cost, or mistakes. Return to the first step and begin the next lean transformation process, offering a product or service which is closer to what the customer really wants.
Many companies were benefited by the implementations of Lean projects. Some successful examples were given as follows.
y Porsche implemented a Lean system in 1993. In the finally assembly area, the space for inventories were reduced from 40 percent to zero, the amount of parts on hand was reduced from 28 days to essentially zero, and parts were held to in the assembly area for about twenty minutes before the completed engine was sent to the final assembly area (Womack and Jones, 1996).
y At Credence Systems, a leading global supplier of automatic test equipment, a work team doubled the output through a bottleneck circuit-card testing work center within six weeks using Lean techniques (Devane, 2004).
y At Pratt’s North Haven, Connecticut, turbine airfoil facility, a Lean program caused overdue parts to fall from $80 million to zero, inventory was cut in half, the manufacturing cost of many parts was cut in half, and labor productivity nearly doubled (Womack and Jones, 1996).
2.2 Six Sigma
Six Sigma was first espoused by Motorola in 1985 when the late Bill Smith, a senior engineer and scientist, came up with the idea of inserting hard-nosed statistics into the blurred philosophy of quality. The result was a culture of quality that permeated Motorola and led to a period of unprecedented growth and sales. The crowning achievement was being recognized with the Malcolm Baldrige National
Quality Award in 1988 (Breyfogle et al., 2001). Although invented at Motorola, Six Sigma has been experimented with by Allied Signal and Perfected at General Electric (GE). The successful implementation of Six Sigma by GE, which has obtained huge cost savings, induced the fervor of pursuing Six Sigma around the world since it afterwards. Six Sigma is now also extensively applied to non-manufacturing processes. The savings from transactional, support, service and other non-manufacturing sectors are significant (Reichfield and Sasser, 1990).
Six Sigma is a methodology that provides business with the tools to improve the capability of their business processes. For Six Sigma, a process is the basic unit for improvement. A process could be a product or a service process that a company provides to outside customers, or it could be an internal process within the company, such as billing or production process. In Six Sigma, the purpose of process improvement is to increase performance and decrease performance variation. This increase in performance and decrease in performance variation will lead to defect reduction and improvement in profits, to employee morale and quality of product, and eventually to business excellence (Yang and El-Haik, 2003).
Recently, there are numerous prominent researchers who have expressed their points of view on Six Sigma in literature, and we extracted some of them as follows. y Six Sigma is a comprehensive and flexible system for achieving, sustaining, and
maximizing business success. It is driven by close understanding of customers’ needs and disciplined use of facts, data, and statistical analysis (Pande, Neuman and Cavanach, 2000).
y The Six Sigma breakthrough strategy is a system that provides managerial,
statistical, and problem-solving methods that enable a company to achieve step function (breakthrough) improvement capabilities (McAdam and Evans, 2004).
y Six Sigma is a highly disciplined process that helps organizations to focus on developing and delivering near-perfect products and services. It is also a change-acceleration process that focuses on pursuing success and the rapid adoption of change (Smith., 2001).
y Strategically, Six Sigma can be defined as a business strategy used to improve business profitability, to improve the effectiveness and efficiency of all operations to meet customers’ needs and expectations (Harry et al., 2000).
y Six Sigma’s limitations are inherent in its nature as a project-oriented,
problem-solving regimen. Six Sigma assumes that the existing process design is fundamentally sound and just needs minor adjustments to be more efficient. That assumption is not the road to dramatic improvement. (Hammer, 2002)
y Daily management is not emphasized and there is no concept of total
participation in Six Sigma. Without the cooperation of the existing organization at the implementation stage, achieving high levels of customer satisfaction could be difficult under Six Sigma (Su et al., 2003).
y Six Sigma cannot dramatically improve process speed or reduce invested capital (George, 2003).
y Six Sigma does not consider system interaction because processes are improved independently (Nave, 2001).
Overall, Six Sigma is a top-down approach that is led by the company Chief Executive Officer, and the roles of the Champion, Master Black Belt, Black Belt, and Green Belt usually organize the infrastructure of a Six Sigma project. The Six Sigma methodology that is most widely used is known as DMAIC (Define, Measure, Analyze, Improve and Control). DMAIC offers a structured and disciplined methodology for solving business problems and enables a business to achieve
extremely low non-conformance rates (Harry and Schroeder, 2000). The Six Sigma tool kit includes a variety of techniques, primarily from statistical data analysis and quality improvement. Many tools are familiar from the era of total quality management; others are more recent and sophisticated (Breyfogle, 1999). New tools will continue to be selectively added from other disciplines, for example, the field of operations research (Hoerl, 2004). A depiction of the purpose, deliverables, and key tools of each step in the DMAIC process are shown in Figure 2.1 (Snee, 2004).
IMPROVEMENT OF EXISTING PROCESSES Specify Determine Implement CTQs, Develop Root Changes to Evaluate System to Define project and Identify Process Causes of Defects Improve Measurement, Maintain Process Estimate Gains Performance Process Capability
Define Measure Analyze Improve Control
KEY DELIVERABLES
CHARTER CTQ’s, GR&R, CRITICAL X’S DEMONSTRATED CONTROL BASELINE IDENTIFIED IMPROVEMENT PLAN CAPABILITY
KEY TOOLS
■ Charters ■ QFD ■ Pr. Maps ■ DOE ■ Control Charts
■ GR&R ■ Control Ch. ■ FMEA ■ Cap. Studies ■ Project
■ C&E ■ Control Plan
Management ■ Cap. Studies ■ Pilots
Figure 2.1 The DMAIC methodology and key tools
Six Sigma success stories abound in a variety of industries. In addition to the well-known achievement of Six Sigma programs at General Electric (GE), the following represent additional examples of the successful Six Sigma implementations. y Six Sigma enabled AlliedSignal to avoid having to build an $85 million plant to fill increasing caperolactan demand, realizing a total savings of $30 to $50
million a year (Harry et al., 2000).
y Lockheed Martin used to spend an average of two hundred work hours fitting a part that covers the landing gear. For years employees had brainstorming sessions that resulted in many seemingly logical solutions. However, none worked. The statistical discipline of Six Sigma discovered a one-thousandth of an inch deviation in the part that caused the problem. Now that it has been corrected, the company saves $14,000 a jet (Devane, 2004).
y Ford Motor’s 2000 annual report: ”In the past year we launched Customer
Driven 6-Sigma, a scientific, data-driven process to uncover the root cause of customer concerns and drive defects … saving the company $52 million.” (Gupta, 2004)
2.3 Design for Six Sigma
Since the inception of Six Sigma at Motorola, many leading companies such as General Electric have consummated operational excellence through their successful Six Sigma project implementation. However, its incremental improvements alone sometimes do not allow an organization to keep up with the rapid pace of changes in the areas of technology, customer demands, and competition (Pande et al., 2000). That is why DFSS has treaded in Six Sigma’s steps as a breakthrough strategy for developing high-quality products and/or services.
DFSS is a rigorous approach to designing products and/or services from the very beginning of the development cycle to ensure that meet customer expectations (Harry and Schroeder, 2000). As a complement to Six Sigma’s improvement methodology, DFSS integrates the characteristics of Six Sigma at the outset of the product and/or
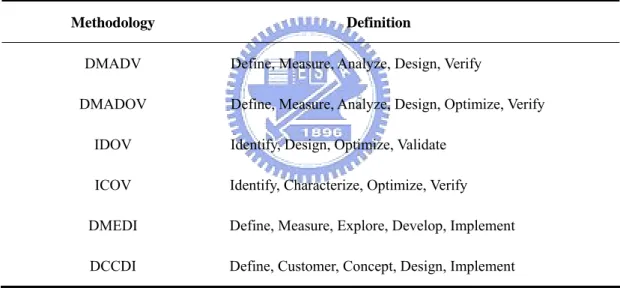
service development process with a disciplined set of tools to achieve Six Sigma performance (Brue and Launsby, 2003). However, unlike the DMAIC methodology of Six Sigma, the phases or steps of DFSS are not universally recognized or defined. In fact, many deploying companies of the Six Sigma philosophy have devised their in-house views of DFSS such that there are different labels of acronyms of DFSS methodology as shown in Table 2.1 (Simon, 2002). The best strategy an organization can take is to understand the critical elements contained within each version of DFSS methodology, and then customize it to fit the organizational culture (Verduyn, 2002).
Table 2.1 Some different versions of DFSS methodology
Methodology Definition
DMADV Define, Measure, Analyze, Design, Verify
DMADOV Define, Measure, Analyze, Design, Optimize, Verify IDOV Identify, Design, Optimize, Validate
ICOV Identify, Characterize, Optimize, Verify DMEDI Define, Measure, Explore, Develop, Implement DCCDI Define, Customer, Concept, Design, Implement
Despite the different versions of DFSS methodology, each one basically uses the same advanced design and production development tools and generates the same deliverables in the underlying phases (Kleinert, 2004). In this paper, DMADV is selected as the fundamental structure to develop an integrated methodology for service process design and/or redesign. The reason for this selection is that DMADV has been a proven and well-established DFSS methodology used among many industries. The framework of DMADV methodology is further depicted in Figure 2.2
(Anonymousa, 2005). Verify the design performance and ability to meet customer needs Design the the process to meet the customer needs Analyze the process options to meet the customer needs Measure and determine customer needs and specifications
Define Measure Analyze Design
KEY TOOLS ● Kano/survey ● Project management tools ● Project selection ● QFD ● FMEA screening ● Pareto analysis ● Benchmarking ● TRIZ ● Brainstorming ● Simulation ● Risk analysis ● Pugh concept selection ● FMEA ● SPC ● Simulation ● FMEA ● SPC ● Control plan KEY DELIVERABLES
● Charter ● CTQs ● Concept ● Detailed ● Prototype Design and Process
Selection Design Verify Define the project goals and customers DMADV
Figure 2.2 The framework of DMADV methodology
2.4 The rationale for combining Lean with Six Sigma
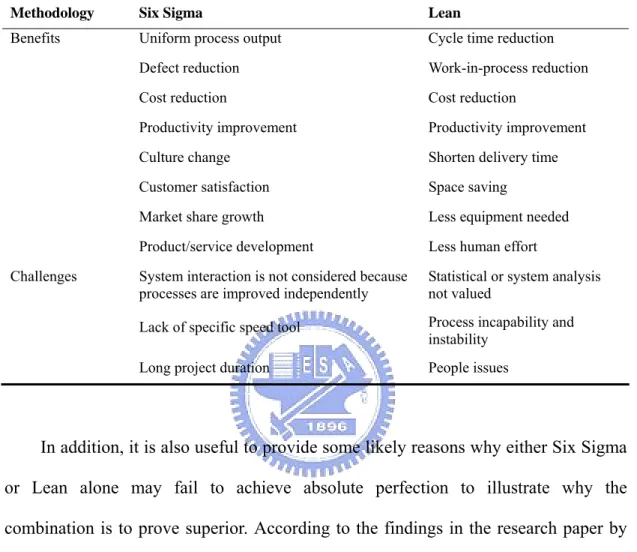
To demonstrate the rationale for the synthesis of Lean and Six Sigma, it was noted in the literature that despite having the potential of reaping individual benefits from the two methodologies, some challenges were also highlighted for Lean and Six Sigma respectively. By examining Table 2.2, which was based on a literature research of publications by McAdam and Evans (2004), George (2003), and Nave (2002), there are some complementary and commonality results obtained by comparing both Lean and Six Sigma approaches. The complementary results emphasized that Six Sigma focuses on reducing process variation and enhancing process control, while Lean drives out waste and promotes work standardization and flow. Nevertheless, because process improvement requires key aspects of both approaches to drive
positive results, they can be reasonably integrated.
Table 2.2 The benefits and challenges for Six Sigma and Lean
Methodology Six Sigma Lean
Benefits Uniform process output Cycle time reduction
Defect reduction Work-in-process reduction
Cost reduction Cost reduction
Productivity improvement Productivity improvement Culture change Shorten delivery time
Customer satisfaction Space saving
Market share growth Less equipment needed Product/service development Less human effort Challenges System interaction is not considered because
processes are improved independently
Statistical or system analysis not valued
Lack of specific speed tool Process incapability and instability
Long project duration People issues
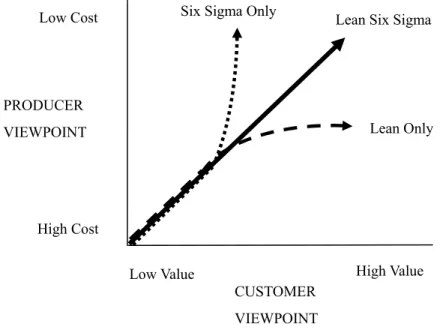
In addition, it is also useful to provide some likely reasons why either Six Sigma or Lean alone may fail to achieve absolute perfection to illustrate why the combination is to prove superior. According to the findings in the research paper by Arnheiter and Maleyeff (2005), some organizations that have embraced either Lean or Six Sigma discovered that they eventually reach a point of diminishing returns. That is, after re-engineering their operating and supporting processes, further improvements are not easily generated. An analysis of such research findings was summarized in Figure 2.3 and depicted in more detail as follows.
Lean Only Six Sigma Only
PRODUCER VIEWPOINT
Low Cost
CUSTOMER VIEWPOINT
Lean Six Sigma
Low Value High Value
High Cost
Figure 2.3 The nature of improvements that may occur in organizations that practice Lean, Six Sigma, or Lean Six Sigma (Arnheiter and Maleyeff , 2005)
The horizontal axis in Figure 2.3 represents the customer’s perspective of value, including quality and delivery performance. The vertical axis represents the producer’s cost to provide the product or service to the customer. Under either system, improvements will be made, but these improvements will begin to level off at a certain point of time. With Six Sigma alone, the leveling off of improvements may be due to the emphasis on optimizing measurable quality and delivery metrics, but at the same time, ignoring changes in the basic operating systems to remove wasteful activities. With Lean alone, the leveling off of the improvements may be due to the emphasis on streamlining product flow, but doing so in a less than scientific manner in the use of data and statistical quality control methods.
Other cases in the literature which supported adopting the Lean Six Sigma strategy for process improvement were obtained from a survey of recent publications. For example, BellSouth Corporation developed a management method which includes the critical elements of Lean and Six Sigma to achieve both operations and process
excellence (Dunphy and Lewis, 2006); Ward (2006) presented a case study which a company that produces injection molded plastic containers for cosmetic industry had shortened production time and reduced raw material costs by adding the Six Sigma approach to a Lean project; Brett and Queen (2005) proposed a strategy which applied the combined approach to improving an enterprise records management process.
2.5
The rationale for combining Lean with Design for Six Sigma
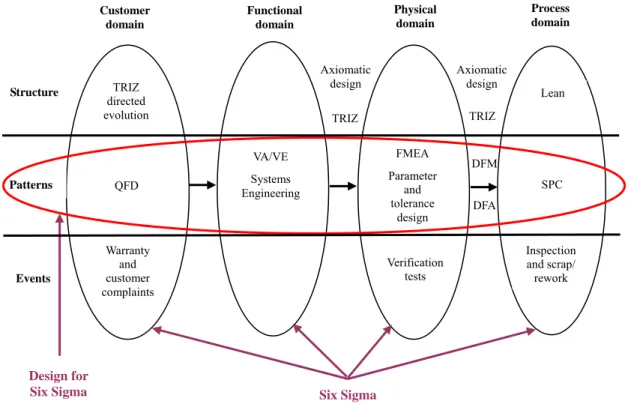
To demonstrate the rationale in favor of the combination of Lean and DFSS, Smith (2001) offered a more comprehensive view on this subject through the framework as shown in Figure 2.4. He attempted to locate each discipline in a two-dimensional array, one related to Suh’s (1990) model for domains of designs, and the other one related to reality perception according to Senge’s (1990) model of Systemic Thinking. The Suh’s model emphasizes a mapping between various domains from customer attributes to functional requirements to design parameters to process variables. On the other hand, the Senge’s model distinguishes the levels of thinking in terms of events, patterns, or structure.
By examining the combined model, it helps justify the appropriateness of integrating Lean and DFSS for designing new services. First, compared with Six Sigma’s focus on problem solving at the event level of thinking, DFSS is used to prevent problems by building quality into the design or redesign process across domains at the pattern level of thinking. Since up to 80 percent of the total cost of the product and/or service is accrued in the upfront design phases (Fredriksson, 1994), more and more organizations have their focus transitions from Six Sigma to DFSS.
Structure Patterns Events TRIZ TRIZ QFD Warranty and customer complaints VA/VE Systems Engineering FMEA Parameter and tolerance design SPC Verification tests Inspection and scrap/ rework DFM DFA Axiomatic design Axiomatic design TRIZ directed evolution Lean Six Sigma Design for Six Sigma Process domain Physical domain Functional domain Customer domain
Figure 2.4 A comprehensive view on the combination of Lean and DFSS (Smith, 2001)
Next, Lean is identified at the structure level in Senge’s model. Thinking at a level of fundamental structure offers even higher leveraged opportunities to create products and/or services that not only function as intended, but also deliver unprecedented customer satisfaction. When the foundational structure of design is properly established, the methods at the pattern level are much more effective. When pattern level methods work well, the event outcomes become world-class (Smith, 2001).
2.6 Measurement of service quality
It is necessary to define how to measure the service quality prior to the development of an integrated methodology for service process design and/or redesign,
which has a direct impact on the delivery of service quality to the customer. A set of service quality dimensions that is widely cited has been compiled by Parasuraman et al. (1988), and constitutes the basis for measuring the level of service quality. These dimensions of service quality are described as follows (Kurtz and Clow, 1998).
z The tangibles dimension: tangibles focus on the service provider’s physical
facilities, their equipment, the appearance of employees, and communication materials.
z The reliability dimension: reliability reflects the ability of the service firm to
perform the service as promised consistently and dependably.
z The responsiveness dimension: responsiveness refers to the willingness of the
firm’s staff to help customers and to provide them with prompt service.
z The assurance dimension: assurance addresses the knowledge and courtesy of
the company’s employees and their ability to inspire trust and confidence in the customer toward the service provider.
z The empathy dimension: empathy is the service firm’s ability to care and
3. Developing Integrated Methodologies
Now that the rationale for the combinations of both Lean with Six Sigma and Lean with DFSS has been demonstrated in Subsections 2.4 and 2.5, therefore this section will develop an integrated methodology for each purpose of the service process improvement and design and/or redesign respectively.
3.1 Developing a Lean Six Sigma methodology for service
process improvement
Using the well-proven DMAIC technique of Six Sigma and the five-step procedure of Lean, a conceptual framework for the Lean Six Sigma methodology is developed as shown in Figure 3.1, and each step in the methodology is described in turn as follows Identify Value
•
Project charter•
VOC/value•
Translate VOC /value into measurable requirements•
CTQs Pursue Perfection•
Develop a control plan•
Implement the control plan Flow and Pull•
Select a solution to eradicate the significant root causes•
Develop a pull system Determine Root Causation•
Data and process analysis•
Root causes of non-value-added steps•
Significant root causes identified Value Stream Mapping•
Data collection plan•
Current-state map•
Future-state map•
Detailed process map•
Determine Specs. for CTQsDefine Measure Analyze Improve Control
Phase 1: Define/identify value
Step 1: Draft a project charter.
The primary deliverables in the establishment of a project charter include the following items (Pyzdek, 2003):
● business case
● project goals and objectives ● milestones
● project scope, constraints, and assumptions
● team memberships
● roles and responsibilities ● preliminary project plan.
Step 2: Identify the voices of the customers (VOCs)/the customer values.
In this step, both the external customer and the internal employee are fully identified, and their needs are collected and analyzed.
Step 3: Translate the VOCs into measurable requirements.
Because the VOCs could be disorganized, nonspecific, or qualitative in nature, therefore, each of them needs to be translated into a measurable requirement. This task can be accomplished by using the quality function deployment (QFD) tool (Mizuno and Akao, 1994).
Step 4: Identify the critical-to-quality characteristics (CTQs).
Among the measurable requirements, identify the CTQs, which represent the relatively important ones to service quality based on the perspectives of both customers and employees.
Phase 2: Measure/value stream mapping
Step 1: Create a data-collection plan and gather data.
Before the start of data collection, a data-collection plan is developed to determine such issues as sampling frequency, the measuring instruments and the format of data-collection form. Then, collect data in order to measure the CTQs, which are under observation.
Step 2: Construct a current-state value stream map.
A current-state value stream map shows work processes as they currently exist. This is vital both to understand the need for change and to understand where opportunities exist.
Step 3: Construct a future-state value stream map.
A future-state value stream map deploys the opportunities for improvement identified in the current-state map to achieve a higher level of performance.
Step 4: Develop a detailed process map.
Some limitations exist in value stream mapping. For example, it does not begin to capture all specific actions, and it is a technical tool which lacks the capability to address non-technical and/or human issues (Anonymousb, 2004).
Step 5: Determine the specification levels for CTQs.
This step is to set the goals for achieving the desired or acceptable levels of service quality for both customers and employees.
Phase 3: Analyze/determine root causation
Step 1: Conduct data and process analysis.
Examine the data collected and the detailed process maps to characterize the nature and extent of the defects occurring in the service delivery process.
Step 2: Identify root causes of non-value-added steps.
Identify and validate the root causes of why the defects occur in the non-value-added steps.
Step 3: Determine the significant root causes.
Among the root causes identified, the significant ones are determined and given a first priority of being removed from the service processes.
Phase 4: Improve/flow and pull
Step 1: Eliminate the significant root causes.
Select a solution to eradicate the significant root causes that have the most impact on the CTQs.
Step 2: Develop a pull system.
A pull system means the customer pulls the products and/or services on an as needed basis rather than push them onto the customer. A specific sequence for creating a pull system was suggested by George (2003).
1. Identify/confirm the service level we want to achieve, i.e., ask our customers what service level they expect.
3. Determine maximum work-in-process by using Little’s law (Little, 1961).
4. Cap the active work in the process at the maximum work-in-process.
5. Put all incoming work into an input buffer.
6. Develop a triage system for determining which incoming work should be released into the process next.
7. Continue with other process improvements so we can improve completion rate and further reduce lead time.
Phase 5: Control/pursue perfection
Step 1: Develop a control plan.
A control plan is developed to make sure the solutions endure, and control must occur at both the strategic and tactical levels. The typical use of a control chart, run chart (R-chart), or check list can serve this purpose (Gupta, 2004).
Step 2: Implement the control plan.
To facilitate the implementation of the control plan, a few suggestions were made as follows (De Feo and Barnard, 2004).
● Transfer to the operating functions all the updated control plans, etc., and train the people involved in the process in the new procedure. ● Audit the process as well as the new controls periodically to assure
the gains are maintained.
● Transfer the audit function to the operating forces after a suitable period of time, and disband the team with appropriate recognition.
3.2 Developing a Design for Lean Six Sigma methodology for
service process design and/or redesign
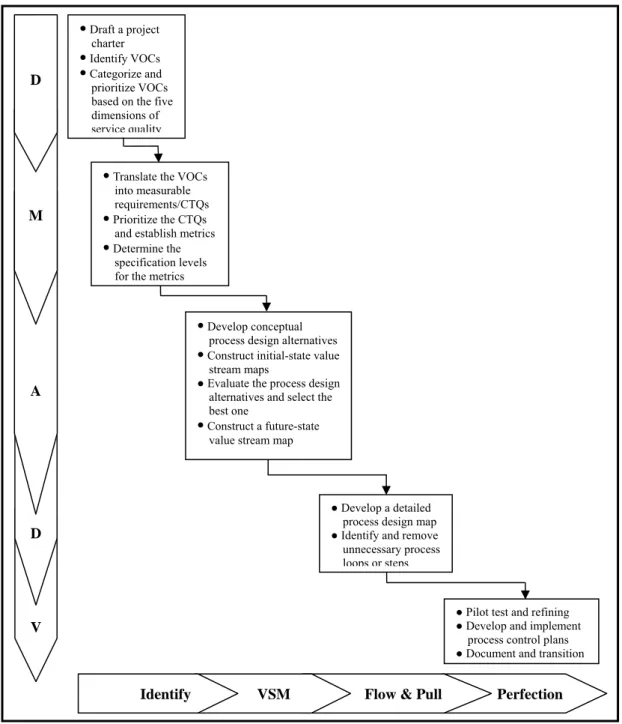
As it was mentioned in Subsection 2.5, the version of DMADV methodology was adopted as a DFSS strategy for its combination with Lean to develop an integrated approach. A conceptual framework of the Design for Lean Six Sigma methodology is delineated in Figure 3.2 as follows.
Identify VSM Flow & Pull Perfection V D A M
● Translate the VOCs into measurable requirements/CTQs ● Prioritize the CTQs
and establish metrics ● Determine the
specification levels for the metrics ● Draft a project
charter ● Identify VOCs ● Categorize and prioritize VOCs based on the five dimensions of service quality
● Develop a detailed process design map ● Identify and remove unnecessary process loops or steps ● Develop conceptual
process design alternatives ● Construct initial-state value
stream maps
● Evaluate the process design alternatives and select the best one
● Construct a future-state value stream map
● Pilot test and refining ● Develop and implement
process control plans ● Document and transition
D
Next, the descriptions of each step in the methodology are given in further detail as follows
Phase I: Define
Step 1: Draft a project charter.
The primary deliverables in the establishment of a project charter include the following items (Pyzdek, 2003):
y Business case
y Project goals and objectives
y Milestones
y Project scope, constraints, and assumptions
y Team memberships
y Roles and responsibilities y Preliminary project plan
Step 2: Identify the voices of the customer (VOCs).
In this step, both external and internal customers are fully identified, and their needs that are valued by either of them are collected and analyzed. Some commonly used tools such as surveys, focus groups, interviews, or market research can be exploited to perform this task (Pande et al., 2000).
Step 3: Categorize and prioritize the VOCs based on the five dimensions of
service quality.
First, examine and screen the identified VOCs based on the five service quality dimensions. If there is any VOC that falls beyond the scope of the five dimensions, then it is set aside for managers to consider for additional action. Next, the prioritization of the VOCs can be obtained
according to customer’s evaluation.
Phase II: Measure
Step 1: Translate the VOCs into measurable requirements/critical-to-quality
characteristics (CTQs).
Each of the screened and prioritized VOCs is translated into a measurable requirement because the VOCs could be disorganized, nonspecific, or qualitative in nature. In addition, all of the translated measurable requirements then become the CTQs that must be satisfied by the design solution. Using the quality function deployment (QFD) method (Mizuno and Akao, 1994), this transformation of the critical customer needs into measurable terms/CTQs can be accomplished.
Step 2: Prioritize the CTQs and establish performance metrics.
The CTQs identified in the last step are further prioritized through the employment of QFD again. Then, applying Pareto analysis (Juran, 1979), the performance metrics are established to measure the performance of the new process design.
Step 3: Determine the specification levels for the performance metrics.
This step is to set the goals for achieving the desired or acceptable levels of the design performance for both customers and employees. The task can be performed along with conducting surveys among the customers and employees, or using benchmarking and competitive analysis within the industry.
Phase III: Analyze
Step 1: Develop conceptual process design alternatives.
Based on the performance metrics established earlier, this step proceeds to generate several conceptual process design options that can deliver the design requirements of the performance metrics. For this purpose, TRIZ technique (Altshuller, 2004) can be applied to creating innovative design concepts particularly when the existing technology or the known process design cannot fulfill all the design requirements satisfactorily.
Step 2: Construct an initial-state value stream map for each process design
alternative.
An initial-state value stream map is utilized to identify the non-value-added activities in the process design alternatives that need to be eliminated, if unnecessary, and to present the opportunities for improvement. By taking advantage of the Lean principles, the non-value-added process activities can be identified and eliminated.
Step 3: Evaluate the process design alternatives and select the best one.
Several process design alternatives and initial-state value stream maps might be generated in the last two steps, and they need to be evaluated to make a final determination on which process design concept will be selected.
Step 4: Construct a future-state value stream map for the selected process design
alternative.
A future-state value stream map exploits the opportunities for improvement identified in the initial-state map to achieve a higher level
of performance. This means once the unnecessary non-value-added activities are eliminated, the remaining activities can be re-sequenced to further enhance the value delivery by the new process flow.
Phase IV: Design
Step 1: Develop a detailed process design map.
Some limitations exist in value stream mapping (VSM) process (Anonymousb, 2004). For example, VSM does not begin to capture all specific actions, and it is a technical tool that lacks the capability to address non-technical and/or human issues. On the other hand, a detailed process design map can help identify the unnecessary loops or steps in the overall process design which may not be discovered in the value stream maps.
Step 2: Identify and remove the unnecessary loops or steps in the detailed
process design map.
Identify the unnecessary process loops or steps in the detailed process design map, if any, and then remove them from the overall process design in order to eliminate the waste in Lean terminology.
Phase V: Verify
Step 1: Conduct pilot test and refining.
Prior to launching the new service process design, a pilot and small-scale implementations can be used to test and evaluate real-life performance.
Control plans need to be developed and implemented to make sure the new process design endures, and control must occur at both the strategic and tactical levels.
Step 3: Document and transition.
As the new process design is validated and process control is established, the full-scale commercial rollout can be started, and the new design, together with the supporting processes, can be handed over to design and process owners, complete with requirement settings, and control and monitoring systems.
4. Empirical Case Studies
In the following subsections of 4.1 through 4.3, three practical case studies were conducted after the integrated methodologies in Section 3 were developed. The purpose for the case studies is to examine the efficacy and effectiveness of the methodologies in their applications to the service field in particular.
4.1 Case: patent filing service
4.1.1 The background of the case
The specific case we focused on is a firm which primarily provides patent filing services for its customer base which is largely in the manufacturing sector in Taiwan. Too often, the firm receives complaints from their customers that the patent filing time interval is usually longer than they expected. With the issue of extra patent filing time needed, the completion date of the patent filing schedule is delayed and a patent rework process needs to be instituted in response to the official requirements by the government. Consequently, this would impact the chance of getting a patent approval and achieving the corporate objective to be among the top ten patent filing service providers in the nation in terms of the annual total number of patents approved. Moreover, when it is possible, customers prefer a stable and consistent schedule for the completion of a patent filing process. Lastly, according to a survey conducted among customers and employees of the patent service firm, the patent engineers in the firm often spent too much time on the processes of correcting technical specifications, writing disclosure documents, and searching reports. This has become a major bottleneck problem in the whole process of the patent filing services.
To resolve these problems, therefore, the company had implemented an improvement project through the use of the Lean Six Sigma methodology as developed in this research. The details for implementing the methodology are described step-by-step as follows.
4.1.2 Implementing the Lean Six Sigma methodology
Phase 1: Define/identify value
Step 1: Firstly, a project team was established with, in total, six members from
patent engineering, legal, finance, and administration, and a project charter was developed at the outset of the project implementation. In the charter, two project goals had been set as follows.
y To achieve an average process cycle time of 75 days and a standard deviation of 3 days;
y To achieve a total cost savings of US$100,170 which includes the hard savings of US$76,610 and the soft savings of US$23,560.
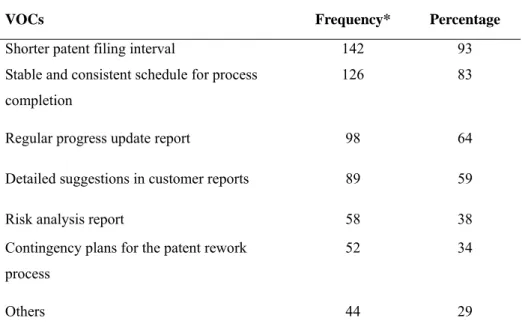
Step 2: Two surveys were conducted among the external customers and the firm’s
employees. Of the 600 external customers sampled, 152 usable responses were received. In addition, an e-mail questionnaire was sent to the 82 patent-related personnel within the firm, and 73 usable responses were collected. Tables 4.1 and 4.2 summarized the VOC results obtained from the external and internal surveys.
Table 4.1 Summary of the VOCs in the external customer survey for the patent filing service
VOCs Frequency* Percentage
Shorter patent filing interval 142 93 Stable and consistent schedule for process
completion
126 83
Regular progress update report 98 64 Detailed suggestions in customer reports 89 59
Risk analysis report 58 38
Contingency plans for the patent rework process
52 34
Others 44 29
* The frequency was accumulated by counting the number of those responses which gave the priority level of at least 4 to each specific item in the VOC (1=not important; 2=low importance; 3=important; 4=high importance; 5=extremely important).
Table 4.2 Summary of the VOCs in the internal employee survey for the patent filing service
VOCs Frequency* Percentage
Cut the time spent by patent engineers on correcting specs., writing disclosure documents, and searching reports
65 89
To be a top-ten patent filing service firm in the nation
59 80 Stabilize the staffing plan during a project
implementation
52 71 Clear-cut action plans at each check point in
the entire process
44 60
Standardize the format of the customer report 35 48 Improve the communication channel with the
client
26 36
Others 18 25
Step 3: Each of the VOCs identified in the last step was further translated into a
measurable item. The results of the translations were shown in Figure 4.1 as the main matrix of the house of quality obtained by using QFD.
Relationships
▲ Strong positive (Score=9) △ Medium positive (Score=3) ↑ Weak positive (Score=1) ↓ Weak negative (Score=1) ▽ Medium negative (Score=3) ▼ Strong negative (Score=9)
Importance to the custom
er (Scale 1-5 ) Cyc le time of the pa te nt filing pr oc ess Sta nda rd de via tion of the pr oc ess c yc le time s
Provided with regular
pr ogress update r eport D et ail ed sugges ti ons cov ere d in cus tomer
report Risk analysis report prep
ared A va il abl e cont ingency p lans for t he pat ent
rework Process cycl
e
effi
ci
ency
Throughput of the patent
s approved annu ally T urnover r ate o f t he p ro je ct te am me m bers
during the project imple
mentation P rov id ed w it h c lea r-cut a ct ion p lans at eac h
check point in the entire
process D egre e o f stan dar di zat ion o f t he for ma t o f t he customer repo rt C yc le t ime o f a com m un icat ion bet ween t he
company and its client
Shorter patent filing interval
5 ▼ ↑ ▲ ▲ ↓ ↑ ▽
Stable and consistent schedule for process completion
5 ▼ ↑ ▽
Regular progress update report
4 ▲ ↓
Detailed suggestions in customer reports
3 ▲ ↓
Risk analysis report
2 ▲ ↓
Contingency plans for the patent rework
2 ▽ ▲ ↑ ↑ ↓
Cut the time spent by patent engineers on correcting specs.,
writing disclosure documents, and searching reports 5 ▼ ▲ ▲ To be a top-ten patent filing service firm in the nation
4 ▼ ▲ ▲
Stabilize the staffing plan during a project implementation
4 ↓ ▽ ▼
Clear-cut action plans at each check point in the entire process
3 ▽ ↓ ↑ ↑ ▲ ↓
Standardize the format of the customer report
3 ▲
Improve the communication channel with the client
2 ▽ ▽ △ △ ▼
Importance weighting
151 66 36 27 18 23 137 142 56 32 27 47
Figure 4.1 The translations of the VOCs into measurable requirements by using QFD
Step 4: By looking into the details of the metrics in Figure 4.1, the candidates for
being the CTQs were identified as the process cycle time, the throughput for the patents approved annually, and the process cycle efficiency.
However, since the process cycle time had a direct impact on the other two metrics, therefore it was determined to be the CTQ.
Phase 2: Measure/value stream mapping
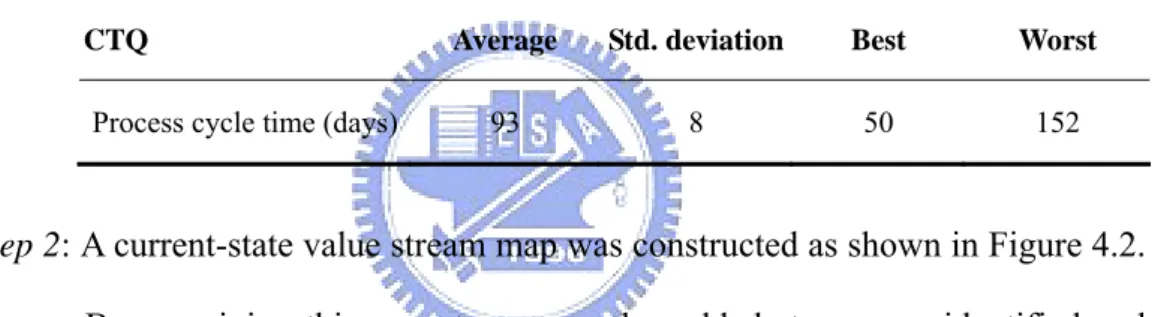
Step 1: Once the CTQ, i.e., process cycle time, was identified, a data collection
plan was then developed and a survey was conducted to gather sample data. In this sample, 70 previous cases during an eight-month period were randomly selected. The data collected was summarized in Table 4.3. Table 4.3 Data collected for the process cycle time of the patent filing service
CTQ Average Std. deviation Best Worst
Process cycle time (days) 93 8 50 152
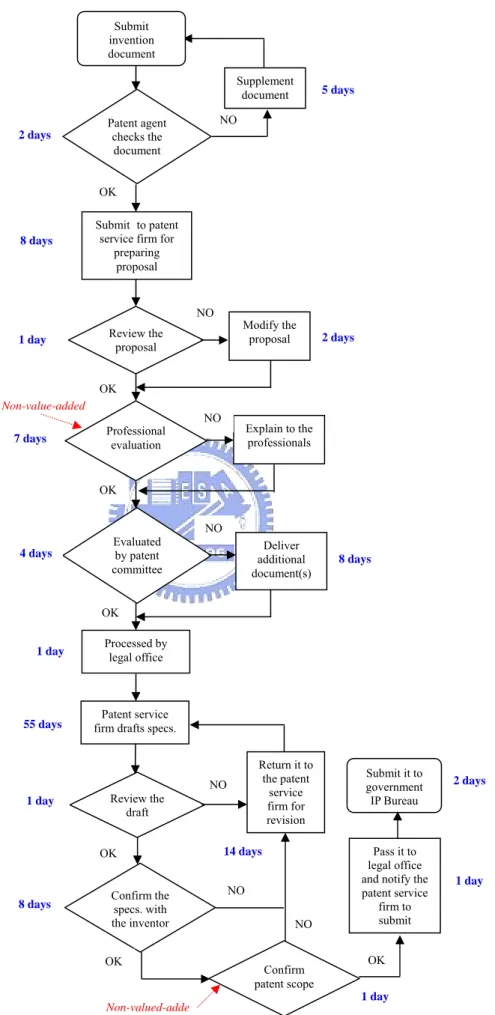
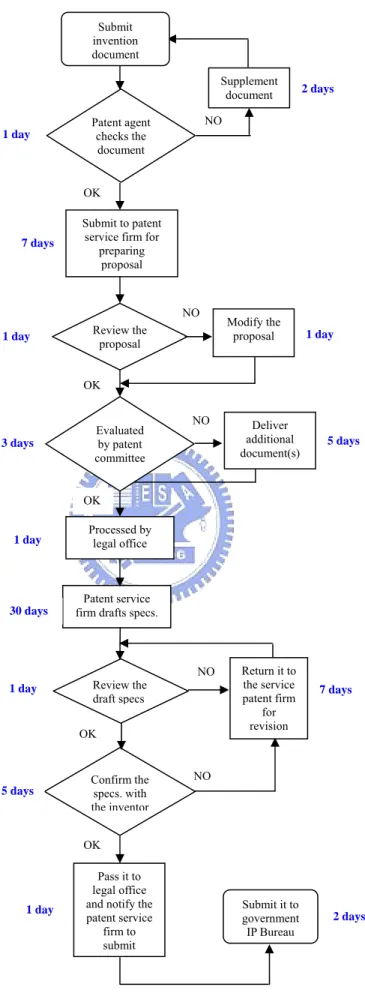
Step 2: A current-state value stream map was constructed as shown in Figure 4.2.
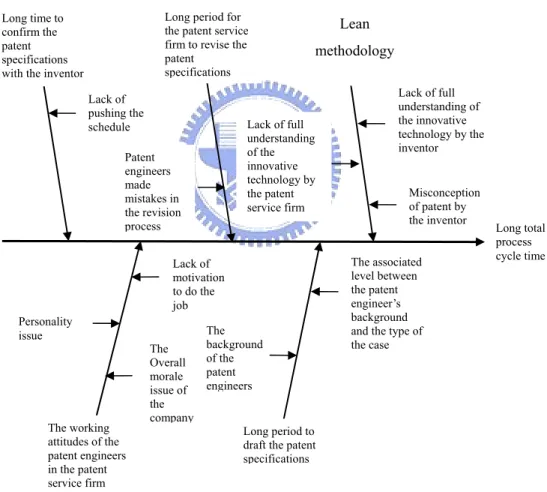
By examining this map, two non-value-added steps were identified and should be eliminated. These steps were the professional evaluation and confirming the patent scope. Moreover, as specified earlier in the case, the time spent on drafting the patent specifications by patent engineers was considered to be too long such that it usually results in a lengthy patent filing interval. This reflected a need to change the process cycle time.
Step 3: Prior to the construction of a future-state value stream map, a survey was
conducted among customers, employees, and competitors to develop an expected time interval for performing each of the remaining value-added activities. A future-state map was shown in Figure 4.3.
Processed by legal office 5 days NO OK Submit to patent service firm for
preparing proposal Review the proposal 1 day 7 days OK Evaluated by patent committee 4 days Modify the proposal OK Professional evaluation Explain to the professionals NO Deliver additional document(s) 1 day Patent service firm drafts specs.
Review the draft OK NO NO Confirm the specs. with the inventor OK 8 days OK NO 1 day 2 days OK Submit it to government IP Bureau Patent agent checks the document 2 days NO Submit invention document Supplement document 2 days Non-value-added Non-valued-adde 8 days 1 day 8 days Return it to the patent service firm for revision Pass it to legal office and notify the patent service firm to submit 1 day NO 55 days 14 days Confirm patent scope
NO
Submit to patent service firm for
preparing proposal Review the proposal 1 day Modify the proposal OK NO Processed by legal office NO Patent agent checks the document 1 day 1 day Evaluated by patent committee Deliver additional document(s) NO Patent service firm drafts specs.
OK OK 7 days 2 days Supplement document 3 days 5 days 30 days Review the draft specs NO OK Confirm the specs. with the inventor 1 day 5 days OK 7 days Pass it to legal office and notify the patent service firm to submit 1 day Submit it to government IP Bureau 2 days Return it to the service patent firm for revision 1 day Submit invention document
Step 4: A detailed process map was developed and shown in Table 4.4. The input
and/or output items in each step of the whole process were identified and established whether or not they are controllable or uncontrollable items.
Table 4.4 A detailed process map for the patent filing service Process step
VA/
NVA Input/output items I/O
Specification levels
Controllable/ uncontrollable Patent agent checks the
invention document
VA Ideas, figures and descriptions of technology inventions
I Attain inventive acceptance level
U
VA Learn and understand the new technology know-how
I Understand all the deficiencies of the technology
U
VA Time to learn the new technology know-how
O U: 3 days L: 1 day
C VA Patentability of the new
technology
O U: lower than 100 points (in check list) L: higher than 50 points
C
VA Success ratio O N/A U
Supplement document VA Time needed to develop supplement document
O U: 7 days L: 2 day
C Submit to patent service firm
for preparing a proposal
VA Comprehension level of patent engineers in the patent service firm about the new technology
I U: zero defects (in check list) L: less than 3 defects
C
VA Time needed to complete the disclosure document O U: 10 days L: 5 days C VA Academic background of patent engineers
I L: must relate to the case type
C VA Working experience of patent
engineers
I L: 2-year experience in patent services
C
Review the proposal by the patent service firm
VA Time needed to review the disclosure document and searching report
O U: 2 days L: 1 day
C
VA Time needed to modify the disclosure document and searching report
O U: 3 days L: 1 day
C
VA % of without modification O N/A U
Professional evaluation NVA Time needed to evaluate the patentability by professionals
O U: 3 days L: 1 day