國
立
交
通
大
學
生化工程研究所
碩
士
論
文
利用計算方法識別蛋白質之乙醯基化位置
Computational Identification of Protein Acetylation Sites
研 究 生:許伯瑲
指導教授:黃憲達 博士
利用計算方法識別蛋白質之乙醯基化位置
Computational Identification of Protein Acetylation Sites
研 究 生:許伯瑲
指導教授:黃憲達 博士
Student:Po-Chiang Hsu
Advisor:Hsien-Da Huang
國 立 交 通 大 學
生 化 工 程 研 究 所
碩 士 論 文
A Thesis
Submitted to Institute of Biochemical Engineering
College of the Biological Science & Technology
National Chiao Tung University
in partial Fulfillment of the Requirements
for the Degree of
Master
in
Biochemical Engineering
July 2008
Hsinchu, Taiwan, Republic of China
利用計算方法識別蛋白質之乙醯基化位置
學生:許伯瑲
指導教授:黃憲達 博士
國立交通大學 生化工程研究所碩士班
中文摘要
對於生物體內的許多生理功能而言,蛋白質之乙醯基化修飾是一種非常重
要且可逆的轉錄後修飾作用,它影響包括酵素的活性及穩定、蛋白質交互
作用、蛋白質與去氧核糖核酸之鍵結、去氧核糖核酸之修復、蛋白質轉錄
作用的調控、細胞凋亡、細胞因子信號傳遞及細胞核物質的輸入。因為利
用生物實驗來辨識蛋白質之乙醯基化極為曠日廢時且耗費實驗資源,為了
能有效並實用的辨識蛋白質之乙醯基化以供往後的研究使用,我們分析了
蛋白質乙醯基化的受質特異性並提出了一個名為N-Ace的蛋白質之乙醯基
化發生位置的辨識系統,來用於辨識蛋白質序列中的丙胺酸(Ala)、甘胺酸
(Gly)、賴胺酸(Lys)、蛋胺酸(Met)、絲胺酸(Ser)及蘇胺酸(Thr)之乙醯基化。
我們利用已知乙醯基化位置的蛋白質序列、結構特徵、物理及化學的特性,
如:蛋白質序列、可接觸表面積、亂度、能量、分子重量、蛋白質序列中胺
基酸的出現比率、空間參數、疏水性、體積、極性、電荷、熱含量及等電
點,並結合支援向量機來訓練計算模型。在模型建立完後,我們使用K-Fold
交叉驗証可證實這些特徵與乙醯基化的發生位置有明顯的關係。此外,蛋
白質之乙醯基化的各別的準確率分別為丙胺酸(Ala)84%、甘胺酸(Gly) 85%、
賴胺酸(Lys)76%、蛋胺酸(Met) 94%、絲胺酸(Ser) 81%及蘇胺酸(Thr) 77%。
最後,我們將最佳準確率的模型整合並建立成一個網頁介面的工具,以供
使用者利用。
Computational Identification of Protein Acetylation Sites
Student:Po-Chiang Hsu
Advisors:Dr. Hsien-Da Huang
Institute of Bioinformatics
National Chiao Tung University
Abstract
Protein acetylation, which is an important and reversible post-translational
modification, affects essential biological processes, including enzymatic activity,
stability, protein-protein interaction, DNA binding, DNA repair, transcription
regulation, apoptosis, cytokine signaling, and nuclear import. However,
experimental identification of acetylation sites is time-consuming and
lab-intensive. In order to identify the protein acetylation sites that could be
useful and insightful for further analysis, we investigate the substrate specificity
of acetylated sites and propose a method, namely N-Ace, for identifying
acetylation sites on alanine, glycine, lysine, methionine, serine, and threonine.
Support Vector Machine (SVM) is adapted to learn the computational models
with the features of amino acids, structural characteristics, and physicochemical
properties surrounding the acetylation sites. K-fold cross-validation indicates
that the structural features, such as accessible surface area (ASA), and physical
and chemical properties, such as absolute entropy, non-bonded energy, size,
amino acid composition, steric parameter, hydrophobicity, volume, mean
polarity, electric charge, heat capacity and isoelectric point are involved in
substrate site specificity. The predictive accuracies of acetylated alanine, glycine,
lysine, methionine, serine, and threonine are 84%, 85%, 76%, 94%, 81% and
77%, respectively. Finally, the constructed models with highest accuracy are
Acknowledgement
我首先要謝謝的是我的指導教授黃憲達博士,謝謝老師在我碩士班期間
學業上的孜孜教誨,讓我可以對生物資訊這方面的領域有,有更深入的了
解。
另外,要感謝實驗室的學長姐、同學及學弟們,謝謝實驗室大家的幫忙,
讓我可以順利的完成論文及學業,有了你們,讓我的研究生生活更加豐富。
然後特別要感謝的是宗夷學長,謝謝你的指導及建議,讓我的論文可以順
利完成。
最後,要謝謝我父母、兄弟姐妹及我的女友的支持,讓我可以遇到低潮
時,順利渡過,謝謝你們。
許伯瑲
于交通大學 2008 年 7 月
Table of Contents
中文摘要 ... i
Abstract ... ii
Acknowledgement ... iii
Table of Contents ... iv
List of Tables ... vi
List of Figures ... vii
Chpater 1 Introduction ... 1
1.1 Background ... 1
1.1.1 Protein Acetylation and Deacetylation ... 1
1.1.2 Nα-terminus Acetylation and Nε-terminus Acetylation ... 2
1.1.3 Histone and p53 Acetylation ... 3
1.2 Motivation ... 6
1.3 Specific Aims ... 7
Chpater 2 Related Works ... 8
2.1 Protein Acetylation Site Database ... 8
2.1.1 dbPTM ... 8
2.1.2 UniProtKB/Swiss-Prot ... 10
2.2 Protien Acetylation Site Prediction Tools ... 12
2.2.1 NetAcet ... 12
2.2.2 Liu et al., 2004 ... 14
2.2.3 PAIL ... 14
Chpater 3 Materials and Method ... 16
3.1 Materials ... 16
3.2 Overview of Method ... 17
3.3 Data Preprocessing ... 19
3.4 Two Stages Support Vector Machine (SVM) ... 21
3.5 Model Learning and Evaluation ... 23
3.5.1 Learning Model by Support Vector Machine (SVM) ... 23
3.5.2 Model Evaluation and Parameter Optimization ... 24
3.6 Independent Test ... 25
Chpater 4 Results ... 27
4.1 Observation of Acetylation Sites ... 27
4.2 Functional Analysis of Acetylated Proteins ... 30
4.3 Predictive Performance ... 31 4.3.1 Predictive Performance of 5-fold Cross-validation with various windows sizes
4.3.2 Predictive Performance of 5-fold Cross-validation based on Amino Acid
Sequence ... 33
4.3.3 Predictive Performance of 5-fold Cross-validation based on Two Stages SVM with Multiple Features ... 34
4.3.4 Predictive Performance of 5-fold Cross-validation based on Two Stages SVM with multiple features and Clustered by Subcellular Localization ... 37
4.3.5 Predictive Performance of Independent Test ... 41
4.4 Summary of Result ... 43
4.5 Web Interface of N-Ace ... 44
Chpater 5 Discussions ... 46
5.1 Comparison to Other Tools ... 46
5.2 Different Ratio of Positive sets and Negative sets ... 48
5.3 Prospective Works ... 49
Chpater 6 Conclusion ... 50
References ... 51
List of Tables
Table 3.1 Data sources from dbPTM ... 17 Table 4.1 The sequence logo of amino acids. ... 28 Table 4.2 The top five GO categories of biological process, molecular function and cellular
component of acetylated proteins. ... 30 Table 4.3 The cross-validation performance of the models trained with amino acid sequence feature. ... 34 Table 4.4 The cross-validation performance of the models trained with selected features
feature and implemented two stages SVM with multiple features. ... 35 Table 4.5 The statistics of acetyltransferases with subcellular localization in dbPTM. ... 37 Table 4.6 The cross-validation performance of the models trained with implemented two
stages SVM with multiple features and clustered by subcellular localization .... 39 Table 4.7 The average performances of our method and other tools based on independent test. ... 42 Table 4.8 The selected models with the highest accuracy. ... 44 Table 5.1 Comparison of predictive performance between our method and previous works.
List of Figures
Figure 1.1 Protein acetylation and deacetylation. ... 1
Figure 1.2 Regulation of gene expression by histone acetylation ... 4
Figure 1.3 The transcriptional regulation by p53 acetylation ... 6
Figure 2.1 Web page of dbPTM. ... 9
Figure 2.2 Web page of UniProtKB/Swiss-Prot. ... 11
Figure 2.3 Web page of NetAcet. ... 13
Figure 2.4 Web page of PAIL. ... 15
Figure 3.1 System flow of N-Ace. ... 18
Figure 3.2 Defining the positive dataset and negative dataset. ... 19
Figure 3.3 The flow chart of extract non-redundant dataset. ... 20
Figure 3.4 The method of feature coding. ... 22
Figure 3.5 Principle of Support vector machines (SVM). ... 23
Figure 3.6 The flow chart of independent test. ... 26
Figure 4.1 The predictive performance of models trained with various windows sizes. .... 33
Figure 4.2 Acetylation model comparisons between implemented amino acid sequence feature and two stages SVM with multiple features. ... 36
Figure 4.3 Acetylation model comparisons between original data sets and the localization -cluster data sets. ... 40
Figure 4.4 Web interfaces of N-Ace. ... 45
Figure 5.1 The cross-validation sensitivity, specificity and accuracy of the acetyllysine model trained with different ratio of positive sets and negative sets. ... 49
Chpater 1 Introduction
1.1 Background
1.1.1 Protein Acetylation and Deacetylation
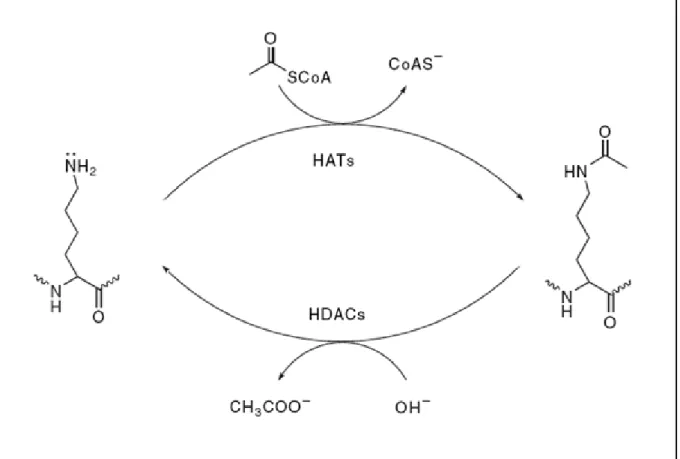
Figure 1.1 Protein acetylation and deacetylation.
As shown in Figure 1.1, acetylation describes a reaction that introduces an acetyl functional group into an organic compound by acetyltransferases and is one of protein acylations that occur with short-chain acyl-CoA as donor substrate to nucleophilic side chains in proteins. The protein acetylation had two distinct biological purposes. One is the acetylation of the
occurring cotranslationally. The other is the acetylation of proteins, most famously histones and transcription factors that affect selective gene transcription and chromatin structure. These are regulatory events and are reversed by N-deacetylase enzymes. The two N-acetylations are depicted, for Nα-terminal acetylation and lysine Nε-terminal acetylation, respectively.
1.1.2 N
α-terminus Acetylation and N
ε-terminus
Acetylation
Nα-terminus acetylation is an irreversible modification occurring cotranslationally and occurs in the α–amino group designates the position of the central carbon atom of amino acids and located on protein N-terminal only. Enzymatic acetylation of the N-terminus of proteins occurs in about 50% of yeast proteins, and up to 80–90% of higher eukaryotic proteins [1, 2]. In contrast, it is very rare in prokaryotes. The biological mechanism of N-terminal acetylation of eukaryotic proteins is unclear.
Nε-terminus acetylation occur in ε-amino group of lysine residues designates the position of a carbon atom in the side chain. Unlike Nα-terminal acetylation, post-translational ε-amino lysine acetylation of proteins is highly reversible. Acetylation of the ε-NH2 of lysine
residues participate in a variety of cellular processes, including transcription regulation, DNA repair, apoptosis, signal transduction, nuclear import, protein–protein interaction, DNA binding, enzymatic activity, stability, and subcellular localization [2-16].
1.1.3 Histone and p53 Acetylation
There are four histones, which include H2A, H2B, H3, and H4, that form the octameric histone cores of nucleosomes, (H2A)2(H2B)2, (H3)2(H4)2, and around which 145–147 base
pairs of DNA is wrapped in chromatin structures. The N-termini of the four histones are not involved in the core structure and so are flexible, unstructured, and available for post-translational modification, including phosphorylation, methylation, ubiquitylation, and acetylation [17, 18]. These covalent markings are proposed to be signals, the histone code [19] that gets read by proteins of the gene transcriptional activation or repression in particular regions of chromatin.
The recent research discovered that some transcriptional co-activators turned out to be histone acetyltransferases (HATs) [20, 21]. The same as the post-translational modification involved in signaling, the acetyl groups on histone lysine side chains can be removed reversibly by histone deacetylases (HDACs). Some transcriptional co-repressor proteins proved to have HDAC activity, providing further impetus for the characterization of the balance of HAT and HDAC activity to understand the dynamic integration of the histone code over time.
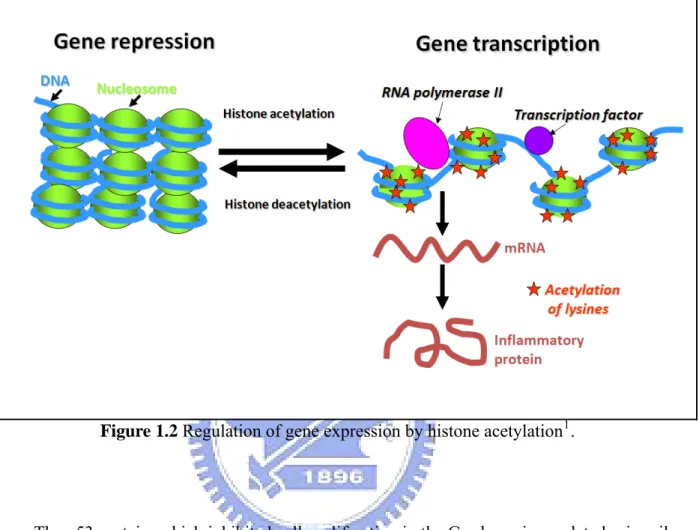
As shown in Figure 1.2, when lysine side chains are cationic at physiological pH, N-acetylation will change the positive charges. If three or four of the four lysine side chains in H3 or H4 were acetylated, as can happen in nucleosomes where promoters are actively transcribed, then the charge quenching and the consequent electrostatic weakening of interaction of histone tails with negatively charged DNA could contribute to opening up of the chromatin in that microenvironment [20, 21]. Histone hyper-acetylation is correlated with
gene silencing.
Figure 1.2 Regulation of gene expression by histone acetylation1.
The p53 protein, which inhibited cell proliferation in the G1 phase, is regulated primarily
through transcriptional activation of the p21 gene, which encodes an inhibitor of cyclin-dependent kinases [22]. In contrast, transcriptional activation of the PUMA gene is important for p53-dependent apoptosis, which encodes a BH3-only member of the Bcl-2 family that initiates the cell-death cascade by modulating Bax activity [23, 24]. In addition, p53 also transactivates the mdm2 gene to initiate the p53-Mdm2 feedback loop, which is crucial for restraining p53 function during the stress response [8, 25].
Yi Tang et al. [12] proposed a model involving three different levels of p53-dependent
1
Figure was extracted from
transcriptional regulation. First, upon DNA damage-induced p53 stabilization, Mdm2 is readily induced in the absence of Tip60 recruitment (although other coactivators such as CBP/p300 might be required) (See Figure 1.3 (I)). Because activated p53 is potentially dangerous to cell viability, the p53/Mdm2 feedback is probably an early, perhaps default, step in the p53-mediated stress response. Second, Tip60 interacts with p53 and is recruited to p53 target promoters, leading to p21 transactivation and growth arrest (See Figure 1.3 (II)). This step may be particularly important for cells to initiate productive DNA repair processes. In contrast to mdm2 and p21, cells may be reluctant to induce high levels of p53 targets such as puma that initiate an irreversible apoptotic response. Nevertheless, in response to some signals (e.g., the existence of unrepairable DNA damage) K120 acetylation of p53 is induced by Tip60 and PUMA expression is fully activated (See Figure 1.3 (III)).
This model might explain the differential effects of p53-mediated transactivation under various cellular conditions and the level of p53 acetylation regulates the programmed cell death.
Figure 1.3 The transcriptional regulation by p53 acetylation. [Yi Tang et al., 2006 Molecular Cell 24, 827–839]
1.2 Motivation
Protein acetylation is an important and reversible post-translational modification, and acetylated proteins control gene regulation, transcription and protein activation. The N-acetylation of histones can be detected by mass spectrometry, or by use of radioactive *acetyl-CoA as cosubstrate to monitor protein covalent radioactivity, or by using N-acetyllysine-specific antibodies in chromatin immunoprecipitation (ChIP) assays for qualitative detection of acetylated histone levels. However, experimental identification of acetylation sites wastes a lot of time and consumes experimental resources. How to identify of protein acetylation sites that could be useful and insightful for further experimental design is very important. Therefore, in silico identification of protein acetylation sites with high predictive accuracy could be a promising strategy to conduct preliminary analyses and could
heavily reduce the number of potential targets that need further in vivo or in vitro confirmation.
1.3 Specific Aims
In order to identify the protein acetylation sites that could be useful and insightful for further analysis, we investigate the substrate specificity of acetylated sites and propose a method, namely N-Ace, for identifying acetylation sites on alanine, glycine, lysine, methionine, serine, and threonine. It has been observed that protein acetylation site prefers to occur in regions that are easily accessible. Support Vector Machine (SVM) is adapted to learn the computational models with the features of amino acids, structural characteristics, and physicochemical properties surrounding the acetylation sites. The constructed models were evaluated based on k-fold cross-validation. Moreover, the independent test set was used to evaluate whether the constructed model over-fitted to the training set. To facilitate the investigation of protein acetylation sites, the models with highest predictive accuracy were adopted to implement an effective web-based prediction system.
Chpater 2 Related Works
Because more and more attentions were paid with the high-throughput proteomic studies of protein acetylation in biological mechanism, which produce an increasing number of experimentally verified acetylation sites. Nevertheless, experimental identification of acetylation sites is complicated and need a lot of time. Computational prediction might not only narrow down the potential acetylation sites, but also facilitate the further investigation in downstream functional analysis. Thus, three works were proposed to computationally identify the potential acetylation sites on alanine (A), glycine (G), lysine (K), serine (S) and threonine (T) residues. Furthermore, there are two databases which provided information of protein for this study to analyze acetylation of protein.
2.1 Protein Acetylation Site Database
2.1.1 dbPTM
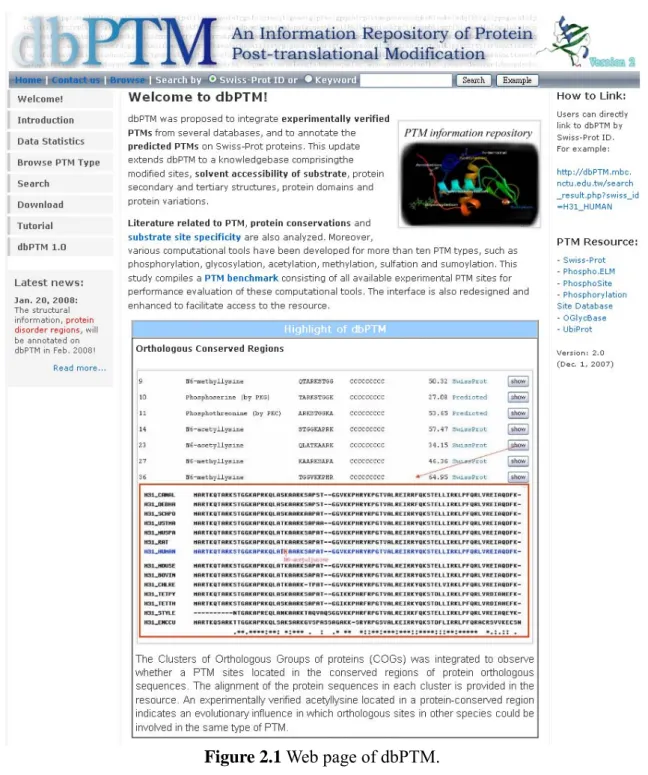
dbPTM [26] is a database that compiles information on protein post-translational modifications (PTM) such as the modified sites, solvent accessibility of surrounding amino acids, protein secondary and tertiary structures, protein domains, and protein variations. The version 2.0 of dbPTM integrates the experimentally validated PTM sites with referable literatures from UniProtKB/Swiss-Prot, Phospho.ELM, O-GLYCBASE, and UbiProt. In each type of PTM, the substrate peptide specificity such as positional amino acid frequency, solvent accessibility and secondary structure surrounding the modified sites are provided. All the PTMs and related information are accessible at http://dbPTM.mbc.nctu.edu.tw/.
Figure 2.1 Web page of dbPTM.
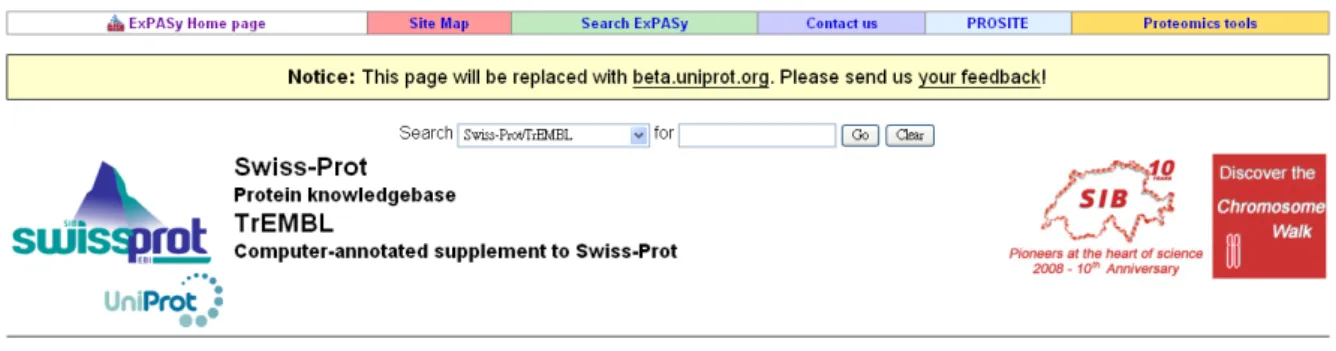
2.1.2 UniProtKB/Swiss-Prot
Data integrated into UniProtKB/Swiss-Prot [27, 28], including the protein sequence and current knowledge on protein, are manually checked and continuously updated. The main sources of data are scientific publications, which report new sequence data, and/or review articles to periodically update the annotations of families or groups of proteins. Each UniProtKB/Swiss-Prot entry contains core data (sequence data; bibliographical references and taxonomic data (description of the biological source of the protein)) and annotation, which consists of the description of the following items: function(s) of the protein, post-translational modifications (For example carbohydrates, phosphorylation, acetylation, GPI-anchor, etc), domains and sites (For example calcium binding regions, ATP-binding sites, zinc fingers, homeobox, kringle, etc), secondary structure, quaternary structure. (For example homodimer, heterotrimer, etc), similarities to other proteins, diseases associated with deficiencies in the protein, Sequence conflicts, variants, etc. The web page is available at http://us.expasy.org/sprot/.
2.2 Protien Acetylation Site Prediction Tools
2.2.1 NetAcet
Kiemer et al. [29] developed a neural network based method for prediction of Nα-terminal acetylated alanine (A), glycine (G), serine (S) and threonine (T) residues. They use the data were extracted from Table 2 in Polevoda and Sherman (2003) [30] and joined with data from the Yeast Protein Map (YPM) [31] to compose the datasets for training model. This study developed on a yeast data set for N-acetyltransferase A (NatA) acetylation. The performance of correlation coefficients is close to 0.7 on yeast data and sensitivity up to 74% on mammalian data. The web server is available from http://www.cbs.dtu.dk/services/NetAcet/ .
Figure 2.3 Web page of NetAcet.
2.2.2 Liu et al., 2004
Liu et al. [32] employed Support Vector Machine method to predict Nα-terminal acetylated sites and used a balanced training datasets. The performance of the sensitivity and specificity is 0.86 and 0.97, respectively, and the correlation coefficients and sensitivity on an independent mammalian data set is 0.85 and 0.9%, respectively. Especially, the data constructed from the Yeast Protein Map (YPM) and the same data set used by NetAcet. The web site is http://166.111.24.5/acetylation.html, but it is not available.
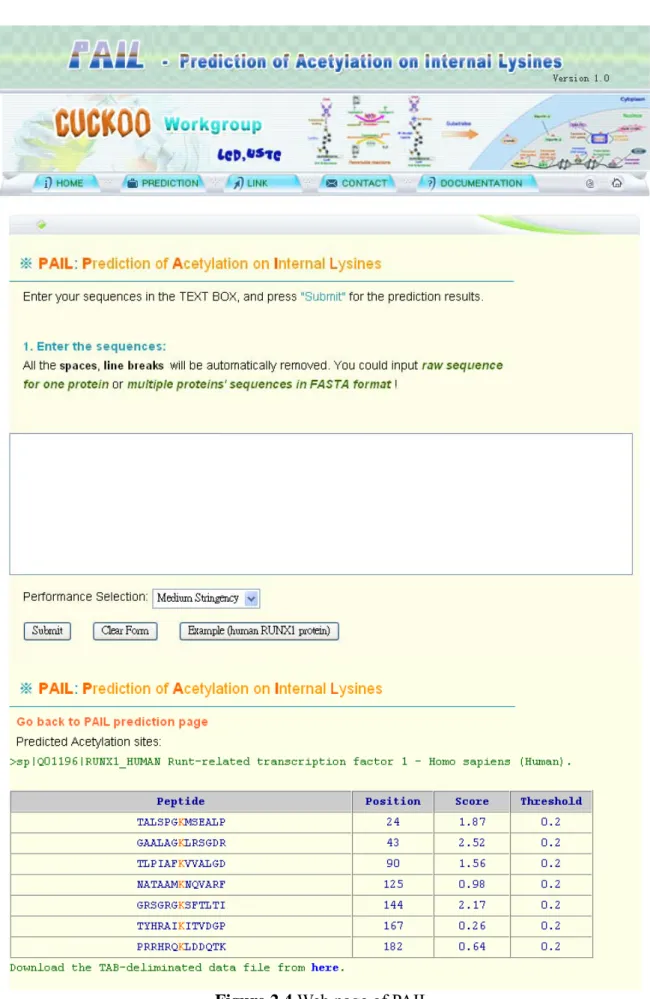
2.2.3 PAIL
Li et al. [33] constructed a prediction server for N -terminal acetylated lysine, which named
PAIL, and using a Bayesian Discriminant Method (BDM) algorithm, which can be described as follow.
The b is the cut-off value to obtain the prediction performance.
The datasets were composed of experimental verified acetylation sites from UniProtKB/Swiss-Prot and collected by surveying literatures. The window length of a potential acetylated peptide has been optimized as 13. The accuracy of PAIL is highly encouraging with, 85.13%, 87.97%, and 89.21% at low, medium, and high thresholds. The web page is available at http://bioinformatics.lcd-ustc.org/pail.
Chpater 3 Materials and Method
3.1 Materials
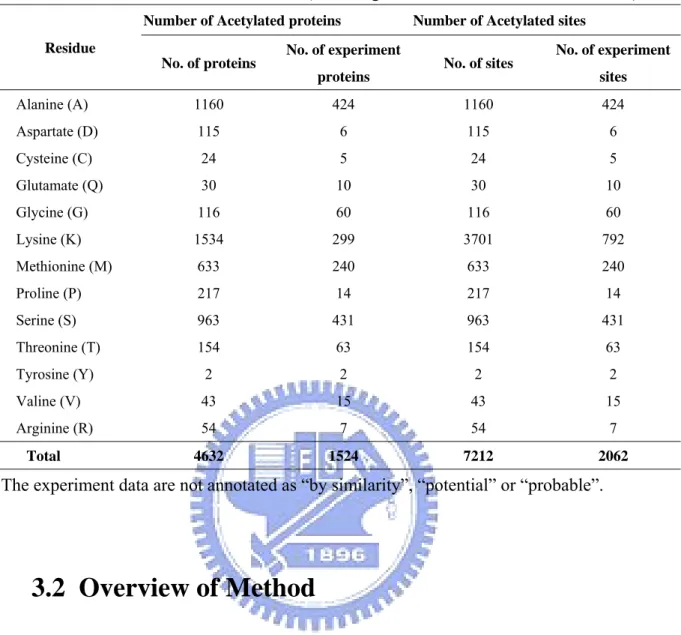
The dbPTM [26], which included UniProtKB/Swiss-Prot [27, 28] release 53, consists of 2,062 experimentally verified acetylation sites within 1,524 protein entries. As given in Table 3.1, after removing the non-experimentally sites, which annotated as “by similarity”, “potential” or “probable”, and select the residues which had enough datum to train model , only alanine (A), glycine (G), lysine (K), methionine (M), serine (S) and threonine (T) ,which are 424, 60, 792, 240, 431, and 63, respectively. In this work we just focused on acetylated alanine (A), glycine (G), lysine (K), methionine (M), serine (S) and threonine (T) residues.
Table 3.1 Data sources from dbPTM (including UniProtKB/Swiss-Prot Release 53).
Residue
Number of Acetylated proteins Number of Acetylated sites
No. of proteins No. of experiment
proteins No. of sites
No. of experiment sites Alanine (A) 1160 424 1160 424 Aspartate (D) 115 6 115 6 Cysteine (C) 24 5 24 5 Glutamate (Q) 30 10 30 10 Glycine (G) 116 60 116 60 Lysine (K) 1534 299 3701 792 Methionine (M) 633 240 633 240 Proline (P) 217 14 217 14 Serine (S) 963 431 963 431 Threonine (T) 154 63 154 63 Tyrosine (Y) 2 2 2 2 Valine (V) 43 15 43 15 Arginine (R) 54 7 54 7 Total 4632 1524 7212 2062
The experiment data are not annotated as “by similarity”, “potential” or “probable”.
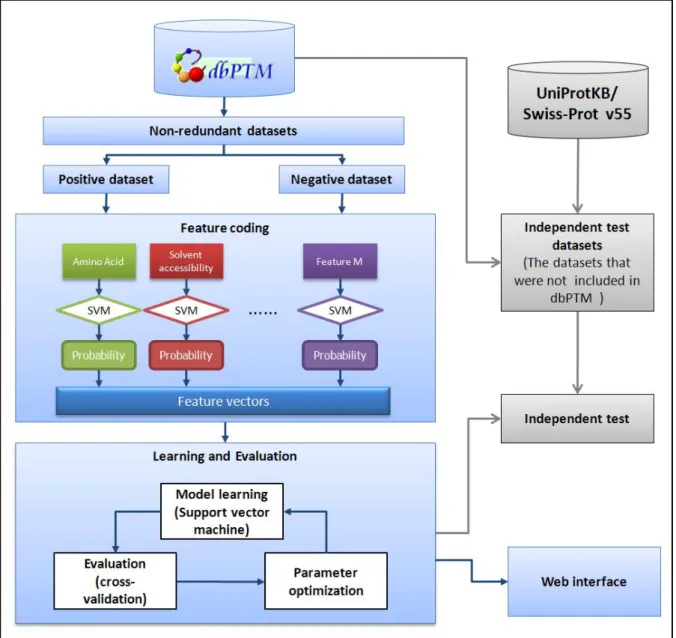
3.2 Overview of Method
The flow of the proposed method is shown in Figure 3.1. This study consists of four major analyzing processes such as data preprocessing, feature coding, model training and evaluation, and independent test. We firstly extracted the acetylated sites as positive sets, non-acetylated sites as negative sets and used multiple features to code feature vector, which included probability of classification from primary Support Vector Machine (SVM) at each features. Thereupon, the secondary SVM put in practice to learn computational models from positive sets and negative set of the acetylation sites. In order to evaluate the learned models, 5-fold cross-validation is carried out. Each step in the proposed method will be introduced below.
Figure 3.2 Defining the positive dataset and negative dataset.
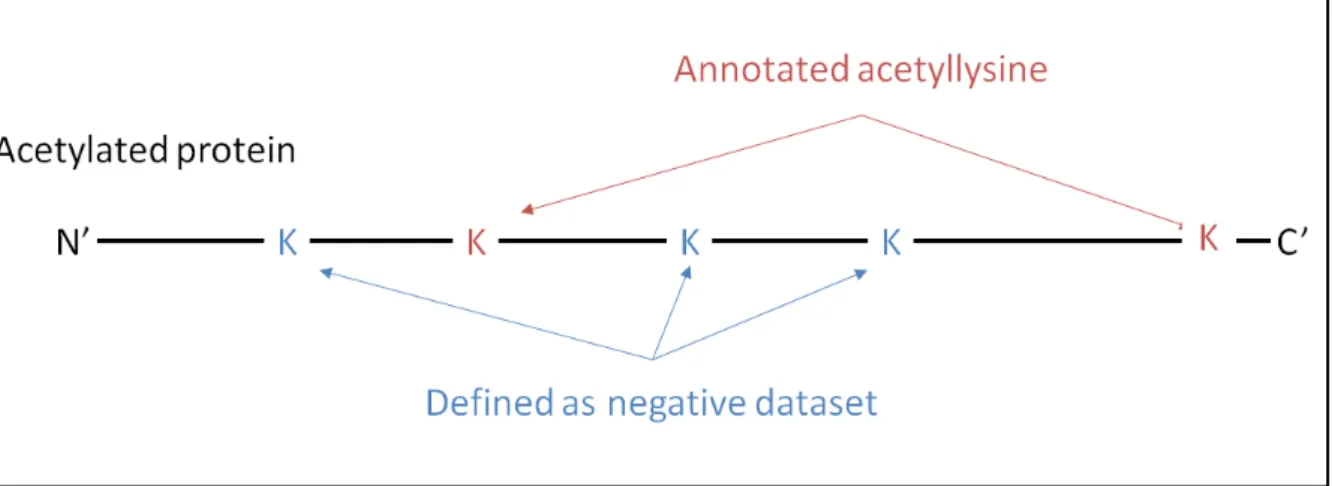
3.3 Data Preprocessing
We firstly extracted experiment data of acetylation site as positive datasets. Figure 3.2 depicts while all other residues (A, G, K, M, S or T) without annotated as acetylated sites are regarded as the negative set. WebLogo [34, 35] is used for creating the graphical sequence logo for the relative frequency of the corresponding amino acid at each position surrounding the acetylted sites, with defined window size 2n+1 (variety from 4~10) and n+1 (variety from 8~20) for N -terminal acetylation site and N -terminal acetylation, respectively. In order to
avoid the overestimation, the datasets must be the non-redundant datasets. As show as Figure 3.3, we clustered the protein sequences from datasets with a threshold of 30% identity by BLASTCLUST [36], which is part of the BLAST software package from the NCBI and systematically clusters protein sequences based on pairwise matches found using the BLAST algorithm. If two proteins were similar with ≥ 30% identity, we re-aligned the proteins with BL2SEQ [36], is part of the BLAST software package from the NCBI and allows for the alignment of two given sequences, and checked the results manually. If two acetylation sites from two homologous proteins were at the same position after sequence alignment, only one
data set of high quality with 365 acetylalanine sites, 30 acetylglycine sites, 471 acetyllysine sites, 184 acetylmethionine sites, 343 acetylserine sites and 57 acetylthreonine sites from 365, 30, 239, 184, 343 and 57 proteins, respectively.
Moreover, we make the equal sizes of the positive samples and the negative samples during the training model and cross-validation processes. The size of the negative set, which is constructed by randomly selected from the corresponding non-acetylation sites, is equal to the size of positive set.
3.4 Two Stages Support Vector Machine (SVM)
In this study, we import the following 12 features , which are amino acid sequence, accessible surface area [37, 38], absolute entropy [39], non-bonded energy [40],size [41],amino acid composition [42], steric parameter [43], hydrophobicity [44, 45], volume[46], mean polarity [47], electric charge [48], heat capacity[39] and isoelectric point [49]. As show as Figure 3.4, we utilized two stages Support Vector Machine (SVM) to promote the model performance. The two stages SVM can be described as follows: first, we are training each feature to get the probability of positive datasets and negative datasets; secondly, these probability values are constructing the feature vectors, which can be learning evaluation at the secondly stage SVM.
Figure 3.4 The method of feature coding.
3.5 Model Learning and Evaluation
3.5.1 Learning Model by Support Vector Machine (SVM)
The Support Vector Machine (SVM) is universal approximator based on statistical and optimising theory. The SVM is particularly attractive to biological analysis. As show as Figure 3.5, the basic principle of SVM can be described as follows: first, the inputs are formulated as feature vectors. Secondly, these feature vectors are mapped into a feature space by using the kernel function. Thirdly, a division is computed in the feature space to optimally separate two classes of training vectors. The SVM always seeks global hyperplane to separate the both classes of examples in training set and avoid overfitting.
Figure 3.5 Principle of Support vector machines (SVM)2.
for training the predictive models of acetylation sites prediction. A public SVM library, namely LIBSVM [50], is applied for training the predictive models. The SVM kernel function of radial basis function (RBF) is selected.
K x , x
exp
γ
x
x ,
γ
0
3.5.2 Model Evaluation and Parameter Optimization
After the models are learned, it is necessary to evaluate whether the models are fitted or not. 5-fold cross-validation is used to evaluate the predictive performance of the models trained from the data sets. The SVM cost values and SVM gamma values are optimized for maximizing the predictive accuracy by a tool from LIBSVM [50] . The following measures of the predictive performance of the models are then calculated: Precision (Pr) = TP
TP FP , Sensitivity (Sn) = TP TP FP,Specificity (Sp) = TN TN FP ,Accuracy (Acc) = TP TN TP FP TP FN
and Mathew correlation coefficient (MCC) = TP TN FN FP
TP FN TN FP TP FP TN FN , where TP, TN, FP and FN are true positive, true negative, false positive and false negative predictions, respectively. Moreover, when the number of positive data and negative data differ too much from each other, the Mathew correlation coefficient (MCC) should be included to evaluate the prediction performance. The value of MCC ranges from -1 to 1, and a larger MCC value stands for better prediction performance.
3.6 Independent Test
Sometimes, the prediction performance of the trained models might be overestimated because of the overfitting for training set. To estimate the real prediction performance, the independent test set will be used to evaluate the predictive performance of the trained models which reach the best accuracy based on the cross-validation. However, the performance of independent test may be good by chance. To avoid the unfair independent test, the dataset of independent test extracted from UniProtKB/Swiss-Prot release 55 which remote the same data in dbPTM, as given in Figure 3.6. The independent test set is constructed for lysine, alanine, serine and threonine, which is composed of 43, 21, 8 and 2 positive datasets, respectively. We also make the equal sizes of the positive samples and the negative samples. The size of the negative set, which is constructed by randomly selected from the non-acetylation sites, is equal to the size of positive dataset. The performance of independent test will be computed. The independent test sets of lysine, alanine, serine and threonine are not only adopted to test our method but also used to test other previously proposed protein acetylation prediction tools.
Figure 3.6 The flow chart of independent test.
Chpater 4 Results
4.1 Observation of Acetylation Sites
As given in Table 4.1, the flanking amino acids (+0~+12) and (-6 ~ +6) of the non-redundant acetylation sites (position 0) categorized by the modified residue are graphically visualized as sequence logo, which can be easily investigated the conservation of amino acids surrounding the acetylation sites. As the representation of sequence logo, there are no obvious conserved amino acids surrounding the modified sites. In the case of acetylated alanine, glycine, methionine and threonine are enriched surrounding the modified sites, especially in position +1. In other cases, there are no obvious conserved amino acids surrounding the acetylated lysine and serine. However, the conservation of amino acids in flanking regions may be temporary due to the low abundance of experimental verified acetylglycine and acetylthreonine.
Table 4.1 The sequence logo of amino acids.
Residues
Redundant Non- redundant
Window size Sequence logo
Sites Proteins Sites Proteins
Alanine (A) 415 415 356 356 +0~+12 Glycine (G) 60 60 30 30 +0~+12 Lysine (K) 715 282 471 239 -6~+6 Methionine (M) 239 239 184 184 +0~+12
Residues
Redundant Non- redundant
Window size Sequence logo
Sites Proteins Sites Proteins
Serine (S) 428 428 343 343 +0~+12
Threonine (T) 63 63 57 57 +0~+12
4.2 Functional Analysis of Acetylated Proteins
To determine which types of proteins are acetylated, the GO annotation had been analyzed. The non-redundant data set have 182 proteins which were acetylated at lysine residue. We obtain 597 distinct GO categories. The top five Gene Ontology (GO) entries of biological processes, molecular functions and cellular components of proteins, acetylated at lysine residue, were shown at Table 4.2.
Table 4.2 The top five GO categories of biological process, molecular function and cellular component of acetylated proteins.
GO symbol Gene Ontology No. of proteins
Top five biological processes
GO:0050789 regulation of biological process 42
GO:0006139 nucleobase, nucleoside, nucleotide and nucleic acid metabolic
process 31
GO:0009058 biosynthetic process 30
GO:0050896 response to stimulus 24
GO:0007154 cell communication 22
Top five molecular functions
GO:0005515 protein binding 69
GO:0003824 catalytic activity 46
GO:0003676 nucleic acid binding 30
GO:0016740 transferase activity 17
GO:0030528 transcription regulator activity 16
Top four cellular components
GO:0005634 nucleus 63
GO:0005739 mitochondrion 47
GO:0005737 cytoplasm 14
The most enriched GO item of biological process in which acetylated lysine proteins are involved in is “regulation of biological process” (42 proteins). The other four significantly biological processes are “nucleobase, nucleoside, nucleotide and nucleic acid metabolic process” (31 proteins), “biosynthetic process” (30 proteins), “response to stimulus” (24 proteins) and “cell communication” (22 proteins). The most frequent GO group of molecular function is “protein binding” (69 proteins), while the other four highly-abundant molecular functions are “catalytic activity” (46 proteins), “nucleic acid binding” (30 proteins), “transferase activity” (17 proteins) and “transcription regulator activity” (16 proteins). The most abundant GO entry of cellular component is “nucleus” (63 proteins), and the other three highly-frequent cellular components are “mitochondrion” (43 proteins), “cytoplasm” (14 proteins) and “membrane” (10 proteins).
Taken together, the analyses propose that protein acetylation plays important roles in regulation of biological process and the functions of acetylated proteins are different. Thus, the protein acetylation is suitable for develop a prediction system.
4.3 Predictive Performance
We adopt five frequently considered measurements: precision (Pr), sensitivity (Sn), specificity (Sp), accuracy (Ac) and Mathew correlation coefficient (MCC). Precision is a value of positive predictive, while sensitivity (Sn) and specificity (Sp) represent the correct prediction ratios of positive data sets and negative data sets respectively, and accuracy (Ac) illustrates the correct ratio between both positive data sets and negative data sets. If the number of positive data and negative data differ too much from each other, the Mathew correlation
MCC ranges from -1 to 1, and a larger MCC value stands for better prediction performance. Among the data with positive hits by prediction, the real positives are defined as true positives (TP), while the others are defined as false positives (FP). When the data predict as negative, the real positives are defined as false negatives (FN), while the others are defined as true negatives (TN).
4.3.1 Predictive Performance of 5-fold Cross-validation
with various windows sizes
Figure 4.1 illustrates the predictive accuracy of the models, based on various window sizes 2n+1, where n varies from 4 to 10. As far as various window sizes are concerned in acetyllysine, the window size increasing from 4 to 10 makes no obvious difference to predictive accuracy. The predictive specificity increased with the window size increasing from 4 to 10. However, the predictive sensitivity decreased with the window size increasing. To consider the computational efficiency and overall performance of the models trained with different window sizes, 13-mer is selected as the feasible window length.
Figure 4.1 The predictive performance of models trained with various windows sizes.
0.30 0.40 0.50 0.60 0.70 0.80 0.90 1.00 4 5 6 7 8 9 10 Accuracy (%) Window size (2n+1)
acetyllysine
Pr Sn Sp Acc MCC4.3.2 Predictive Performance of 5-fold Cross-validation
based on Amino Acid Sequence
As shown in Table 4.3, the performance measurements of sensitivity (Sn), specificity (Sp), accuracy (Acc), and Mathew correlation coefficient (MCC) based only on amino acid sequence. We adopt the 5-fold cross-validation to evaluation. However, because the flanking amino acids of alanine, lysine and serine are not conserved, the model training by amino acid sequence can’t identify positive datasets and negative datasets completely. The predictive accuracies of our method are 69%, 72%, 67%, 83%, 70% and 68% for alanine, glycine, lysine methionine serine and threonine, respectively.
Table 4.3 The cross-validation performance of the models trained with amino acid sequence feature.
Acetylation Residue
No. of non-redundant
training set Window Size Pr Sn Sp Acc MCC
Alanine 356 +0~+12 0.74 0.60 0.79 0.69 0.40 Glycine 30 +0~+12 0.83 0.60 0.83 0.72 0.47 Lysine 471 -6~+6 0.74 0.52 0.81 0.67 0.35 Methionine 184 +0~+12 0.83 0.83 0.83 0.83 0.66 Serine 343 +0~+12 0.82 0.53 0.86 0.70 0.43 Threonine 57 +0~+12 0.73 0.63 0.73 0.68 0.39
Abbreviation: Pr, precision; Sn, sensitivity; Sp, specificity; Acc, accuracy; MCC, Mathew correlation coefficient.
4.3.3 Predictive Performance of 5-fold Cross-validation
based on Two Stages SVM with Multiple Features
In order to improve the prediction performance, we not only include amino acid sequence, but also constructed other structural characteristics, such as accessible surface area, absolute entropy, non-bonded energy, size, amino acid composition, steric parameter, hydrophobicity, volume, mean polarity, electric charge, heat capacity and isoelectric point. Moreover, we implemented two stages SVM method to increase performance. The results of prediction performance were presented in Table 4.4. The predictive accuracies of our method are 84%, 85%, 73%, 94%, 81% and 77% for alanine, glycine, lysine methionine serine and threonine, respectively. Figure 4.2 show the model comparisons between implemented amino acid sequence feature and two stages SVM method.
Table 4.4 The cross-validation performance of the models trained with selected features feature and implemented two stages SVM with multiple features.
Acetylation Residue
No. of non-redundant
training set Window Size Pr Sn Sp Acc MCC
Alanine 356 +0~+12 0.91 0.76 0.93 0.84 0.69 Glycine 30 +0~+12 0.93 0.80 0.90 0.85 0.74 Lysine 471 -6~+6 0.84 0.59 0.88 0.73 0.49 Methionine 184 +0~+12 0.99 0.89 0.99 0.94 0.89 Serine 343 +0~+12 0.97 0.65 0.98 0.81 0.66 Threonine 57 +0~+12 0.78 0.76 0.79 0.77 0.56
Abbreviation: Pr, precision; Sn, sensitivity; Sp, specificity; Acc, accuracy; MCC, Mathew correlation coefficient.
0.00 0.20 0.40 0.60 0.80 1.00 Pr Sn Sp Acc MCC Alanine AA SVM2 0.00 0.20 0.40 0.60 0.80 1.00 Pr Sn Sp Acc MCC Glycine AA SVM2 0.00 0.20 0.40 0.60 0.80 1.00 Pr Sn Sp Acc MCC Lysine AA SVM2 0.00 0.20 0.40 0.60 0.80 1.00 Pr Sn Sp Acc MCC Methionine AA SVM2 0.00 0.20 0.40 0.60 0.80 1.00 Pr Sn Sp Acc MCC Serine AA SVM2 0.00 0.20 0.40 0.60 0.80 1.00 Pr Sn Sp Acc MCC Threonine AA SVM2
Abbreviation: AA, Amino Acid sequence; SVM2, Two Stages SVM.
Figure 4.2 Acetylation model comparisons between implemented amino acid sequence feature and two stages SVM with multiple features.
4.3.4 Predictive Performance of 5-fold Cross-validation
based on Two Stages SVM with multiple features
and Clustered by Subcellular Localization
Due to the high-throughput mass spectrometry-based proteomics, the number of experimentally verified acetylated sites are rapidly increasing, which prompted the researcher to investigate the substrate specificity of acetyltransferases. As shown in Table 4.5, the protein subcellular localization of acetyltransferases and their substrates is mostly located in nucleus, which are interacted with DNA replication, DNA repair, transcription, and translational. However, some of them located in different localization are involved in different protein functions. Therefore, we investigate the substrate specificity of acetylated sites with their protein subcellular localization.
Table 4.5 The statistics of acetyltransferases with subcellular localization in dbPTM.
Subcellular localization Number of Acetyltransferase
Nucleus 145 Cytoplasm 74 Membrane 27 Mitochondrion 0
Not description 71
Especially in larger data set (greater than 100 sites), we clustered the sequences of the acetylation sites by subcellular localization into several subgroups, which are separately taken
given in Table 4.6. For the acetyllysine, the models learned from localization-clustered data sets have higher sensitivity than the ones learned from the data sets not applied clustered, but the models lose a little specificity. However, the models learned from localization-clustered for acetylalanine, acetylmethionine and acetylserine have lost a part of performance than the data sets not applied clustered. As given in Figure 4.3, the models we comparisons between original data sets and the localization-cluster data sets.
Table 4.6 The cross-validation performance of the models trained with implemented two stages SVM with multiple features and clustered by subcellular localization Acetylated Residue Subcellular localization No. of non-redundant training set Window Size Pr Sn Sp Acc MCC Alanine Nucleus 48 +0~+12 0.77 0.78 0.77 0.77 0.56 Cytoplasm 139 +0~+12 0.93 0.73 0.94 0.84 0.70 Mitochondrion 36 +0~+12 0.93 0.61 0.95 0.78 0.60 Membrane 48 +0~+12 0.89 0.71 0.90 0.80 0.63 Average - +0~+12 0.90 0.72 0.90 0.81 0.65 Total 356 +0~+12 0.91 0.76 0.93 0.84 0.69 Glycine Total 30 +0~+12 0.93 0.80 0.90 0.85 0.74 Lysine Nucleus 178 -6~+6 0.97 0.81 0.98 0.90 0.80 Cytoplasm 51 -6~+6 0.77 0.73 0.79 0.76 0.52 Mitochondrion 190 -6~+6 0.70 0.67 0.72 0.69 0.39 Membrane 94 -6~+6 0.66 0.68 0.64 0.66 0.33 Average - -6~+6 0.80 0.73 0.80 0.76 0.53 Total 471 -6~+6 0.84 0.59 0.88 0.73 0.49 Methionine Nucleus 31 +0~+12 0.90 0.93 0.88 0.90 0.83 Cytoplasm 68 +0~+12 0.90 0.87 0.89 0.88 0.77 Membrane 30 +0~+12 0.89 0.80 0.90 0.85 0.71 Average - +0~+12 0.90 0.87 0.89 0.88 0.77 Total 184 +0~+12 0.99 0.89 0.99 0.94 0.89 Serine Nucleus 52 +0~+12 0.97 0.65 0.98 0.82 0.67 Cytoplasm 110 +0~+12 0.79 0.60 0.84 0.72 0.45 Membrane 32 +0~+12 0.66 0.71 0.63 0.67 0.35 Average - +0~+12 0.82 0.63 0.84 0.74 0.49 Total 343 +0~+12 0.97 0.65 0.98 0.81 0.66 Threonine Total 57 +0~+12 0.78 0.76 0.79 0.77 0.56
Abbreviation: Pr, precision; Sn, sensitivity; Sp, specificity; Acc, accuracy; MCC, Mathew correlation coefficient.
0.00 0.20 0.40 0.60 0.80 1.00 Pr Sn Sp Acc MCC Alanine localizati on‐ clustered non‐ clustered 0.00 0.20 0.40 0.60 0.80 1.00 Pr Sn Sp Acc MCC Lysine localizati on‐ clustered non‐ clustered 0.00 0.20 0.40 0.60 0.80 1.00 Pr Sn Sp Acc MCC Methionine localizati on‐ clustered non‐ clustered 0.00 0.20 0.40 0.60 0.80 1.00 Pr Sn Sp Acc MCC Serine localizati on‐ clustered non‐ clustered
Figure 4.3 Acetylation model comparisons between original data sets and the localization -cluster data sets.
4.3.5 Predictive Performance of Independent Test
The independent test sets of acetyllysine, acetylalanine, acetylserine and acetylthreonine are used to evaluate the selected models with best predictive accuracy. As given in Table 4.7, the predictive accuracies of our method are 80.8% and 85.0% for alanine lysine serine and threonine, respectively. In general, the performance of independent test might be approaching the performance of cross-validation. While the performance of cross-validation is better than independent test, it means that the trained model may be overfitting for the training data. This table shows that our trained model may be not overfitting. Furthermore, the independent test sets are also used to test other acetylation predictors. The result of independent test shows that the PAIL has high predictive sensitivity for identifying acetylated lysine, but the trained models of PAIL are not specific enough to the negative datasets of independent test sets. NetAcet has high predictive specificity for identifying acetylated alanine and threonine, but the trained models of NetAcet are not specific enough to the negative datasets of independent test sets in alanine and threonine. Unlike acetylated alanine and threonine, the independent test of acetylated serine by NetAcet has high predictive sensitivity and insufficient specificity.
Table 4.7 The average performances of our method and other tools based on independent test.
Tools Acetylated
Residue Reference Method Window
Size
No. of positive set
No. of
negative set Pr Sn Sp Acc MCC
PAIL lysine
Li, A., et al., Biochem Biophys Res Commun,
2006. Bayesian Discriminant Method -6~+6 43 43 0.55 0.84 0.33 0.58 0.19 NetAcet alanine Kiemer, L., et al.,
Bioinformatics, 2005. Neural Network
0~+12 21 21 0.00 0.00 1.00 0.5 0.00
serine 0~+12 8 8 0.60 0.75 0.5 0.63 0.26
threonine 0~+12 2 2 0.00 0.00 1.00 0.5 N/A
N-Ace
lysine
N/A Support Vector Machine
-6~+6 43 43 0.84 0.98 0.81 0.90 0.80
alanine 0~+12 21 21 0.89 0.94 0.89 0.92 0.83
serine 0~+12 8 8 0.86 0.75 0.88 0.81 0.63
threonine 0~+12 2 2 1.00 1.00 1.00 1.00 1.00
Abbreviation: Pr, precision; Sn, sensitivity; Sp, specificity; Acc, accuracy; MCC, Mathew correlation coefficient.
4.4 Summary of Result
The models with best performance are chosen in each residue as shown in Table 4.8. It could be observed that acetyllysine clustered by localization with better performance. In lysine, the average of precision, sensitivity, specificity, accuracy and Mathew correlation coefficient (MCC) are 80%, 73%, 80%, 76% and 53%, respectively. Furthermore, we select the best performance of models without clustered by localization in other residues. In alanine, the precision is 91%, 76% in sensitivity, 93% in specificity, 84% in accuracy and 69% in MCC. In glycine, the precision is 93%, 80% in sensitivity, 90% in specificity, 85% in accuracy and 74% in MCC. In methionine, the precision is 99%, 89% in sensitivity, 99% in specificity, 94% in accuracy and 89% in MCC. In Serine, the precision is 97%, 65% in sensitivity, 98% in specificity, 81% in accuracy and 66% in MCC. The precision, sensitivity, specificity, accuracy and MCC in threonine are 78%, 76%, 79%, 77% and 56%, respectively.
Table 4.8 The selected models with the highest accuracy. Acetylated Residue Subcellular localization No. of non-redundant training set Window Size Pr Sn Sp Acc MCC Alanine Total 356 +0~+12 0.91 0.76 0.93 0.84 0.69 Glycine Total 30 +0~+12 0.93 0.80 0.90 0.85 0.74 Methionine Total 184 +0~+12 0.99 0.89 0.99 0.94 0.89 Serine Total 343 +0~+12 0.97 0.65 0.98 0.81 0.66 Threonine Total 57 +0~+12 0.78 0.76 0.79 0.77 0.56 Lysine Nucleus 178 -6~+6 0.97 0.81 0.98 0.90 0.80 Cytoplasm 51 -6~+6 0.77 0.73 0.79 0.76 0.52 Mitochondrion 190 -6~+6 0.70 0.67 0.72 0.69 0.39 Membrane 94 -6~+6 0.66 0.68 0.64 0.66 0.33 Lysine Average - -6~+6 0.80 0.73 0.80 0.76 0.53
Abbreviation: Pr, precision; Sn, sensitivity; Sp, specificity; Acc, accuracy; MCC, Mathew correlation coefficient.
4.5 Web Interface of N-Ace
The users can submit their uncharacterized protein sequences to the query interface and make a choice for the appropriate models to predict for alanine, glycine, lysine, methionine, serine and threonine. As shown in Figure 4.4, our system returns the predicted results including acetylated position and flanking amino acids. Furthermore, users can choose different threshold for acetylation prediction based on predictive sensitivity. The web service is freely available at http://N-Ace.mbc.NCTU.edu.tw/.
Chpater 5 Discussions
5.1 Comparison to Other Tools
Our proposed method is compared to several current released acetylation prediction tools such as NetAcet, Liu et al., 2004 and PAIL. All the previous tools just consider the protein sequence annotation. Especially, in our investigation we construct the models include protein sequence, accessible surface area, absolute entropy, non-bonded energy, size, amino acid composition, steric parameter, hydrophobicity, volume, mean polarity, electric charge, heat capacity and isoelectric point annotations for acetylation sites. In order to have equality comparison, we use independent test. The accuracy of the models learned from acetyllysine, acetylalanine, acetylglycine, acetylmethionine, acetylserine and acetylthreonine are 0.84, 0.85, 0.76, 0.94, 0.81 and 0.77, respectively. All the independent test of the alanine, lysine, serine and threonine models are higher than NetAcet, Liu et al., 2004 and PAIL. As show in Table 5.1 shows that the proposed method, material, training features, selected window size, the predictive sensitivity and specificity of acetyllysine, acetylalanine, acetylglycine, acetylmethionine, acetylserine and acetylthreonine, and the overall performance are compared.
Table 5.1 Comparison of predictive performance between our method and previous works.
Tools NETAcet (Kiemer et al., 2004) Liu et al., 2004 PAIL (Li et al., 2006) N-Ace
Material Yeast Protein Map (YPM) Yeast Protein Map (YPM) UniProtKB/Swiss-Prot UniProtKB/Swiss-Prot version v53
Method Neural Network Support Vector Machine Bayesian Discriminant Method Support Vector Machine
Training features Amino acid Amino acid Amino acid
Amino Acids, structural characteristics, and physicochemical properties*
Selected window size 7 5 13 13
Acetylated lysine (K) - - Sn = 59.76%, Sp = 90.20% Sn = 73%, Sp = 80%; Acetylated alanine - - - Sn = 76%, Sp = 93% Acetylated glycine - - - Sn = 80%, Sp = 90% Acetylated methionine - - - Sn = 89%, Sp = 99% Acetylated serine Sn = 75%, Sp = 92% Sn = 86%, Sp = 97% - Sn = 65%, Sp = 98% Acetylated threonine - - - Sn = 73%, Sp = 80% Independent test lysine - - Sn = 84%, Sp = 33% Sn = 98%, Sp = 81% alanine Sn = 0%, Sp = 100% - - Sn = 94%, Sp = 89% serine Sn = 75%, Sp = 50% - - Sn = 75%, Sp = 88% threonine Sn = 0%, Sp = 100% - - Sn = 100%, Sp = 100%
* Structural characteristics and physicochemical properties include accessible surface area, absolute entropy, non-bonded energy, size, amino acid composition, steric parameter, hydrophobicity, volume, mean polarity, electric charge, heat capacity and isoelectric point.
5.2 Different Ratio of Positive sets and Negative sets
In this work, the positive and negative training sets are balanced during the cross-validation. Because the size of negative set is much larger than positive set, the negative set may be unfair sampling. Thus, thirty sets of negative training data are randomly extracted and used to evaluate the prediction performance. However, it is impossible to extract thirty negative sets for constructing thirty predictive models when implementing the web server. Therefore, a larger size of negative set should be constructed.
Unfortunately, larger negative set will make the trained model prefer to classify negative data correctly, based on achieving highest accuracy. As shown in Figure 5.1, the predictive specificity of acetyllysine model, which is trained with different ratio of positive and negative sets, increases with larger size of negative set. To take both the sensitivity and size of negative set into account, the appropriate ratio of positive and negative sets is 1:2. As a result, the appropriate ratio of positive and negative sets is used to construct the prediction model of the protein acetylation web server.
Figure 5.1 The cross-validation sensitivity, specificity and accuracy of the acetyllysine model
trained with different ratio of positive sets and negative sets. 0.00 0.20 0.40 0.60 0.80 1.00 1:1 1:2 1:3 1:4 1:5 1:6 1:7 1:8 Sn Sp Acc Ratio
5.3 Prospective Works
In the future, we hope the finish with two works will make the research better. Firstly, it is useful that utilizes more information of protein structure to advance the acetylation site prediction performance. Secondly, it is important about transcription regulation with acetylation, so we would combine with MicroArray data and prediction of acetylation sites to describe the regulated transcription and more detail with acetylation to make users realize about the key point of acetylation in the gene expression.
Chpater 6 Conclusion
We proposed a prediction tool for identify protein acetylation sites, namely N-Ace, is implemented to allow users submit protein sequences for prediction of acetylation sites. We use independent test to test our system, and the result suggests that our system is capable of predicting novel acetylation sites of protein. By comparing to other approaches previously developed, our method provides not only considering the amino acid sequence of the acetylation sites, but also the corresponding protein modified of structural characteristics, and physicochemical properties.
References
1. Polevoda, B. and F. Sherman, Nalpha -terminal acetylation of eukaryotic proteins. J Biol Chem, 2000. 275(47): p. 36479-82.
2. Polevoda, B. and F. Sherman, The diversity of acetylated proteins. Genome Biol, 2002. 3(5): p. reviews0006.
3. Bannister, A.J., et al., Acetylation of importin-alpha nuclear import factors by CBP/p300. Curr Biol, 2000. 10(8): p. 467-70.
4. Brunet, A., et al., Stress-dependent regulation of FOXO transcription factors by the SIRT1 deacetylase. Science, 2004. 303(5666): p. 2011-5.
5. Cohen, H.Y., et al., Acetylation of the C terminus of Ku70 by CBP and PCAF controls Bax-mediated apoptosis. Mol Cell, 2004. 13(5): p. 627-38.
6. Faiola, F., et al., Dual regulation of c-Myc by p300 via acetylation-dependent control of Myc protein turnover and coactivation of Myc-induced transcription. Mol Cell Biol, 2005. 25(23): p. 10220-34.
7. Glozak, M.A., et al., Acetylation and deacetylation of non-histone proteins. Gene, 2005. 363: p. 15-23.
8. Luo, J., et al., Deacetylation of p53 modulates its effect on cell growth and apoptosis. Nature, 2000. 408(6810): p. 377-81.
9. Murr, R., et al., Histone acetylation by Trrap-Tip60 modulates loading of repair proteins and repair of DNA double-strand breaks. Nat Cell Biol, 2006. 8(1): p. 91-9. 10. Ramanathan, B. and M.J. Smerdon, Enhanced DNA repair synthesis in
hyperacetylated nucleosomes. J Biol Chem, 1989. 264(19): p. 11026-34.
11. Subramanian, C., et al., Ku70 acetylation mediates neuroblastoma cell death induced by histone deacetylase inhibitors. Proc Natl Acad Sci U S A, 2005. 102(13): p. 4842-7. 12. Tang, Y., et al., Tip60-dependent acetylation of p53 modulates the decision between
cell-cycle arrest and apoptosis. Mol Cell, 2006. 24(6): p. 827-39.
13. Verdone, L., et al., Histone acetylation in gene regulation. Brief Funct Genomic Proteomic, 2006. 5(3): p. 209-21.
14. Wang, W., et al., AMP-activated protein kinase-regulated phosphorylation and acetylation of importin alpha1: involvement in the nuclear import of RNA-binding protein HuR. J Biol Chem, 2004. 279(46): p. 48376-88.
15. Yang, X.J., Lysine acetylation and the bromodomain: a new partnership for signaling. Bioessays, 2004. 26(10): p. 1076-87.
16. Yuan, Z.L., et al., Stat3 dimerization regulated by reversible acetylation of a single lysine residue. Science, 2005. 307(5707): p. 269-73.
17. Marmorstein, R., Protein modules that manipulate histone tails for chromatin regulation. Nat Rev Mol Cell Biol, 2001. 2(6): p. 422-32.
18. Turner, B.M., Cellular memory and the histone code. Cell, 2002. 111(3): p. 285-91. 19. Strahl, B.D. and C.D. Allis, The language of covalent histone modifications. Nature,
Biol, 1999. 11(3): p. 336-41.
21. Kouzarides, T., Acetylation: a regulatory modification to rival phosphorylation? EMBO J, 2000. 19(6): p. 1176-9.
22. el-Deiry, W.S., et al., WAF1, a potential mediator of p53 tumor suppression. Cell, 1993. 75(4): p. 817-25.
23. Nakano, K. and K.H. Vousden, PUMA, a novel proapoptotic gene, is induced by p53. Mol Cell, 2001. 7(3): p. 683-94.
24. Yu, J., et al., PUMA induces the rapid apoptosis of colorectal cancer cells. Mol Cell, 2001. 7(3): p. 673-82.
25. Brooks, C.L. and W. Gu, p53 ubiquitination: Mdm2 and beyond. Mol Cell, 2006. 21(3): p. 307-15.
26. Lee, T.Y., et al., dbPTM: an information repository of protein post-translational modification. Nucleic Acids Res, 2006. 34(Database issue): p. D622-7.
27. Bairoch, A. and R. Apweiler, The SWISS-PROT protein sequence data bank and its supplement TrEMBL in 1998. Nucleic Acids Res, 1998. 26(1): p. 38-42.
28. Boeckmann, B., et al., The SWISS-PROT protein knowledgebase and its supplement TrEMBL in 2003. Nucleic Acids Res, 2003. 31(1): p. 365-70.
29. Kiemer, L., J.D. Bendtsen, and N. Blom, NetAcet: prediction of N-terminal acetylation sites. Bioinformatics, 2005. 21(7): p. 1269-70.
30. Polevoda, B. and F. Sherman, N-terminal acetyltransferases and sequence requirements for N-terminal acetylation of eukaryotic proteins. J Mol Biol, 2003. 325(4): p. 595-622.
31. Perrot, M., et al., Two-dimensional gel protein database of Saccharomyces cerevisiae (update 1999). Electrophoresis, 1999. 20(11): p. 2280-98.
32. Liu, Y. and Y. Lin, A novel method for N-terminal acetylation prediction. Genomics Proteomics Bioinformatics, 2004. 2(4): p. 253-5.
33. Li, A., et al., Prediction of Nepsilon-acetylation on internal lysines implemented in Bayesian Discriminant Method. Biochem Biophys Res Commun, 2006. 350(4): p. 818-24.
34. Crooks, G.E., et al., WebLogo: a sequence logo generator. Genome Res, 2004. 14(6): p. 1188-90.
35. Schneider, T.D. and R.M. Stephens, Sequence logos: a new way to display consensus sequences. Nucleic Acids Res, 1990. 18(20): p. 6097-100.
36. Altschul, S.F., et al., Gapped BLAST and PSI-BLAST: a new generation of protein database search programs. Nucleic Acids Res, 1997. 25(17): p. 3389-402.
37. Ahmad, S., M.M. Gromiha, and A. Sarai, RVP-net: online prediction of real valued accessible surface area of proteins from single sequences. Bioinformatics, 2003. 19(14): p. 1849-51.
38. Ahmad, S., M.M. Gromiha, and A. Sarai, Real value prediction of solvent accessibility from amino acid sequence. Proteins, 2003. 50(4): p. 629-35.
39. Hutchens, J.O., Heat capacities, absolute entropies, and entropies of formation of amino acids and related compounds. In "Handbook of Biochemistry", 2nd ed. (Sober, H.A., ed.), Chemical Rubber Co., Cleveland, Ohio, p. B60-B61, 1970.
67, 567-584 Last two calcualted by Kidera; multiplied by the number of heavy atoms, 1977.
41. Dawson, D.M., The Biochemical Genetics of Man. (Brock, D.J.H. and Mayo, O., eds.), Academic Press, New York, p.1-38, 1972.
42. Dayhoff, M.O., L.T. Hunt, and S. Hurst-Calderone, Composition of proteins. In "Atlas of Protein Sequence and Structure", Vol.5, Suppl.3 (Dayhoff, M.O., ed.), National Biomedical Research Foundation, Washington, D.C., p.363, 1978.
43. Charton, M., Protein folding and the genetic code: an alternative quantitative model. J Theor Biol, 1981. 91(1): p. 115-23.
44. Cid, H., et al., Hydrophobicity and structural classes in proteins. Protein Eng, 1992. 5(5): p. 373-5.
45. Jones, D.D., Amino acid properties and side-chain orientation in proteins: a cross correlation appraoch. J Theor Biol, 1975. 50(1): p. 167-83.
46. Pontius, J., J. Richelle, and S.J. Wodak, Deviations from standard atomic volumes as a quality measure for protein crystal structures. J Mol Biol, 1996. 264(1): p. 121-36. 47. Radzicka, A. and R. Wolfenden, Comparing the polarities of the amino acids:
Side-chain distribution coefficients between the vapor phase, cyclohexane, 1-octanol, and neutral aqueous solution. Biochemistry 27, 1664-1670 (Pro missing), 1988. 48. Fauchere, J.L., et al., Amino acid side chain parameters for correlation studies in
biology and pharmacology. Int J Pept Protein Res, 1988. 32(4): p. 269-78. 49. Zimmerman, J.M., N. Eliezer, and R. Simha, The characterization of amino acid
sequences in proteins by statistical methods. J Theor Biol, 1968. 21(2): p. 170-201. 50. Chang, C.-C. and C.-J. Lin, LIBSVM : a library for support vector machines. Software
![Figure 1.3 The transcriptional regulation by p53 acetylation. [Yi Tang et al., 2006 Molecular Cell 24, 827–839]](https://thumb-ap.123doks.com/thumbv2/9libinfo/8252722.171766/15.892.138.790.105.549/figure-transcriptional-regulation-acetylation-yi-tang-molecular-cell.webp)