美國連鎖企業加盟傾向因子實證分析 - 政大學術集成
54
0
0
全文
(2)
(3) 14/5/7. fb140507.htm. 記錄編號:G0101357015. 國立政治大學 博碩士論文全文上網授權書 National ChengChi University Letter of Authorization for Theses and Dissertations Full Text Upload (提供授權人裝訂於紙本論文書名頁之次頁用) (Bind with paper copy thesis/dissertation following the title page) 本授權書所授權之論文為授權人在國立政治大學財務管理研究所系所 ________________組 103學年度第二學期取得 碩士學位之論文。 This form attests that the _____________ Division of the Department of Graduate Institute of Finance at National ChengChi University has received a Master degree thesis/dissertation by the undersigned in the _________ semester of 103 academic year. 論文題目(Title):美國連鎖企業加盟傾向因子實證分析 ( Examining the Drivers for U.S. Franchising Tendency ) 指導教授(Supervisor):張元晨 立書人同意非專屬、無償授權國立政治大學,將上列論文全文資料以數位化等各種方式重 製後收錄於資料庫,透過單機、網際網路、無線網路或其他公開傳輸方式提供用戶進行線 上檢索、瀏覽、下載、傳輸及列印。 國立政治大學並得以再授權第三人進行上述之行為。 The undersigned grants non-exclusive and gratis authorization to National ChengChi University, to re-produce the above thesis/dissertation full text material via digitalization or any other way, and to store it in the database for users to access online search, browse, download, transmit and print via single-machine, the Internet, wireless Internet or other public methods. National ChengChi University is entitled to reauthorize a third party to perform the above actions. 論文全文上載網路公開之時間(Time of Thesis/Dissertation Full Text Uploading for Internet Access): 網際網路(The Internet) ■ 中華民國 108 年 5 月 7 日公開 ● 立書人擔保本著作為立書人所創作之著作,有權依本授權書內容進行各項授權,且未侵 害任何第三人之智慧財產權。 The undersigned guarantees that this work is the original work of the undersigned, and is therefore eligible to grant various authorizations according to this letter of authorization, and does not infringe any intellectual property right of any third party. ● 依據96年9月22日96學年度第1學期第1次教務會議決議,畢業論文既經考試委員評定 完成,並已繳交至圖書館,應視為本校之檔案,不得再行抽換。關於授權事項亦採一經授 權不得變更之原則辦理。 According to the resolution of the first Academic Affairs Meeting of the first semester on September 22nd, 2007,Once the thesis/dissertation is passed after the officiating examiner's evaluation and sent to the library, it will be considered as the library's record, thereby changing and replacing of the record is disallowed. For the matter of authorization, once the authorization is granted to the library, any further alteration is disallowed, 立 書 人:何珮瑜 簽 名(Signature): 中華民國 年 月 日 Date of signature:__________/__________/__________ (dd/mm/yyyy) . file:///Volumes/750G/Users/payyou/Downloads/fb140507.htm. 1/1.
(4) 致謝 陰錯陽差、超英趕美的提早完成了碩士班學業以及此篇文章,特別感謝指導 老師 張元晨教授給學生的引導與幫助,老師辛苦的將資料搬運回台才有機會讓 學生有本篇文章的實證探討,謝謝兩位口試委員 黃柏凱老師與 蔡湘萍老師的指 點使得這篇文章得以更加完善,謝謝學姐 之寧您包山包海的幫忙。 在財管所的兩年逐步實現自己的人生規劃,很幸運地加入這個充滿競爭力、 歡笑聲跟激發鬥志的班級,謝謝同學們的對我無止盡的包容與幫忙,準備論文的. 政 治 大. 過程太多的突發狀況,全靠你們的情義相挺、友情贊助、關懷、呵護、拍打、餵. 立. 食讓我能這麼順順利利蠟燭多頭燒的完成這革命性的成就,謝謝! 特別感謝腦力. ‧ 國. 學. 激盪肝膽相照的財個小組組員們、天才率真的神童惠珉、萬無一失幫忙掩護簽到 的表哥、助理夥伴婷婷、鍵盤柯南子淇、抱佛腳夥伴潘大(以上以 BMI 排序),以. ‧. sit. io. er. Nat. 台灣的惡劣行徑,謝謝一路上有妳一起荒唐及幫忙!!. y. 及我的戰友與敵人 Lubon,好險有妳一起加入提早口試、出國交換又提早落跑回. 最後要很誠摯及嚴肅的謝謝 盧敬植老師給學生多元的知識教學及工作機會,. al. n. v i n 很榮幸有機會能擔任您兩年的助理。還有我的家人,謝謝你們給我很大的空間來 Ch engchi U. 追求完成我的規劃。揮一揮衣袖,我沒帶走太多雲彩,反倒是被帶走了好幾把傘. --謝謝政治大學。.
(5) Abstract This paper examines the factors of franchising tendency of U.S. franchise chain and investigate why some chains are more likely to expand chain scale by franchising. I explore why and how several characteristics of franchised chains influence entrepreneurs franchising decision. This study includes 969 franchise chains in automotive, food, hotel and motels, retail and. 政 治 大. service industry. Empirical results show that franchising tendency is negatively related to. 立. franchise speed and franchise chain performance, whereas franchise fee and internationalize. ‧ 國. 學. have positive impact on franchising tendency. Furthermore, we examine the models in. ‧. industrial level and find that the determinants of automotive industry’s franchising tendency. y. Nat. n. er. io. al. sit. are difference from other industries.. Ch. engchi. i n U. v. 1.
(6) Table of Contents ABSTRACT ........................................................................................................................................... 1 CHAPTER 1.. INTRODUCTION .................................................................................................. 4. CHAPTER 2.. LITERATURE REVIEW ....................................................................................... 6. CHAPTER 3.. HYPOTHESIS DEVELOPMENT......................................................................... 9. HYPOTHESIS 1. FRANCHISE TENDENCY IS NEGATIVELY ASSOCIATED WITH FRANCHISE SPEED (FS) OF ADOPTING FRANCHISE............................................................................................................................. 10. HYPOTHESIS 2.. FRANCHISE TENDENCY IS POSITIVELY ASSOCIATED WITH INITIAL INVESTMENT. COST.. 10. HYPOTHESIS 3.. FRANCHISE TENDENCY IS POSITIVELY ASSOCIATED WITH FRANCHISE FEE........ 10. HYPOTHESIS 4.. FRANCHISE TENDENCY IS POSITIVELY ASSOCIATED WITH ROYALTY FEE. ........... 11. HYPOTHESIS 5.. FRANCHISE TENDENCY IS POSITIVELY ASSOCIATED WITH MONITORING CAPACITY.. 立. ‧ 國. 學. 12. 政 治 大. FRANCHISE TENDENCY IS POSITIVELY ASSOCIATED WITH INTERNATIONALIZE. 12. HYPOTHESIS 7.. FRANCHISE TENDENCY IS NEGATIVELY ASSOCIATED WITH PERFORMANCE. ...... 13. CHAPTER 4.. ‧. HYPOTHESIS 6.. SAMPLE DESCRIPTIONS AND METHODOLOGY ......................................14. Nat. sit. y. SAMPLE AND DATA DESCRIPTIONS .............................................................................................................. 14. io. CHAPTER 5.. al. er. VARIABLE DESCRIPTIONS ............................................................................................................................ 15 EMPIRICAL RESULT..........................................................................................21. n. v i n RESULT OF FULL SAMPLE ............................................................................................................................. 21 Ch U i e h n gc RESULT OF FOOD INDUSTRY ........................................................................................................................ 25 RESULT OF AUTOMOTIVE INDUSTRY .......................................................................................................... 25 RESULT OF HOTEL AND MOTELS INDUSTRY ............................................................................................. 26 RESULT OF RETAIL INDUSTRY ..................................................................................................................... 27. CHAPTER 6.. CONCLUSIONS ....................................................................................................28. APPENDIX I .......................................................................................................................................47 APPENDIX II ......................................................................................................................................48 REFERENCES .....................................................................................................................................49. 2.
(7) List of Tables TABLE 1. DEFINITION OF VARIABLES ............................................................................................ 30 TABLE 2. SUMMARY STATISTIC OF VARIED CONTRACT ............................................................... 31 TABLE 3 DESCRIPTIVE STATISTICS OF VARIABLES ....................................................................... 32 TABLE 4 CORRELATION TABLES OF THE VARIABLES.................................................................... 35 TABLE 5 RESULT OF REGRESSION ANALYSIS OF FRANCHISE TENDENCY ................................... 36. 立. 政 治 大 F T. TABLE 6 RESULT OF REGRESSION ANALYSIS OF. RANCHISE ENDENCY IN FOOD INDUSTRY . 39. ‧ 國. 學. TABLE 7 RESULT OF REGRESSION ANALYSIS OF FRANCHISE TENDENCY- AUTOMOTIVE. ‧. INDUSTRY ................................................................................................................................... 41. sit. y. Nat. TABLE 8. RESULTS OF REGRESSION ANALYSIS OF FRANCHISE TENDENCY- HOTEL AND MOTELS. al. v i n RESULTS OF REGRESSIONC ANALYSIS OF FRANCHISE TENDENCY- RETAIL INDUSTRY 45 hengchi U n. TABLE 9. er. io. INDUSTRY ................................................................................................................................... 43. 3.
(8) Chapter 1. Introduction Franchising, a way for entrepreneurs to expand business, nowadays accounts for 3.9 percent of U.S. nonfarm private sector GDP (IFA, 2008). After the financial crisis, global economic is still in the stage of recovery. Franchising is a special business model providing job opportunity and in the same time bringing expansion of the business. According to International Franchise Association (IFA), franchise sector play an important role of job creation and franchise sector has created 184,000 new jobs in. 政 治 大. 2013 (IFA, 2013). Franchising also account for significant industrial sales in the U.S.. 立. market, which include 46% of restaurants sales, 67% of tax preparation services, 55%. ‧ 國. 學. of specialty food retailing, 71% of printing and copying, and 39% of lodging (Michael,. ‧. 1996).. Nat. sit. y. Although the dominant industry of world economy is still the manufacturing. n. al. er. io. industry, we should recognize the increasing importance role of franchise industry’s. i n U. v. influences to the economic performance of many countries. Franchising connects two. Ch. engchi. counterparties, franchisors and franchisees, via franchise contract. Franchisors granted to an individual or group (franchisees) to market a company's goods or services within a certain territory or location in contract period. The entrepreneur (franchisors) expands the business by making franchising contract with franchisees. Franchisees invest capital, human resource, regional know-how to start the business under the same brand, products, or services in the restricted region. Moreover, franchisors and franchisees’ revenue comes from different sources. The franchisors receive franchise fee from 4.
(9) franchisees using the brand name and initial capital costs is the cost of opening a unit for construction cost or equipment costs. After the operation of individual franchised unit starting, franchisors can collect royalty fee from franchisees, which normally accounts for a certain percentage of outlet sales revenue. Most franchise business is service oriented, and operated close to costumers. The service-oriented characteristics require huge human capital investment beside capital resources, especially when the entrepreneur would like to expand the business territory,. 政 治 大. across regional and global territory to become an internationalized business.. 立. International franchise provides a complete viewpoint to capture much more. ‧ 國. 學. characteristics of franchisors since most top franchisors run a global business. For. ‧. instance, Yum! Brands reported opened more than 1,000 international units in one year,. sit. y. Nat. and the totally international units closely reached 11,000 of its 30,000 units located in. io. al. er. over 100 countries (Polly, 2002). This article investigates the factors behind. v. n. entrepreneur’s choice of franchising mechanism. We define the proportion of. Ch. engchi. i n U. franchised units to total units as franchise tendency. We stand in the perspective of international franchising to determine entrepreneurs’ choice between equity-based control and franchising (Fladmoe-Lindquist & Jacque, 1995). This study may help further understanding of entrepreneur’s franchising behavior. Our empirical research covers automotive, food, hotel and motels, retail and service industries in the U.S. market. This paper is differing from prior studies that focus on specific industries. The paper is divided into five sections. Chapter 2 reviews the relevant literature 5.
(10) and theoretical foundations of this paper. Chapter 3 provides the testable hypotheses. Chapter 4 discusses the empirical model and the determinant factors on franchise tendency. The final section concludes.. Chapter 2. Literature Review Previous literature shows that there is a very high percentage for franchisors to expand the number of their outlets in the U.S. market (S. Shane, 1998). Expansion of chain system brought franchisors revenue and economics of scale. Therefore, the choice of. 政 治 大. expansion mode between franchised and company-owned outlet has brought. 立. researchers attention. The decision is much complex to a global franchise chain since a. ‧ 國. 學. global franchise may face rigorous problems compare to domestic-oriented franchise.. ‧. The choice of entry mode by entrepreneur who expand units in different region will be. sit. y. Nat. affected by the increasing monitoring and costs due to cultural differences, franchises’. io. al. er. opportunism and international experience (Burton, Cross, & Rhodes, 2000). The. v. n. following literature review explains the two main theories behind the motivation for. Ch. engchi. i n U. the expansion of chain system, i.e. resources scarcity theory and agency theory. Literatures on agency theory and resource scarcity theories are the dominant theories used in this paper to explain franchise tendency. In order to expand rapidly, entrepreneurs, subject to resource scarcity, may adopt franchise to access financial and managerial resources (Oxenfeldt & Kelly, 1969). Resource scarcity theory argues that young and small firms are difficult to raise capital and have less managerial experience. Local market knowledge is a major factor that 6.
(11) causes franchisors to adopt more franchising units. Franchise is used as a mechanism for gaining the funds required to grow their businesses fast (Lafontaine, 1992). To franchisees, industry risk, financial capital available at start-up, education level and salaried work experience are factors that are positively associated with their decisions to enter franchise chain (Williams, 1999). Agency theory, on the other hand, shows that franchising is a solution to the agency problem between franchisees and franchisors due to the fact that franchising. 政 治 大 an employee who receives立 fixed salary has less intensive to pursue maximum unit distributes all profits to the franchisees after expenses (Rubin, 1978). Outlet manager as. ‧ 國. 學. performance. In contrast, franchisees tend to pursue maximum unit performance for franchisees’ own revenue has less monitoring cost. However, in high-risk industries,. ‧. franchisees would bear the full cost of their outlet’s risk. Franchisees would require. y. Nat. er. io. sit. higher compensation for this risk makes franchising more expensive (Lafontaine, 1992). Firms use more franchising when the cost of monitoring outlets increases.. n. al. Ch. Specifically, when firms face rural, distant and. engchi. i n foreign U. v. outlets cost of frequent. travelling by monitoring personnel and the costs of assessing managers’ efforts in foreign markets are higher. Therefore, franchising systems are adopted more frequently in this situation. This paper focuses on a sample of international franchise chains because international firms face severe problems than domestic companies in both resource scarcity and agency problems. Franchisors who seek foreign franchisees have developed a high capability to work and to monitor potential franchisees opportunism than their domestic 7.
(12) counterparts(Shane, 1996) Factors influencing international franchisors’ decision to operate in franchised or company-owned outlets include host country environment, firm strategy, the availability of a support infrastructure and the franchisees’ possibility to imitate capabilities. Previous literature on global hotel sector shows that economic development, age, organization learning, strategic of size, importance of training are important factors for firms the decision to franchise (Contractor & Kundu, 1998).. 政 治 大 factors that influence global 立entrepreneurs’ decision on propensity of franchising.. This paper provides empirical results based on prior research to further examine. ‧ 國. 學. Following S. Shane (1998), this study used curvilinear effects to explain the distribution of franchised and company-owned outlets in franchise system and. ‧. provide the explanation for the optimal proportion of franchised units. This study. y. Nat. er. io. sit. contribute to the literature by verifying the behavior of franchisors seeking international franchisees (Shane, 1996) and by examining more factors to explain the. al. n. v i n question of why do firms franchise C hor why they are notUcompletely company-owned. engchi. 8.
(13) Chapter 3. Hypothesis Development This paper attempts to investigate the factors that influence the tendency to franchise on entrepreneurs. Our conceptual model is based on resources scarcity and agency theories. The conceptual model is elaborated as follows. Resource scarcity theory explains that young and small firms are difficult to raise capital in growth stage and have less experience in either managerial or financial. Firms are likely to adopt franchise when face the requirement to achieve economies of scale. 政 治 大. and expand at a rate beyond what is possible using only internally generated resources. 立. (Lafontaine, 1992; Oxenfeldt & Kelly, 1969). According to resource scarcity theorists,. ‧ 國. 學. the more resources a firm has, the less it requires franchising to expand, and therefore a. ‧. negatively associated relationship is hypothesized between size, age, rate of growth,. sit. y. Nat. and the proportion of franchising. As a result, this paper assumes the franchise. io. al. er. tendency is negatively associated with the franchise speed which is the period of time. v. n. from firm founded to expand the first franchise store and positively associated with the. Ch. engchi. i n U. star-up cost of opening a new outlet (Alon, 2001). From the view points of franchisors, when a firm could sustain longer period before adopting franchising, it’s likely to face less resource scarcity pressure. Resource scarcity theory argues that as the economic system accumulated more resources, the less it requires to franchise. Before franchising their concept, entrepreneurs usually own and manage one or more units. This experience contributes to creating and designing original and proven knowledge to improve their organizational and managerial capabilities. As a result, when franchisees are interested in a higher resource pressure’s franchise brand, franchisees could support 9.
(14) not only financial resource but also human resource. Therefore, the first hypothesis of this thesis is as follows,. Hypothesis 1. Franchise tendency is negatively associated with franchise speed (FS) of adopting franchise. Hypothesis 2. Franchise tendency is positively associated with initial investment cost. Franchisee fee and royalty fee are franchisees’ costs as well. The franchise fee is a one-time charge, up-front fee, the cost of access to the franchise chain brand name and business model (Brickley & Dark, 1987). Royalty fee is a percentage of outlet sales that. 治 政 大Franchise fee and royalty fee the franchisor collects for the duration of the relationship. 立 ‧ 國. 學. represent important financial resources that allow franchisors to develop renew knowledge (El Akremi, Perrigot, & Piot-Lepetit, 2013). Capital resources enhance. ‧. franchisors perform in challenging environments and match the changing opportunities.. Nat. sit. y. The higher the resources franchisors collect, the higher the investments in capability of. n. al. er. io. the franchise chain to efficiently exploit and explore its knowledge resources.. i n U. v. Franchisors require incentives to promote the system brand name, franchise and royalty. Ch. engchi. fee provide these incentives. The higher the royalty rate that franchisors receive, the greater return of franchising an outlet relative to the return to owning it directly, and the greater the franchisor's interest in franchising. Higher royalty fee increase franchisors’ profits (Lafontaine, 1992), also provide incentives to maintain the brand by continuous innovation and updates, as well as to franchisee fee franchisors collect. Following these arguments, we provide the following hypotheses:. Hypothesis 3. Franchise tendency is positively associated with franchise fee. 10.
(15) Hypothesis 4. Franchise tendency is positively associated with royalty fee. In addition to resource scarcity theory, franchise is supported by agency theory as well. Franchising, however, presents a two-sided moral hazard problem, wherein franchisees must also monitor the franchisor to prevent free rider (Lafontaine, 1992). There is a concern by potential franchisees over a franchisor’s potential for opportunistic behavior. Franchisors are responsible for promoting the brand, improving the product, providing service level, policing outlet quality (Combs, 2003). Franchisees are worried about the under effort franchisor made. Therefore, a trade-off exists. 治 政 大 Given this trade-off, the between the developments of franchisee monitoring capability. 立 ‧ 國. 學. greater the allocation of resources to the development of franchisee monitoring capability, the more likely the franchisor is to develop this capability. This capability. ‧. will lead enhance the franchisors. Therefore lead the franchise tendency higher.. y. Nat. er. io. sit. Monitoring experience is acquired from franchisors’ learning experience (Elango, 2007). As firms become mature and have more experience in franchising, we assume. al. n. v i n firms have better capability in monitoring C h franchisees.UFollowing Elango (2007), this engchi. paper measures monitoring capability if the franchisor had opportunities to develop monitoring skills. Franchisors would have developed the appropriate organization structure and system to monitor franchisees. Therefore, franchisors with more experience in franchising are likely to have greater monitoring capacity to monitor franchisees. And franchisees are more comfortable have business relation with franchisors with higher monitoring experienced.Therefore, we assume that the tendency to adopt franchise is likely to be higher. This argument leads to the following 11.
(16) hypothesis:. Hypothesis 5. Franchise tendency is positively associated with monitoring capacity. The agency perspective focuses on the monitoring skills of the franchisor. According to the agency perspective, firms adopt franchise because they are unable to monitor their managers efficiently (Brickley & Dark, 1987). Agency cost occur when franchisor need to monitoring outlet managers. By converting the outlet manager into an entrepreneur, franchisees’ revenue is the total profit of the outlet deducted certain. 治 政 proportion of royalty fee compared to outlet manager大 whose revenue did not match 立 ‧ 國. 學. outlet performance. Franchising therefore becomes more attractive when it is costly to directly supervise the behavior of outlet managers. Following the augments of agency. ‧. theory, we argue that monitoring problem is more severe to an international franchisor.. Nat. sit. y. Franchisors operating in international markets face greater risks in monitoring. n. al. er. io. franchisees because of cultural, legal, and political differences. Since international. i n U. v. franchisors face unfamiliar local culture, law system, and distant from franchisor. Ch. engchi. headquarter. The international business environment has greater uncertainty than the domestic business environment. Political, governmental, currency, cultural, and macroeconomic differences across nations make international business more uncertain compare to domestic business. Therefore, franchising reduces the need to monitor outlet managers’ effort because franchisees typically make substantial investments in their outlets (Elango, 2007). This argument leads to the following hypothesis:. Hypothesis 6. Franchise. tendency. is. positively. associated. with 12.
(17) internationalize. This paper examines whether performance is a factor that influences entrepreneur’s decision on tendency of franchising. Franchising as an expansion strategy has a positively associated effect on growth and survival (Shane, 1996). Through investigates for firm growth and survival, Shane (1996) found that franchise model provide a way to overcome moral hazard and adverse selection. He proposed that franchising is a mechanism of minimizing agency problems of growth. An alternative argument is that firms adopt franchising due to the demand of achieve. 治 政 大 only internally generated economies of scale and expand quickly beyond using 立 ‧ 國. 學. resources. Once such economies are achieved, rapid expansion is no longer necessary and mature franchisors would cease franchising and ultimately become primarily. ‧. company-owned mode to seek maximizing returns. Because firm ownership is. Nat. sit. y. presumably more profitable, the franchisor will repurchase its most profitable. n. al. er. io. franchised outlets (Oxenfeldt & Kelly, 1969). Based on above arguments, this paper proposes that:. Ch. engchi. i n U. v. Hypothesis 7. Franchise tendency is negatively associated with performance.. 13.
(18) Chapter 4. Sample descriptions and Methodology SAMPLE AND DATA DESCRIPTIONS To obtain information on the franchise tendency characteristics for a sample of franchise firms, I collect 970 samples from two complementary sources- Entrepreneur Magazine and Franchise Times Magazine issued in 2006 to 2013 to enhance completeness of the research in the viewpoint of international. The Annual Franchise 500 published by Entrepreneur Magazine provides information about franchised chain. 政 治 大. name, funding year, franchise year, initial capital, franchising fee, royalty fee,. 立. availability of U.S region and foreign region (sample in Appendix I). The Top 200. ‧ 國. 學. Franchise Systems published by Franchise Times Magazine provides the top 200. ‧. chains’ worldwide sales, foreign units and domestic units of the business chain. sit. y. Nat. (sample in Appendix II).. n. al. er. io. Both sources’ rankings are based on U.S. franchisor surveys, and published. i n U. v. figures only include franchisors that responded to the surveys. Both of magazines. Ch. engchi. check the figures provided by franchisors before publishing them. The information is generally objective because franchisors do not have any particular interest in providing incorrect information that would be quickly detected by prospective franchisees (Shane, 1996). Many of previous empirical research relied on these data (Alon, 2001; El Akremi et al., 2013; Elango, 2007; S. Shane, 1998). In the process of matching these two data, the combination process is to match the franchise name provided by Entrepreneur Magazine to franchise concept and franchise 14.
(19) parents that provided by Franchise Times Magazine. There were 970 firms from 2006 to 2013 that are reported by these two magazines. Table 1 describes the definition of variables used in this thesis in details.. VARIABLE DESCRIPTIONS Dependent Variable: Tendency of franchise To test the above hypotheses, this paper uses total franchise units divided by total units as franchising tendency proxy. In the franchise mechanism, franchisees provide. 治 政 大 innovations by using managerial skills to update the chain’s knowledge, fostering 立 ‧ 國. 學. knowledge on local markets, making new capabilities available, and hence fueling franchisor growth and making substantial investments in their units (Shane, 1998).. ‧. Company ownership, in contrast, promotes standardization, guarantees valuable. Nat. sit. y. replication, eliminates double moral hazer problem and effectively execute. n. al. er. io. entrepreneurs business model. However, franchising is useful when demand is. i n U. v. growing and uncertainty exists. As the proportion of franchised units increases,. Ch. engchi. resource could be provided by franchisees, acknowledge updating and performance improve. Following Shane (1996), this paper contributes to prior literature by adding performance factor into discussion to explain the question of why firms franchise or why they are not completely company-owned.. 15.
(20) Independent Variable: Franchise speed (FS) Following Lafontaine (1992), Franchise speed is measured as the number of years between the founded year of the firm and the year the firm began to franchise. The length of time between the founding of the company and its first effort to franchise is considered because franchisors can build up company-owned outlets before franchising. According to the resource scarcity theory discussed in previous sections, I assume that. 政 治 大. there is a negative relationship between the length of franchise speed and franchising. 立. tendency.. ‧. ‧ 國. 學. Capital. Capital is measured as the dollar value in thousand of the investment necessary to. y. Nat. er. io. sit. open an outlet. This variable has been used in studies by Caves and Murphy (1976), Elango (2007). Due to the scale problem, we took logarithm on capital dollar amount in. n. al. the regression model.. Ch. engchi. i n U. v. Franchise Fee The franchise fee is measured as the million dollar amount of the up front fee that the franchisee must pay to the franchisor to buy the franchise outlet. This variable has been used by Caves and Murphy (1976), Tsang (2013). Royalty Rate The royalty rate is measured as the percentage of outlet sales that franchisees must 16.
(21) pay to franchisors for participation in the system. This variable has been used by Elango (2007). Experience Experience is measured as by franchising experience year period. This mechanism followed Elango (2007), which measures monitoring experience to capture if the franchisor had opportunities to develop monitoring skills. Franchise age is calculated by data point year minus the year the franchise chain adopted franchising. The age of. 政 治 大. the company is included in El Akremi et al. (2013) to examine the relation between age. 立. and franchise chain’s performance .. ‧. ‧ 國. 學. Internationalize. Internationalize is measured as by international units divided by total outlet units.. y. Nat. er. io. sit. In the topic of internationalize, most of studies investigate the factors of internationalization. This paper follows the mechanism used in Contractor and Kundu. al. n. v i n (1998) to investigate the franchise hotel sector, Cmodal h e ningglobal h c i U. Contractor and Kundu. (1998) used the ratio of foreign to total number of hotels as the proxy of international experience. Performance Performance is measured as worldwide sales (in MM) of the franchise chain provided by Franchise Times Magazine. El Akremi et al. (2013) has found out proportion of franchised units has curvilinear influence on chains’ performance. In this 17.
(22) paper, though we adopt sales as the proxy of performance.. Control variable: Seeking foreign Seeking foreign is a dummy variable, which is one if Entrepreneur Magazine indicated the franchise chain seeks for foreign expansion opportunity and others are zero. When entrepreneur seeking the opportunity to expand overseas territory, the decision of opining units by franchising or company-owned might be different.. 立. Financing Provided. 政 治 大. ‧ 國. 學. Financing provided is measured as a dummy variable, which is one if. ‧. Entrepreneur Magazine indicated that the franchisor provides financing to new. sit. y. Nat. franchisees following Shane (1996). The provision of financing is controlled because. io Varied contract. al. n. different.. er. financing makes franchises easier to sell and this might cause the tendency of franchise. Ch. engchi. i n U. v. Some franchise contract information of initial capital, franchising fees and royalty fee that provided by Entrepreneur Magazine are not fixed amount or percentage. To compromise and evaluate the influence of this effect, this paper add in the dummy variable which is one if one of initial capital, franchising fees and royalty fee is not a fixed amount or percentage. Table 2 presents summary of distribution on varied contract by industry. A varying contract may bring higher franchise flexibility. 18.
(23) Therefore, this paper controls the varied contract. Parent adjustment When conducting combination of two data resource, here’s the problem of inconsistent in franchise concept and franchise parent occurred in hotel and motels industry. Franchise Times Magazine provides franchise information of franchise concept and detail information of the concept’s world sales and franchise parent, foreign units and domestic units. Entrepreneur Magazine, however, provide the name. 政 治 大. of franchise which doesn’t’ differentiate the franchise concept or franchise parents and. 立. provide information about the franchised chain name’s funding year, franchise year,. ‧ 國. 學. initial capital, franchising fees, royalty fee, availability of U.S region and foreign. ‧. region. The combination process is matching the franchise name provided by. sit. y. Nat. Entrepreneur Magazine to franchise concept and franchise parents that provided by. io. al. er. Franchise Times Magazine. In the hotel and motels industry, some franchise names. v. n. provided by Entrepreneur Magazine failed to match the franchise concepts but. Ch. engchi. i n U. franchise parents’ name provided by Franchise Times Magazine. In our sample, 75 out of 203 hotels and motels firms has this problem. In this case, to compromise data matching, this paper used franchise parents’ funding year, franchise year, franchising fees, royalty fee, availability of U.S region and foreign region data that provided by Entrepreneur Magazine as the franchise concepts’ information with the assigned dummy variable to be one if the data point is adjusted in the prior situation. Industry 19.
(24) Industry is a dummy variable for franchisors in each of the following industries: automotive, food, hotel and motels, retail, and service. While Entrepreneur Magazine separates industries in 13 industries type, this paper takes business services, children's business, financial services, home improvement, maintenance, personal care, pets, recreation, and service as a join industry category named service. The characteristics of the industry segment in which the franchise system is found might influence entrepreneurs' preferences for organizational form (Caves & Murphy, 1976). The usage of aggregate industry categories is consistent with previous research on franchising. 治 政 大 to ensuring control on the (Shane, 1998). This industry categorization scheme helps 立 ‧. ‧ 國. 學. different entrepreneur’s franchising tendency behavior within industries.. n. er. io. sit. y. Nat. al. Ch. engchi. i n U. v. 20.
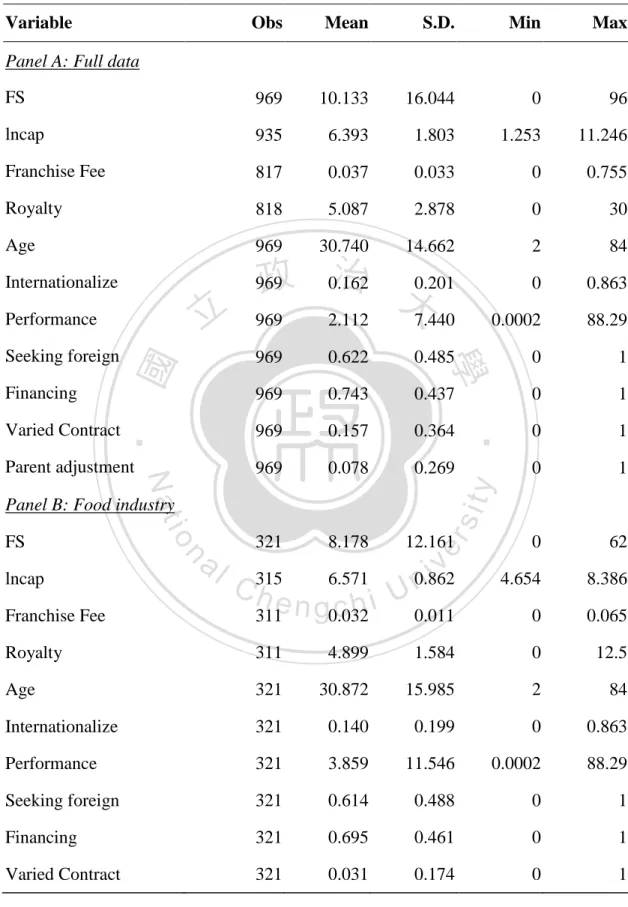
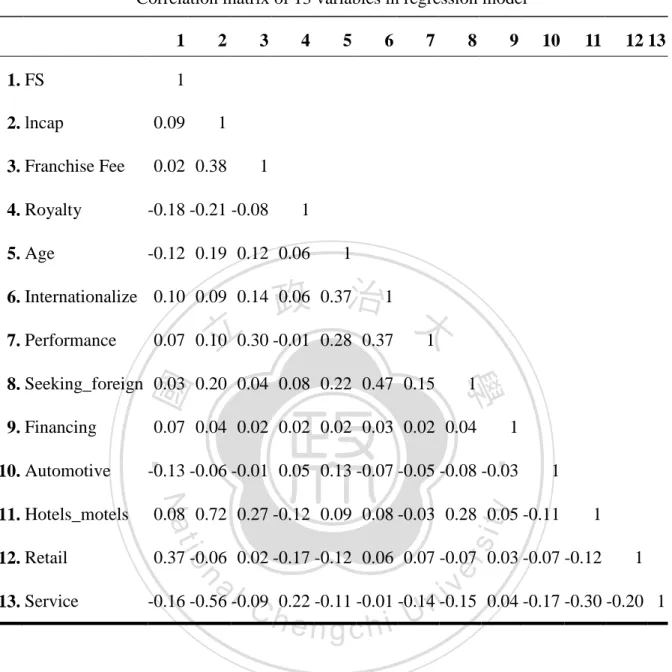
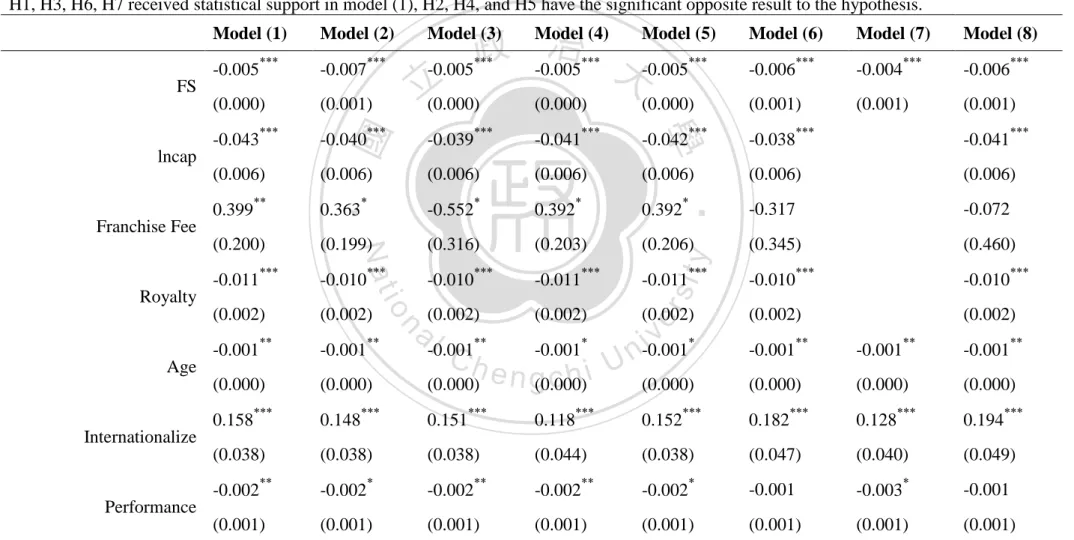
(25) Chapter 5. Empirical Results RESULT OF FULL SAMPLE The descriptive statistics are shown in Table 3 Panel A, while correlations between the independent and industry control variables are shown in Table 4. The correlation matrix shows that the collinearity problems between the independent variables and the industry dummy variables are not severe. I use ordinary least squares (OLS) regression model in this paper. The dependent. 治 政 大 of franchise units to total variable, tendency of franchise, is modeled as the proportion 立 ‧ 國. 學. units, which is total franchised units divided by total units of the franchise system. Table 5 presents the regression results of eight models. Model (1) in Tables 5 analyzes. ‧. the data pooled over the eight years from 2006 to 2013, and includes dummy variables. Nat. sit. y. for each of the years 2007, 2008, 2009, 2010, 2011, 2012, and 2013. Since the variables. n. al. er. io. of initial capital, franchise fee and royalty fee are included in model (1), According to. i n U. v. the missing data for contract flexibility mentioned above, there’s 870 data points left in model.. Ch. engchi. The variance inflation factors in model (1) were all less than 4, indicating that multicollinearity is not a major concern for our regression results. I show that shorter waiting period before franchising correlates significantly and negatively correlated with higher franchising tendency and franchise fee is significantly related to franchising tendency. Internationalization of the franchise chain significant positively correlated to franchise tendency, and franchise chain worldwide sales, which is the 21.
(26) proxy of performance is significant negatively correlated to franchise tendency. However, results for initial capital, royalty fee and experience of the H2, H4, and H5 are inconsistent with the hypotheses. Pricing policy of franchise mechanism consists of three elements – initial capital, franchise fee, and royalty fee. To attract franchisees, franchisors might set the price at lower levels and therefore, fulfill the target of expansion growth. From the other point of view, when franchisees consider ranges of suitable franchise chain to join, price. 政 治 大 franchisee, franchisees are 立 likely to choose the lower investment cost and higher retain. might be an important concern. Since most of risk of opening new outlet is taken by. ‧ 國. 學. profit one to join.. ‧. In model (1), initial capital and royalty fee are significant negatively related to. sit. y. Nat. franchise tendency, while franchise fee is significant positively related to franchise. io. al. er. tendency. It might happen that franchisors attract franchisees by lowering royalty fee. v. n. which means franchisees could retain higher proportion of outlet revenue (Tsang, 2013),. Ch. engchi. i n U. and through higher franchise fee to earn the financial capital franchisors require for develop acknowledge and expansion. Our empirical results fail to support the hypothesis of the experience. Every model in table 3 shows negative relation in age and tendency of franchise. Alon (2001) had the same empirical results for U.S. retail industry. In contrast to the predictions of resource-scarcity theory, Combs, Michael, and Castrogiovanni (2004) found that larger firms actually used more franchising in their development. Prior studies showed weak 22.
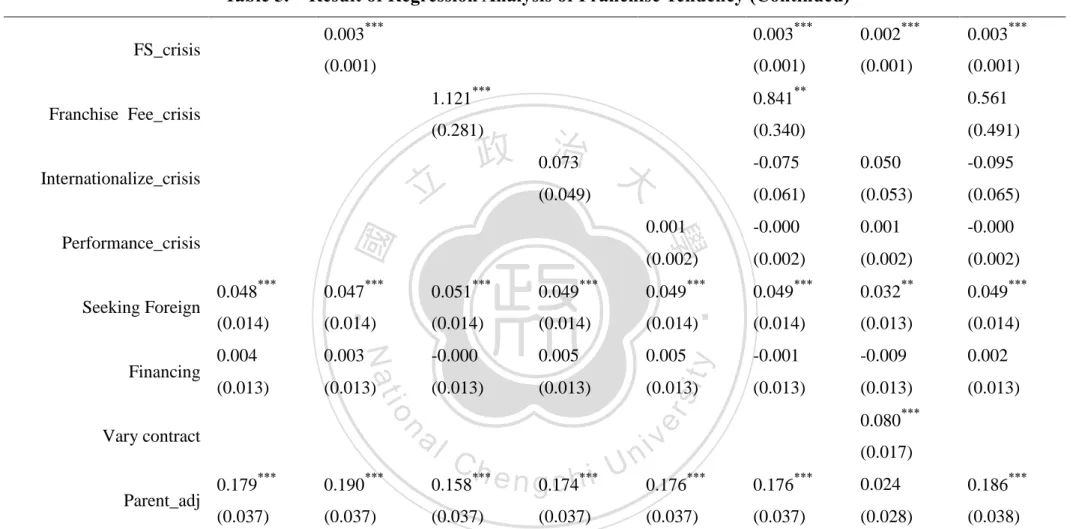
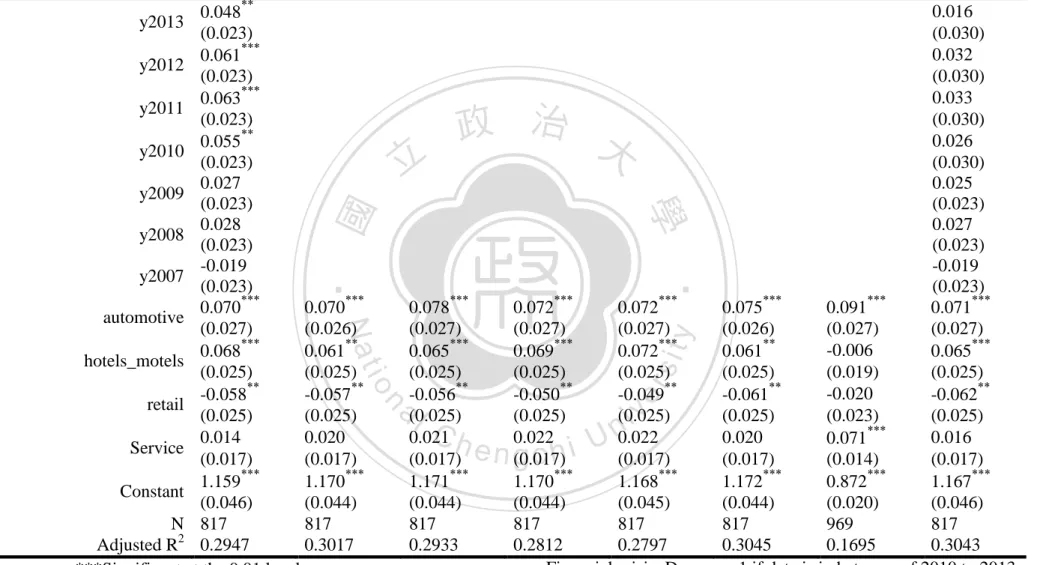
(27) negative relationship between the age of the franchisor and the use of franchising and no relationship at all between the growth of the franchisor and the use of franchising. However, monitoring experience is positively related to the probability of opening franchised unit in foreign market (Elango, 2007). Internationalization has significantly positive effect with tendency of franchise in every model of Table 5. Year and industry dummy variables showed that franchise tendency is significant higher than base year of 2006 after year 2010. Entrepreneur Magazine and Franchise. 政 治 大 that the magazine issued 立 in 2010 contained information of 2009, issued in 2011. Times Magazine published the franchise information of the prior year. This means. ‧ 國. 學. contained information of 2010, and so on.. ‧. Model (1) shows that franchise tendency is significant higher than base year of. sit. y. Nat. 2006 after year 2010, which implies franchise tendency is higher after 2009. It is. io. al. er. reasonable since financial crisis is likely change the franchisors’ decision on the policy. v. n. of opening unit, and is likely to transfer risk of opening new unit to franchisees while. Ch. engchi. i n U. market has higher uncertainty. To further examine the financial crisis’ effect with independent variable, in the regression model, this paper introduces a dummy variable of financial crisis, which is one if the data is after 2010, which assign to zero when the data is in between of 2006 to 2009. In table 5, model (2) to model (5) respectively examine the interact effect of financial crisis with franchise speed, franchise fee, internationalize, and performance. Empirical result is the same in model (6) that brought into all interact factors. FS_crisis and internationalize_crisis have significant positive effect on franchise tendency, which means after financial crisis, it took 23.
(28) franchisors waiting longer to franchise and while franchise fee higher, franchisors’ tendency to franchise higher. This result indicates that franchisors might have risk concern on expansion after crisis, and it took franchisor longer period to decide franchising and instead of opening company-owed unit. Franchisor would rather make profit through franchise fee than opening company-owed unit by itself in an uncertainty market. To further examine the influence of the varied contract problem, Model (7) in. 政 治 大 model exclude independent立 variable of initial capital, franchise fee and royalty fee, and. Table 5 investigates the flexible contract effect on franchising tendency, therefore the. ‧ 國. 學. add in the dummy variable of varied contract. Results of model (7) in Table 5 show that varied contract has a significant and positive relation with franchise tendency. A higher. ‧. flexibility contract might suits varying potential franchisors in different region or. y. Nat. er. io. sit. varied store scale. Therefore, result suggests that mechanism of flexible contract is a tool for franchisors attracting varying potential franchisees.. n. al. Ch. engchi. i n U. v. Model (8) in Table 5 shows the result of full model including all variable discussed. After considering the effect of financial crisis, result of control variable of year dummies are no longer different from 2006, and others have robust result as prior. However, control variables of industries in model (8) indicate automotive, hotel and motels and retail are significant different from base lone industry - food industry. Therefore, following will separately differentiate the data in industry level. To further understand the characteristics of every industry, the descriptive statistics of food industry is provided in Table 3 Panel B, the descriptive statistics of Automotive 24.
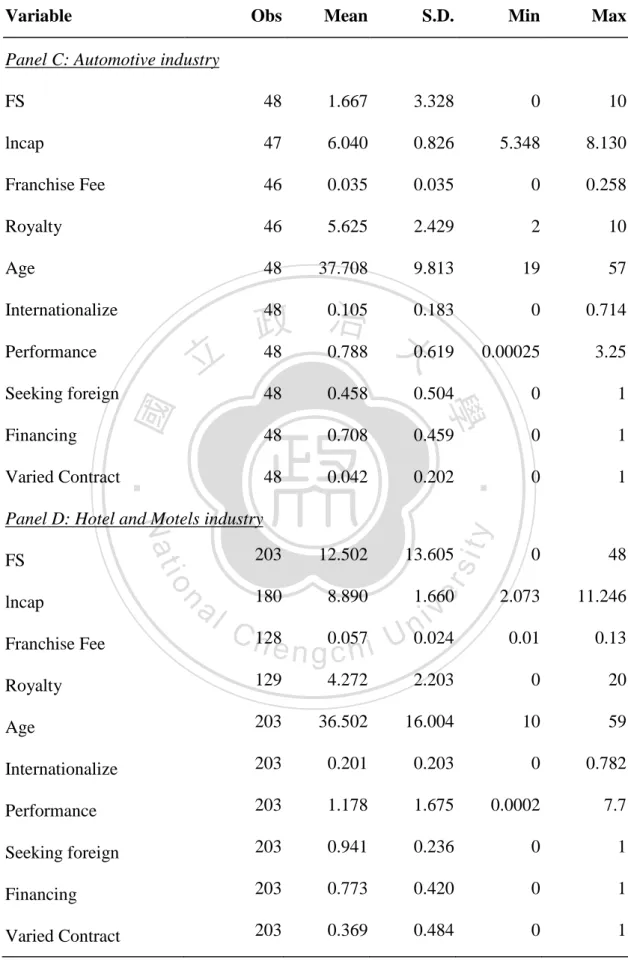
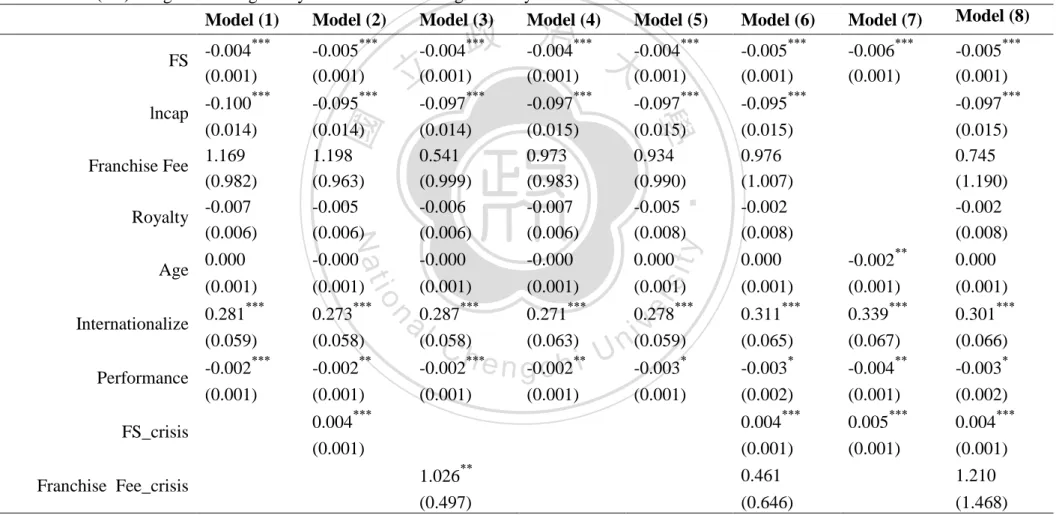
(29) industry is provided in Table 3 Panel C, the descriptive statistics of Hotel and Motels industry is provided in Table 3 Panel D and the descriptive statistics of Retail industry is provided in Table 3 Panel E.. RESULT OF FOOD INDUSTRY The top 5 performances franchise brands in food industry during 2006 to 2013 are McDonald's, KFC, Subway, Pizza Hut and Burger King. Empirical result of automotive industry is presented in Table 6 followed the regression model of table 5.. 治 政 According to Table 6, H1, H3, H6, H7 is proved as大 predicted. However, Franchise 立 ‧ 國. 學. Fee (H3) is not significant, Royalty fee (H4) is negatively related to franchising tendency. Experience (H5) shows little impact in food industry, consider to the. ‧. characteristic of food industry that most of firms in food industry are fast food. Nat. sit. y. restaurant, with higher automation product processes in production. Experience has. n. al. er. io. less impact is acceptable. Surprisingly of the result is seeking foreign has negatively. i n U. v. relationship with franchising tendency, although it not significant. This result might be. Ch. engchi. explained by the result of performance (H7) in Table 6, it presents performance is significant negatively related to franchising tendency. While franchising chain has higher performance in sales, it will be inclined to open units by company-owned. When it seeking for foreign market shares, it will have higher intendancy to open by company.. RESULT OF AUTOMOTIVE INDUSTRY The top 5 performances franchise brands in Automotive industry during 2006 to 2013 are Dollar Rent a Car, Midas Auto Service Experts, Jiffy Lube, J.D. Byrider, Big O 25.
(30) Tires. Interesting empirical result of automotive industry is presented in Table 7 followed the regression model of table 3. Regression result supports H3, H4 and H5, and is inconsistent with prediction on H1, H2, H6 and H7. Most of firms in Automotive industry provide service of appearance services, auto products services, maintenance services and renting. These services require higher technical level, higher training level in work force and more orientated in domestic market to serve clients. Above reason explained Automotive industry took longer period of time to adopt franchising and FS is positively related to franchise tendency.. 政 治 大 RESULT OF HOTEL AND立 MOTELS INDUSTRY. ‧ 國. 學. The top 5 performances franchise brands in Hotel and Motels industry during 2006 to. ‧. 2013 are Hilton Hotels and Resorts, Howard Johnson, Holiday Inn Hotels, Hampton. sit. y. Nat. Inn, Comfort Inn. When collecting and matching data from two sources, it had. io. al. er. matching problem in Hotel and Motels industry as discussed prior. Therefore, this. v. n. paper adds the control variable of parent adjustment into empirical regression model. Ch. and results is presented in Table 8.. engchi. i n U. The characteristics of Hotel and Motels industry are high capital investment for construction, landing and decoration. Research result in Table 8 shows that H1, H5, H6, H7 is proved as predicted in hypothesis. However, capitals (H2), franchise fee (H3) and royalty fee (H4) are inconsistent with to prediction. Result implied hotels and motels have less resource scarcity and major factors of franchising tendency are not from these three factors. Parent adjustment has significantly positive result in 26.
(31) Model (7) Table 8, which means using capital, franchise fee and royalty fee from parent company have effect on franchising. This is constraint of data in this research.. RESULT OF RETAIL INDUSTRY The top 5 performances franchise brands in Hotel and Motels industry during 2006 to 2013 are 7-Eleven, Ace Hardware, Circle K, RadioShack and ampm. Empirical result of automotive industry is presented in Table 9. According to Table 9, H1, H2, H3, H7 is proved as predicted. However, Royalty. 治 政 fee (H4) and Experience (H5) are significantly negative大 related to franchising tendency 立 ‧ 國. 學. and internationalize (H6) is not robust in Retail industry. After financial crisis, franchise fee has significant positive relationship with franchising tendency, it might be. ‧. risk transferred from franchisors to franchisees. Franchisors make profit through. Nat. sit. y. collection franchise fee from franchisees; lower royalty fee is a tool of attracting. n. al. er. io. franchisees. Year control variables show there is increasing franchising tendency yearly.. i n U. v. From result of Model (2) to Model (6), after financial crisis FS_crisis, Franchise. Ch. engchi. Fee_crisis, Internationalize_crisis all are positive related to franchise tendency. However, Performance_crisis is positively related to franchising tendency, franchisees may use performance result to attract franchisors to join and transfer risk of opening new outlet in uncertainty environment.. 27.
(32) Chapter 6. Conclusions The results of this study indicate that franchising tendency is related to franchise speed, initial capital, franchise fee, royalty fee, experience, internationalize and franchise chain performance. However, the results of royalty fee are inconsistent with hypothesis in full data model and industrial model. These findings support the theoretical model presented earlier. Furthermore have contribution of analysis automotive, food, hotel and motels, retail and service industry. Surprisingly this research found automotive. 政 治 大 the characteristic of automotive 立 industry that operates much more domestic oriented.. industry has different factors effect on franchising tendency. Explain these findings by. ‧ 國. 學. Internationalize and franchise performances are both shown to have significant. ‧. relation with franchising tendency, while internationalization has positive relationship. sit. y. Nat. with franchising tendency and performance has negative relation with franchising. io. al. er. tendency. However, the establishment of a foreign franchise is a form of international. v. n. expansion. As contractual forms of international business are thought to be more likely. Ch. engchi. i n U. to fail than contractual forms of domestic business, franchisors require to develop superior mechanisms that protect them against franchisee opportunism if they are to expand overseas successfully. The study also shows that franchising tendency is different after the recent credit financial crisis. Further examine the effect of financial crisis and founding that franchise fee is significantly positive related to franchising tendency. It indicates that in an uncertainty global financial environment, franchisors would earn the profit by 28.
(33) franchising instead of open a unit by company. In this way, franchisors could not only earn the franchise fee but also transfer the risk and expand the franchise chain in the same time. To attract franchisees, franchisors would lower royalty lever, promise higher proportion of unit revenue to franchisees. Other explanation of higher franchise tendency is that the rent is cheaper in financial crisis period. For further research, it could be further compare the factors of single franchise brand with the industry to if the brand is outlier situation or not. Also, further researcher. 政 治 大 provide researchers, franchisors 立 and potential franchisees to better understanding on could examine the trend of factors within data period. Hopefully, this study could. ‧. ‧ 國. 學. io. sit. y. Nat. n. al. er. franchising.. Ch. engchi. i n U. v. 29.
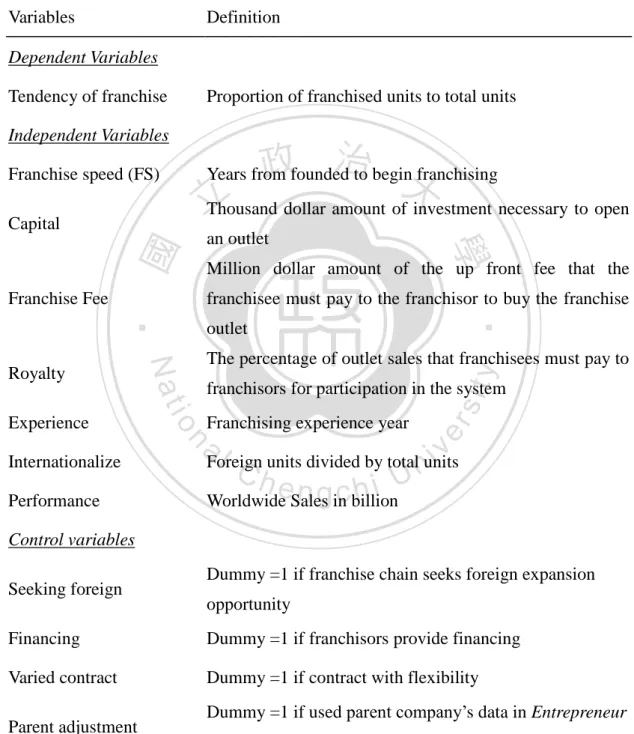
(34) Table 1. Definition of Variables Definition summary of variables Variables. Definition. Dependent Variables Tendency of franchise. Proportion of franchised units to total units. Independent Variables. 政 治 大. Franchise speed (FS). Years from founded to begin franchising. 立 Thousand dollar amount of investment necessary to open. Capital. ‧ 國. franchisee must pay to the franchisor to buy the franchise. ‧. outlet. y. The percentage of outlet sales that franchisees must pay to. sit. franchisors for participation in the system Franchising experience year. al. Performance. Worldwide Sales in billion. n Internationalize. Ch. er. io. Experience. Million dollar amount of the up front fee that the. Nat. Royalty. 學. Franchise Fee. an outlet. i n U. v. Foreign units divided by total units. engchi. Control variables Seeking foreign. Dummy =1 if franchise chain seeks foreign expansion opportunity. Financing. Dummy =1 if franchisors provide financing. Varied contract. Dummy =1 if contract with flexibility. Parent adjustment. Dummy =1 if used parent company’s data in Entrepreneur Magazine. 30.
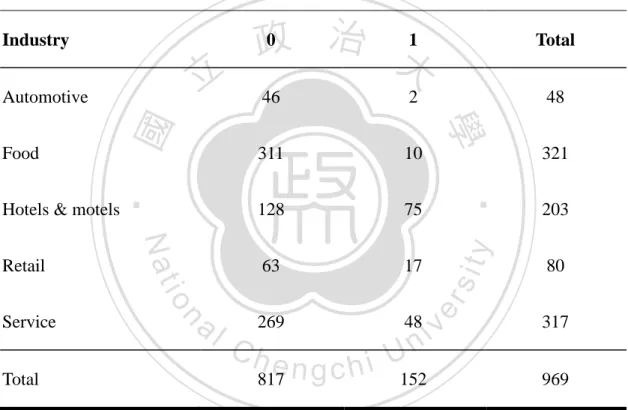
(35) Table 2.. Summary Statistic of Varied Contract. Summary of distribution on the dummy variable- varied contract by industry Industry. 立. al. n. Total. 10. 128. 75. 63. 17. 269. 48. Ch. sit er. io. Service. 311. 48 321 203. y. Nat. Retail. 2. ‧. Hotels & motels. 46. Total. 學. Food. ‧ 國. Automotive. 治 1 0 政 大. v ni. U i e h n c g 817 152. 80 317 969. Note: Dummy =1 if contract with flexibility. 31.
(36) Table 3. Descriptive Statistics of Variables. Summary descriptive statistics of regression model variables Variable. Obs. Mean. S.D.. Min. Max. FS. 969. 10.133. 16.044. 0. 96. lncap. 935. 6.393. 1.803. 1.253. 11.246. Franchise Fee. 817. 0.037. 0.033. 0. 0.755. Royalty. 818. 5.087. 2.878. 0. 30. Age. 969. 30.740. 14.662. 2. 84. Internationalize. 969. 0. 0.863. Panel A: Full data. 立. 0.0002. 88.29. 969. 0.622. 0.485. 0. 1. 969. 0.743. 0.437. 0. 1. 969. 0.157. 0.364. 0. 1. 969. 0.078. 0.269. 0. 1. 321. 8.178. 12.161. iv 0.862 n U. 0. 62. 4.654. 8.386. 0.011. 0. 0.065. sit. y. Nat. Parent adjustment. 7.440. Panel B: Food industry. io. FS. al. n. lncap Franchise Fee. ‧. Varied Contract. 2.112. Ch. 315. 6.571. e n g0.032 chi. 311. er. Financing. 969. 學. Seeking foreign. ‧ 國. Performance. 治 0.201 政 0.162 大. Royalty. 311. 4.899. 1.584. 0. 12.5. Age. 321. 30.872. 15.985. 2. 84. Internationalize. 321. 0.140. 0.199. 0. 0.863. Performance. 321. 3.859. 11.546. 0.0002. 88.29. Seeking foreign. 321. 0.614. 0.488. 0. 1. Financing. 321. 0.695. 0.461. 0. 1. Varied Contract. 321. 0.031. 0.174. 0. 1. 32.
(37) Table 3.. Descriptive Statistics of Variables (Continued). Variable. Obs. Mean. S.D.. Min. Max. FS. 48. 1.667. 3.328. 0. 10. lncap. 47. 6.040. 0.826. 5.348. 8.130. Franchise Fee. 46. 0.035. 0.035. 0. 0.258. Royalty. 46. 5.625. 2.429. 2. 10. Age. 48. 37.708. 9.813. 19. 57. 48 0.105 0.183 政 治 大 48 0.788 0.619. 0. 0.714. 0.00025. 3.25. Panel C: Automotive industry. Internationalize. 立. Performance. 0.458. 0.504. 0. 1. Financing. 48. 0.708. 0.459. 0. 1. 48. 0.042. 0.202. 0. 1. 203. 12.502. 13.605. 0. 48. 180. 8.890. 1.660. 2.073. 11.246. C h128 0.024 e n g0.057 chi U. 0.01. 0.13. Varied Contract. n. Franchise Fee. al. y. sit. io. lncap. er. FS. Nat. Panel D: Hotel and Motels industry. ‧. ‧ 國. 48. 學. Seeking foreign. v ni. Royalty. 129. 4.272. 2.203. 0. 20. Age. 203. 36.502. 16.004. 10. 59. Internationalize. 203. 0.201. 0.203. 0. 0.782. Performance. 203. 1.178. 1.675. 0.0002. 7.7. Seeking foreign. 203. 0.941. 0.236. 0. 1. Financing. 203. 0.773. 0.420. 0. 1. Varied Contract. 203. 0.369. 0.484. 0. 1 33.
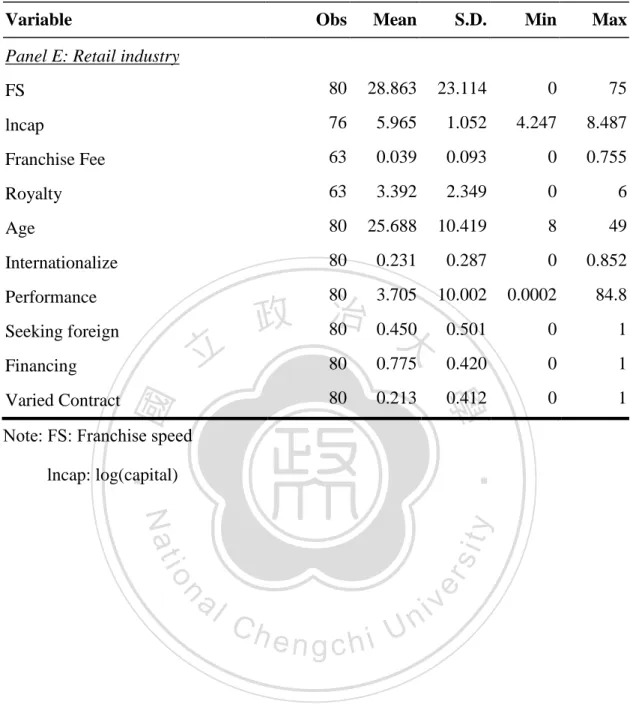
(38) Table 3.. Descriptive Statistics of Variables (Continued). Variable. Obs. Mean. S.D.. Min. Max. FS. 80. 28.863. 23.114. 0. 75. lncap. 76. 5.965. 1.052. 4.247. 8.487. Franchise Fee. 63. 0.039. 0.093. 0. 0.755. Royalty. 63. 3.392. 2.349. 0. 6. Age. 80. 25.688. 10.419. 8. 49. Internationalize. 80. 0.231. 0.287. 0. 0.852. 政 治 80 0.450 大. 80. 3.705. 10.002. 0.0002. 84.8. 0.501. 0. 1. 80. 0.775. 0.420. 0. 1. 80. 0.213. 0.412. 0. 1. Panel E: Retail industry. Performance Seeking foreign. 立. Financing. ‧ 國. 學. Varied Contract. Note: FS: Franchise speed. ‧. lncap: log(capital). n. er. io. sit. y. Nat. al. Ch. engchi. i n U. v. 34.
(39) Table 4. Correlation Tables of the Variables. Correlation matrix of 13 variables in regression model 1 1. FS. 2. 3. 4. 5. 6. 7. 8. 9. 10. 11. 12 13. 1. 2. lncap. 0.09. 1. 3. Franchise Fee. 0.02 0.38. 1. 4. Royalty. -0.18 -0.21 -0.08. 1. 5. Age. -0.12 0.19 0.12 0.06. 1. 政 治1 大. 6. Internationalize 0.10 0.09 0.14 0.06 0.37 7. Performance. 立. 0.07 0.10 0.30 -0.01 0.28 0.37. 1. 0.07 0.04 0.02 0.02 0.02 0.03 0.02 0.04. 1. ‧. -0.13 -0.06 -0.01 0.05 0.13 -0.07 -0.05 -0.08 -0.03. Nat. y. 10. Automotive. ‧ 國. 9. Financing. 1. 學. 8. Seeking_foreign 0.03 0.20 0.04 0.08 0.22 0.47 0.15. 1. 12. Retail. 0.37 -0.06 0.02 -0.17 -0.12 0.06 0.07 -0.07 0.03 -0.07 -0.12. n. al. er. sit. 0.08 0.72 0.27 -0.12 0.09 0.08 -0.03 0.28 0.05 -0.11. io. 11. Hotels_motels. 13. Service. Ch. i n U. 1 1. v. -0.16 -0.56 -0.09 0.22 -0.11 -0.01 -0.14 -0.15 0.04 -0.17 -0.30 -0.20 1. engchi. 35.
(40) Table 5. Result of Regression Analysis of Franchise Tendency. The dependent variable, tendency of franchise, is modeled as the proportion of franchise units to total units, which is total franchised units divided by total units of the franchise system. Following contain total data estimated by OLS method. Model (1) is base model. Model (2) to Model (5) respectively examine the interact effect of financial crisis. Model (6) aggregate all financial crisis interact effect. Model (7) examines the effect of contract flexibility. Model (8) is full model. H1, H3, H6, H7 received statistical support in model (1), H2, H4, and H5 have the significant opposite result to the hypothesis. Model (2). -0.005***. -0.007***. (0.000). (0.001). -0.043***. -0.040***. -0.039***. -0.041***. -0.042***. -0.038***. -0.041***. (0.006). (0.006). (0.006). (0.006). (0.006). (0.006). (0.006). 0.399**. 0.363*. -0.552*. 0.392*. 0.392*. -0.317. -0.072. (0.200). (0.199). (0.316). (0.203). (0.206). (0.345). (0.460). -0.011***. -0.010***. -0.010***. -0.011***. -0.011***. -0.010***. -0.010***. (0.002). (0.002). (0.002). (0.002). er. Model (5) 治 政 -0.005 大-0.005 -0.005 立(0.000) (0.000) (0.000). Model (1). (0.002). (0.002). (0.002). -0.001**. -0.001**. -0.001**. -0.001*. (0.000). (0.000). (0.000). 0.158***. 0.148***. 0.151***. (0.038). (0.038). -0.002** (0.001). y. ‧ 國. io. n. al. ***. ‧. Nat. Royalty. ***. 學. Franchise Fee. Model (4). sit. ***. FS. lncap. Model (3). iv * -0.001 n U. Model (6). Model (7). Model (8). -0.006***. -0.004***. -0.006***. (0.001). (0.001). (0.001). -0.001**. -0.001**. -0.001**. (0.000). (0.000). (0.000). (0.000). 0.118***. 0.152***. 0.182***. 0.128***. 0.194***. (0.038). (0.044). (0.038). (0.047). (0.040). (0.049). -0.002*. -0.002**. -0.002**. -0.002*. -0.001. -0.003*. -0.001. (0.001). (0.001). (0.001). (0.001). (0.001). (0.001). (0.001). Age. Ch. e n g(0.000) chi. Internationalize. Performance 36.
(41) Table 5. FS_crisis. Result of Regression Analysis of Franchise Tendency (Continued) 0.003***. 0.003***. 0.002***. 0.003***. (0.001). (0.001). (0.001). (0.001). Franchise Fee_crisis. Internationalize_crisis. (0.281). (0.340). (0.491). 治 政 0.073 大. -0.075. 0.050. -0.095. (0.061). (0.053). (0.065). 0.001. -0.000. 0.001. -0.000. (0.002). (0.002). (0.002). (0.002). (0.049). ‧ 國. 學. 0.051***. 0.049***. 0.049***. 0.049***. 0.032**. 0.049***. (0.014). (0.014). (0.014). (0.014). (0.014). (0.014). (0.013). (0.014). 0.004. 0.003. -0.000. 0.005. 0.005. -0.001. -0.009. 0.002. (0.013). (0.013). (0.013). (0.013). (0.013). (0.013). (0.013). (0.013). 0.080***. n. y. sit. er. io. al. ‧. 0.047***. Vary contract. Parent_adj. 0.561. 0.048***. Nat. Financing. 0.841**. 立. Performance_crisis. Seeking Foreign. 1.121***. C *** h. 0.179***. 0.190***. 0.158. (0.037). (0.037). (0.037). e n g0.174 c h***i (0.037). i n U. v. (0.017). 0.176***. 0.176***. 0.024. 0.186***. (0.037). (0.037). (0.028). (0.038). 37.
(42) Result of Regression Analysis of Franchise Tendency (Continued). 立. 0.016 (0.030) 0.032 (0.030) 0.033 (0.030) 0.026 (0.030) 0.025 (0.023) 0.027 (0.023) -0.019 (0.023) *** *** *** *** 0.072 0.072 0.075 0.091 0.071*** (0.027) (0.027) (0.026) (0.027) (0.027) *** *** ** -0.006 0.069 0.072 0.061 0.065*** (0.025) (0.025) (0.025) (0.019) (0.025) -0.020 -0.050** -0.049** -0.061** -0.062** (0.025) (0.025) (0.025) (0.023) (0.025) *** 0.022 0.022 0.020 0.016 0.071 (0.017) (0.017) (0.017) (0.014) (0.017) *** *** *** *** 1.170 1.168 1.172 0.872 1.167*** (0.044) (0.045) (0.044) (0.020) (0.046) 817 817 817 969 817 0.2812 0.2797 0.3045 0.1695 0.3043 Financial crisis: Dummy =1 if data is in between of 2010 to 2013 FS_crisis: FS* financial crisis Franchise Fee_crisis: Franchise Fee* financial crisis Internationalize_crisis: Internationalize* financial crisis 38 Performance_crisis: Performance* financial crisis. 政 治 大. io. n. al. Ch. y. sit. ‧ 國. 學. Nat. 0.078*** (0.027) 0.065*** (0.025) -0.056** (0.025) 0.021 (0.017) 1.171*** (0.044) 817 0.2933. ‧. 0.048** (0.023) 0.061*** y2012 (0.023) 0.063*** y2011 (0.023) 0.055** y2010 (0.023) 0.027 y2009 (0.023) 0.028 y2008 (0.023) -0.019 y2007 (0.023) 0.070*** 0.070*** automotive (0.027) (0.026) *** 0.068 0.061** hotels_motels (0.025) (0.025) -0.058** -0.057** retail (0.025) (0.025) 0.014 0.020 Service (0.017) (0.017) *** 1.159 1.170*** Constant (0.046) (0.044) N 817 817 2 Adjusted R 0.2947 0.3017 ***Significant at the 0.01 level. **Significant at the 0.05 level. *Significant at the 0.10 level. y2013. er. Table 5.. engchi. i n U. v.
(43) Table 6 Result of Regression Analysis of Franchise Tendency in Food Industry Examine the dependent variable, tendency of franchise, in food industry with OLS method. Model (1) is base model. Model (2) to Model (5) respectively examine the interact effect of financial crisis. Model (6) aggregate all financial crisis interact effect. Model (7) examines the effect of contract flexibility. Model (8) is full model. H1, H3, H6, H7 is proved as predicted. Franchise Fee (H3) is not significant, Royalty fee (H4) is negatively related to franchising tendency. Performance (H7) is significant negatively related to franchising tendency. Model (8) Model (1) Model (2) Model (3) Model (4) Model (5) Model (6) Model (7). -0.002*** (0.001). -0.002** (0.001). Royalty. -0.097*** (0.015) 0.973 (0.983) -0.007 (0.006) -0.000 (0.001). -0.097*** (0.015) 0.934 (0.990) -0.005 (0.008) 0.000 (0.001). ***. (0.001). ***. FS_crisis Franchise Fee_crisis. ***. ***. 0.271 0.278 a 0.287 iv l(0.058) C h*** (0.063)** U n(0.059) -0.002 e n g -0.002 -0.003* chi. n. Performance. io. Internationalize. -0.097*** (0.014) 0.541 (0.999) -0.006 (0.006) -0.000 (0.001). 立. Nat. Age. -0.005*** (0.001). y. 0.273*** (0.058). Franchise Fee. ***. sit. 0.281*** (0.059). lncap. ***. er. -0.095*** (0.014) 1.198 (0.963) -0.005 (0.006) -0.000 (0.001). ‧ 國. -0.100*** (0.014) 1.169 (0.982) -0.007 (0.006) 0.000 (0.001). 治 政 -0.004 -0.004 大 (0.001) (0.001). -0.004*** (0.001). ‧. -0.005*** (0.001). 學. -0.004*** FS (0.001). 0.004 (0.001). 1.026** (0.497). (0.001). (0.001). -0.006*** (0.001). -0.005*** (0.001). -0.095*** (0.015) 0.976 (1.007) -0.002 (0.008) 0.000 (0.001). -0.002** (0.001). -0.097*** (0.015) 0.745 (1.190) -0.002 (0.008) 0.000 (0.001). 0.311*** (0.065). 0.339*** (0.067). 0.301*** (0.066). -0.003* (0.002). -0.004** (0.001). -0.003* (0.002). 0.004*** (0.001) 0.461 (0.646). 0.005*** (0.001). 0.004*** (0.001) 1.210 (1.468) 39.
(44) Table 6.. Result of Regression Analysis of Franchise Tendency in Food Industry (Continued). Internationalize_crisis. -0.100. (0.073). (0.097). (0.097). (0.100). 0.002. 0.001. 0.002. (0.002). (0.002). (0.002). -0.028. 0.002. -0.028. (0.019). (0.020). (0.019). (0.002) 治 政 -0.028 -0.025 大-0.025 立(0.019) (0.019) (0.019). -0.030. (0.019). (0.018). 0.003. -0.007. -0.005. -0.001. -0.001. -0.008. -0.019. -0.001. (0.019). (0.018). (0.018). (0.018). (0.018). (0.018). (0.019). (0.019). (0.086). 0.3448. No. No. Yes. 1.494***. 1.497***. 1.484***. 1.454***. 0.904***. 1.472***. (0.087). (0.089). (0.097). (0.098). (0.026). (0.101). 311. 311. 321. 311. 0.3177. 0.3423. 0.1933. 0.3428. y. No. a311 l C h. n. Adjusted R2 0.3276. 311. No. 0.3268. 311. e n g0.3176 chi. sit. (0.090). No. (0.051). er. 1.471***. io. 1.489***. N 311. ‧. No. 0.063. Nat. Year control Yes. ‧ 國. -0.028. Vary contract. Constant. -0.018. 學. Financing. -0.124. 0.001. Performance_crisis Seeking Foreign. 0.031. i n U. v. ***Significant at the 0.01 level. **Significant at the 0.05 level. *Significant at the 0.10 level.. 40.
(45) Table 7. Result of Regression Analysis of Franchise Tendency- Automotive Industry. Examine the dependent variable, tendency of franchise, in Automotive industry with OLS method. Model (1) is base model. Model (2) to Model (5) respectively examine the interact effect of financial crisis. Model (6) aggregate all financial crisis interact effect. Model (7) examines the effect of contract flexibility. Model (8) is full model. Regression result supports H3, H4 and H5, and is inconsistent with prediction on H1, H2, H6, and H7.. Franchise Fee_crisis Internationalize_crisis Performance_crisis. al. n. FS_crisis. io. Performance. 政 治 大. Ch. engchi. y. sit. Internationalize. Nat. Age. Model (5) 0.008 (0.006) -0.046** (0.022) 0.333 (0.342) 0.009 (0.007) 0.004** (0.002) -0.463*** (0.163) 0.000 (0.029). ‧. Royalty. 立. Model (4) 0.010 (0.006) -0.051** (0.023) 0.364 (0.359) 0.007 (0.007) 0.005** (0.002) -0.499*** (0.167) 0.018 (0.028). 學. Franchise Fee. Model (3) 0.015** (0.006) -0.059** (0.022) 0.438 (0.348) 0.006 (0.007) 0.006*** (0.002) -0.513*** (0.165) 0.024 (0.028). er. lncap. Model (2) 0.015** (0.007) -0.059** (0.022) 0.471 (0.355) 0.006 (0.007) 0.006*** (0.002) -0.501*** (0.166) 0.022 (0.028) -0.005 (0.005). ‧ 國. FS. Model (1) 0.011 (0.007) -0.056** (0.026) 0.393 (0.413) 0.006 (0.008) 0.005** (0.002) -0.462** (0.210) 0.018 (0.032). i n U. v. -0.740 (0.636) 0.054 (0.104). 0.031* (0.018). Model (6) 0.016*** (0.006) -0.051*** (0.017) 0.369 (0.268) 0.010* (0.005) 0.006*** (0.001) -0.396*** (0.123) -0.045* (0.024) 0.008 (0.006) -4.474*** (0.945) -0.294** (0.125) 0.160*** (0.028). Model (7) 0.003 (0.006). 0.005*** (0.002) -0.327*** (0.104) -0.028 (0.024) -0.007 (0.005). -0.155 (0.157) 0.064** (0.029). Model (8) 0.014** (0.006) -0.040** (0.019) 0.255 (0.299) 0.015** (0.007) 0.005*** (0.002) -0.442** (0.159) -0.043 (0.026) 0.016* (0.009) -7.060*** (2.448) -0.224 (0.149) 0.150*** (0.035) 41.
(46) Table 7. Seeking Foreign Financing. Results of Regression Analysis of Franchise Tendency- Automotive Industry (Continued) 0.040. (0.024). 0.040* (0.024). 0.014. 0.014. (0.025). (0.021). 0.039. 0.039. (0.027). (0.024). 0.043* (0.023). 0.064*** (0.018). 0.040* (0.023). 0.070*** (0.019). 0.014. 0.014. 0.018. 0.029. (0.021). (0.022). (0.021). 0.036** (0.016). No. No. No. (0.021) 0.006 (0.059) No. 0.041** (0.018). 0.961*** (0.112) 46. 0.743*** (0.076) 48. 0.886*** (0.136) 46. 0.7173. 0.4378. 0.7053. Vary contract. 1.002*** (0.155) 46. 0.989*** (0.150) 46. 0.4580. 0.4629. 0.4464. 0.4845. Yes. n. al. er. io. sit. y. Nat. ***Significant at the 0.01 level. **Significant at the 0.05 level. *Significant at the 0.10 level.. 1.011*** (0.153) 46. ‧. Adjusted R2 0.3535. 1.021*** (0.155) 46. 學. 1.022*** (0.184) N 46. Constant. 立 No. No. ‧ 國. Year control Yes. 政 治 大. Ch. engchi. i n U. v. 42.
(47) Table 8.. Results of Regression Analysis of Franchise Tendency- Hotel and Motels Industry. Examine the dependent variable, tendency of franchise, in Automotive industry with OLS method. Model (1) is base model. Model (2) to Model (5) respectively examine the interact effect of financial crisis. Model (6) aggregate all financial crisis interact effect. Model (7) examines the effect of contract flexibility. Model (8) is full model. Add the control variable of parent adjustment into regression model. H1, H5, H6, H7 is proved as predicted in hypothesis. Capital (H2), franchise fee (H3) and royalty fee (H4) have opposite result to prediction. Model (1) Model (2) Model (3) Model (4) Model (5) Model (6) Model (7) Model (8). Performance. (0.018). ***. -0.006***. -0.003**. -0.006***. (0.002). (0.001). (0.002). -0.056***. -0.053***. -0.055***. -0.053***. -0.046**. (0.016). (0.016). (0.017). (0.016). (0.017). (0.019). -1.349. -1.206. -2.081**. -1.236. -1.109. -2.334**. -3.331**. (0.914). (0.828). (0.838). (0.842). (0.831). (1.008). (1.600). -0.009. -0.009. -0.009. -0.009. -0.010. -0.011*. -0.011. (0.007). (0.006). (0.006). (0.007). (0.006). (0.001) 0.267. ***. (0.001) 0.283. ***. (0.079). (0.076). -0.028*** (0.009). 0.001. 0.002. y. sit. 0.002. 0.002. er. 0.001. a (0.001) (0.001) (0.001) i v *** l C *** n 0.245 h 0.274 e n g0.199 chi U. n. Internationalize. -0.051***. io. Age. -0.052***. Nat. Royalty. (0.001). ***. ‧. Franchise Fee. (0.001). 治 政 -0.006 -0.005 大 立(0.001) (0.001) (0.001) -0.005***. 學. lncap. -0.007***. ‧ 國. FS. -0.006***. (0.007) 0.001. 0.003. (0.001) 0.362. (0.007). **. **. 0.001. (0.001). (0.001). 0.020. 0.376**. (0.076). (0.140). (0.076). (0.172). (0.097). (0.188). -0.029***. -0.026***. -0.030***. -0.042***. -0.027. -0.060***. -0.026. (0.009). (0.009). (0.009). (0.010). (0.016). (0.014). (0.018). 43.
(48) Results of Regression Analysis of Franchise Tendency- Hotel and Motels Industry (Continued). FS_crisis. 0.002. 0.001. -0.001. 0.001. (0.001). (0.002). (0.002). (0.002). Franchise Fee_crisis. Internationalize_crisis. -0.142. (0.179). (0.136). (0.196). 0.018*. -0.000. 0.014. -0.002. (0.010). (0.016). (0.020). 0.248***. 0.424***. 0.410***. (0.057). (0.057). (0.055). (0.057). (0.056). (0.062). (0.059). (0.069). 0.057*. 0.062**. 0.050*. 0.061**. 0.061**. 0.048. -0.010. 0.051. (0.030). (0.029). (0.029). (0.029). (0.029). (0.030). (0.030). (0.031). n. al. Ch. 0.118**. 0.106**. (0.054). (0.051). e n g(0.052) chi U (0.048). No. No. 0.999***. 1.028***. (0.139) 0.6784. y. sit. ‧ 國. 0.411***. ‧. 學. 0.282. 0.405***. io. Adjusted R. -0.134. 0.421***. N 128 2. (1.547) **. 0.379***. Year control Yes Constant. (0.702). 治 政 0.114 大 (0.119). 0.395***. Vary contract Parent_adj. (0.448). 2.316. (0.019). Nat. Financing. 1.438**. 立. Performance_crisis Seeking Foreign. 1.243***. -0.037. er. Table 8.. 0.107**. 0.100*. v ni. (0.037). 0.095*. 0.098*. -0.088**. 0.088. (0.049). (0.052). (0.043). (0.058). No. No. No. No. Yes. 1.067***. 1.016***. 1.034***. 1.068***. 0.660***. 1.052***. (0.120). (0.118). (0.120). (0.119). (0.120). (0.062). (0.144). 128. 128. 128. 128. 128. 203. 128. 0.6831. 0.6967. 0.6791. 0.6857. 0.6905. 0.2874. 0.6750 44.
(49) Table 9. Results of Regression Analysis of Franchise Tendency- Retail Industry. Examining the dependent variable, tendency of franchise, in Automotive industry with OLS method. Model (1) is base model. Model (2) to Model (5) respectively examine the interact effect of financial crisis. Model (6) aggregate all financial crisis interact effect. Model (7) examines the effect of contract flexibility. Model (8) is full model. Regression result supports H1, H2, H3 and H7, and has opposite results to predict on H4, H5 and H6.. FS_crisis Franchise Fee_crisis Internationalize_crisis Performance_crisis. al. n. Performance. Ch. engchi. y. sit. io. Internationalize. Nat. Age. 政 治 大. Model (5) -0.007*** (0.001) 0.036 (0.027) 0.224 (0.819) -0.089*** (0.013) -0.008** (0.003) 0.060 (0.153) -0.016 (0.012). ‧. Royalty. Model (4) -0.007*** (0.001) 0.026 (0.028) 0.304 (0.839) -0.086*** (0.014) -0.006* (0.003) -0.014 (0.171) -0.001 (0.007). 學. Franchise Fee. 立. Model (3) -0.007*** (0.001) 0.025 (0.026) -2.562** (1.247) -0.087*** (0.013) -0.006** (0.003) 0.060 (0.145) -0.007 (0.007). er. lncap. Model (2) -0.009*** (0.002) 0.030 (0.027) 0.643 (0.820) -0.089*** (0.013) -0.009** (0.003) 0.008 (0.150) -0.003 (0.007) 0.003** (0.001). ‧ 國. FS. Model (1) -0.008*** (0.001) 0.012 (0.027) 1.050 (0.814) -0.097*** (0.013) -0.010*** (0.003) -0.048 (0.154) -0.005 (0.007). i n U. v. 3.546*** (1.201) 0.088 (0.151). 0.017* (0.009). Model (6) -0.007*** (0.002) 0.044 (0.027) -3.139* (1.569) -0.091*** (0.013) -0.009** (0.003) 0.320 (0.193) -0.026 (0.016) 0.001 (0.002) 4.268*** (1.553) -0.470** (0.217) 0.021 (0.016). Model (7) -0.006*** (0.002). -0.000 (0.003) 0.037 (0.138) 0.011 (0.012) 0.003 (0.002). -0.104 (0.177) -0.006 (0.013). Model (8) -0.006*** (0.002) 0.040 (0.029) -2.238 (1.987) -0.100*** (0.013) -0.012*** (0.004) 0.254 (0.195) -0.037** (0.017) -0.001 (0.002) 3.646* (2.068) -0.523** (0.219) 0.030* (0.017) 45.
(50) Results of Regression Analysis to Franchise Tendency- Retail Industry (Continued). 0.276*** (0.081) 0.012 Financing (0.054). Seeking Foreign. 0.189** (0.075) 0.009 (0.051). 0.205*** (0.073) -0.019 (0.050). Vary contract ***. 立. 0.174** (0.075) 0.019 (0.052). 政 治 大. 0.051 (0.064) -0.030 (0.061) 0.302*** (0.075). ‧. ‧ 國. 學 y. Nat. io. al. n 1.145*** (0.156) 63 0.6299. 0.208*** (0.072) 0.006 (0.051). sit. 0.330 (0.109) 0.348*** y2012 (0.115) 0.364*** y2011 (0.120) 0.290** y2010 (0.119) 0.252** y2009 (0.119) 0.215* y2008 (0.125) 0.197* y2007 (0.109) 1.018*** Constant (0.168) N 63 Adjusted R2 0.6569 ***Significant at the 0.01 level. **Significant at the 0.05 level. *Significant at the 0.10 level. y2013. 0.171** (0.078) 0.004 (0.053). er. Table 9.. Ch. 1.156*** (0.151) 63 0.6537. e n g1.121 c h***i (0.164) 63 0.5984. i n U. v. 1.105*** (0.157) 63 0.6194. 1.093*** (0.153) 63 0.6682. 0.852*** (0.097) 80 0.2141. 0.292*** (0.079) 0.038 (0.056) 0.300** (0.126) 0.328** (0.131) 0.349** (0.138) 0.279** (0.135) 0.295** (0.119) 0.266** (0.126) 0.266** (0.113) 0.895*** (0.173) 63 0.6799. 46.
(51) Appendix I Sample of Entrepreneur Magazine issued 2013.. 立. 政 治 大. ‧. ‧ 國. 學. n. er. io. sit. y. Nat. al. Ch. engchi U. v i n. 47.
(52) Appendix II Sample of Franchise Times Magazine issued 2013.. 立. 政 治 大. ‧. ‧ 國. 學. n. er. io. sit. y. Nat. al. Ch. engchi U. v i n. 48.
(53) References Alon, I. (2001). The Use of Franchising by US‐Based Retailers. Journal of Small Business Management, 39(2), 111-122. Brickley, J. A., & Dark, F. H. (1987). The choice of organizational form the case of franchising. Journal of Financial Economics, 18(2), 401-420. Burton, F., Cross, A. R., & Rhodes, M. (2000). Foreign market servicing strategies of UK franchisors: an empirical enquiry from a transactions cost perspective. MIR: Management International Review, 373-400.. 政 治 大. Caves, R. E., & Murphy, W. F. (1976). Franchising: firms, markets, and intangible assets. Southern Economic Journal, 572-586.. 立. Meta-Analysis.. Journal. of. Management,. 10.1016/s0149-2063(03)00019-9. 學. A. ‧ 國. Combs, J. (2003). Why Do Firms Use Franchising as an Entrepreneurial Strategy?: 29(3),. 443-465.. doi:. ‧. Combs, J., Michael, S., & Castrogiovanni, G. (2004). Franchising: A Review and. y. Nat. Avenues to Greater Theoretical Diversity. Journal of Management, 30(6),. er. io. sit. 907-931. doi: 10.1016/j.jm.2004.06.006. Contractor, F. J., & Kundu, S. K. (1998). Franchising versus company-run. n. al. i n U. v. operations: Modal choice in the global hotel sector. Journal of International Marketing, 28-53.. Ch. engchi. El Akremi, A., Perrigot, R., & Piot-Lepetit, I. (2013). Examining the Drivers for Franchised Chains Performance through the Lens of the Dynamic Capabilities Approach. Journal of Small Business Management, n/a-n/a. doi: 10.1111/jsbm.12059 Elango, B. (2007). Are Franchisors with International Operations Different from Those Who Are Domestic Market Oriented?*. Journal of Small Business Management, 45(2), 179-193. Fladmoe-Lindquist, K., & Jacque, L. L. (1995). Control modes in international 49.
數據
+7
相關文件
By using the case study and cross analysis of the results, The Purpose of this research is find out the Business implementing Supply Chain Management system project, Our study
of each cluster will be used to derive the search range of this cluster. Finally, in order to obtain better results, we take twice the length of
From the spatial programming at traditional retail markets, this study proposed the conclusions and recommendations of the size, arrangement and position about traditional
Results indicate that the proposed scheme reduces the development cost, numbers of design change, and project schedule of the products, and consequently improve the efficiency of
This study focuses on the need of walking to school for middle-grades students and designs related teaching plans.This study firstly conducts a questionnaire
The results of this study found that the experimental group had higher scores than the control group, demonstrated the curricula of the global warming, energy-saving and
This paper proposes a set of graph algorithm to improve the application of hill-climbing, Tested to speed up the program execution time is about 3.5 times speed up
This study investigates the effects of the initial concentration, initial pH value, and adsorption temperature on the adsorption behaviors between Cr(IV) ion with a
