molecular dynamics simulations: Temperature, pressure, and density effects
Huan-Chang Tseng, Jiann-Shing Wu, and Rong-Yeu Chang
Citation: The Journal of Chemical Physics 130, 084904 (2009); doi: 10.1063/1.3080768 View online: http://dx.doi.org/10.1063/1.3080768
View Table of Contents: http://scitation.aip.org/content/aip/journal/jcp/130/8?ver=pdfcov Published by the AIP Publishing
Articles you may be interested in
Nonlinearity and slip behavior of n-hexadecane in large amplitude oscillatory shear flow via nonequilibrium molecular dynamic simulation
J. Chem. Phys. 136, 104904 (2012); 10.1063/1.3693269
Master curves and radial distribution functions for shear dilatancy of liquid n -hexadecane via nonequilibrium molecular dynamics simulations
J. Chem. Phys. 130, 164515 (2009); 10.1063/1.3123171
Shear thinning and shear dilatancy of liquid n -hexadecane via equilibrium and nonequilibrium molecular dynamics simulations: Temperature, pressure, and density effects
J. Chem. Phys. 129, 014502 (2008); 10.1063/1.2943314
A comparison of simple rheological models and simulation data of n-hexadecane under shear and elongational flows
J. Rheol. 50, 625 (2006); 10.1122/1.2240308
Rheological and structural studies of liquid decane, hexadecane, and tetracosane under planar elongational flow using nonequilibrium molecular-dynamics simulations
J. Chem. Phys. 122, 184906 (2005); 10.1063/1.1897373
Material functions of liquid n-hexadecane under steady shear via
nonequilibrium molecular dynamics simulations: Temperature, pressure,
and density effects
Huan-Chang Tseng,1Jiann-Shing Wu,1,a兲and Rong-Yeu Chang2 1
Department of Applied Chemistry, National Chiao Tung University, Hsinchu, Taiwan 30010, Republic of China
2
Department of Chemical Engineering, National Tsing Hua University, Hsinchu, Taiwan 30043, Republic of China
共Received 30 July 2008; accepted 16 January 2009; published online 26 February 2009兲
Computer experiments of rheology regarding the effects of temperature 共T兲, pressure 共P兲, and density共兲 on steady shear flow material functions, which include viscosity 共兲 and first and second normal stress coefficients 共1 and 2兲 depending on shear rate 共␥˙兲, have been conducted via nonequilibrium molecular dynamics simulations for liquid n-hexadecane. Straightforwardly, using both characteristic values of a zero-shear-rate viscosity and critical shear rate,-␥˙ flow curves are well normalized to achieve the temperature-, pressure-, and density-invariant master curves, which can be formulary described by the Carreau–Yasuda rheological constitutive equation. Variations in the rate of shear thinning, obviously exhibiting in -␥˙ , 1-␥˙ , and −2-␥˙ relationships, under different T, P, andvalues, are concretely revealed through the power-law model’s exponent. More importantly, at low shear rates, the fluid explicitly possesses Newtonian fluidic characteristics according to both manifestations; first and second normal stress differences decay to near zero, while nonequilibrium states are close to equilibrium ones. Significantly, the tendency to vary of the degree of shear thinning in rheology is qualitatively contrary to that of shear dilatancy in thermodynamics. In addition, a convergent transition point is evidently observed in the −2/1-␥˙
curves undergoing dramatic variations, which should be associated with shear dilatancy, as addressed analytically. © 2009 American Institute of Physics.关DOI:10.1063/1.3080768兴
I. INTRODUCTION
Nonequilibrium molecular dynamics共NEMD兲1–3 simula-tions do provide a valuable tool in academia and industry via microscopic understanding of the observed macroscopic phe-nomena for rheological properties. At present, most of NEMD applications have been conducted from simple fluid4,5 to increasingly complex fluids, including n-alkane,6–17 alcohol18 and ketone19 molecules, polymer melt,20–27water molecules,19,28and molten alkali halides,29,30 as well as organic and polymeric mixture solutions, and blending.31–35 Such simulations can be employed in both shear and elongation flows,24,27 which involve both steady and transient state flow systems.22,23 Nevertheless, NEMD studies are concentrated mostly in steady state shear flows. Apart from a few noteworthy reports for oscillatory shear flows, both important features of fluids—linear viscoelastic and thermorheological simplistic—have been recently pre-sented using NEMD simulations.36
The steady shear material functions37–39 involve viscos-ity and first and second normal stress coefficients. In rheol-ogy, nonlinear manifestations, such as shear thinning, shear thickening, and normal stress differences, have been com-monly observed for polymeric fluids. The first and second
normal stress differences are responsible to a variety of sig-nificant effects in the polymeric liquid flows, looking for examples37 of the rod climbing 共or Weissenberg兲, the die swell, the hole-pressure phenomena, and so on. Essentially, Newtonian and non-Newtonian fluids can be recognized by zero and nonzero normal stress differences, respectively.38
In early NEMD researches,4,5the argon共Ar兲 fluid at high shear rates possessed both rheological characteristics, namely, shear thinning behavior and nonzero normal stress differences. Also, shear dilatancy of nonequilibrium thermo-dynamic state, which is related to the shear-rate dependence of pressure or density, was clearly observed. In particular, Heyes4and Evans and Morriss5inspected that one important issue was the presence of shear thickening, which occurred abruptly at a very extreme shear rate of over 1⫻1013 s−1.
This excessive shear rate, however, may be impossibly achieved in the current practical experimental technologies. It obviously shows that the causes of non-Newtonian behav-iors resulted in NEMD simulations of simple fluids are dif-ficult to understand according to our macroscopic cognition of fluid mechanics. In passing, the experimental results of Ballman40 indicted surprisingly that the sudden increase in the viscosity of polystyrene melt was examined at a higher shear rate of 7600 s−1.
Up to now, a number of NEMD studies8,10–13,31 on dif-ferent state points have analyzed various n-alkane molecules, containing linear and branch structures, and have
investi-a兲Author to whom correspondence should be addressed. Electronic mail:
[email protected]. Present address: Science Building 2, 1001 Ta Hsueh Road, Hsinchu, Taiwan 30010, Republic of China.
共2009兲
0021-9606/2009/130共8兲/084904/16/$25.00 130, 084904-1 © 2009 American Institute of Physics
gated nonequilibrium thermodynamic states and rheological properties, as well as molecular conformations and configu-rations; thus, those results are also in qualitative agreement with related experimental and theoretical results. Signifi-cantly, Bair et al.13 presented evidence of the NEMD simu-lation data following the same time-temperature superposi-tion master curve41,42 with experimental data together for squalane fluid. With respect to n-hexane/n-hexadecane mix-ture, the concentration dependence of viscosity was achieved by Kioupis and Maginn.31
For sheared alcohol molecules, Petravic and Delhommelle18 employed the optimized potential for liquid simulations potential mode to describe the hydrogen bond interaction; accordingly, their findings at high shear rates em-phasized the interrelationship between breaking, stability, and alignment of hydrogen bond and shear thinning. Espe-cially for ionic particles’ Coulombic forces described by us-ing an accuracy method of the Edwald summation, Galamba et al.30 conducted the NEMD simulation on molten alkali halides including sodium chloride 共NaCl兲 and potassium chloride 共KCl兲. As mentioned above, whether dealing with these various sheared fluids at the molecular level, the rela-tionship between viscosity and shear rate has been invariably presented—the shear thinning behavior at high shear rates.
Regarding NEMD studies on polymer melt, the finite extensible nonlinear elastic 共FENE兲 potential21,43–45 can al-ways coarse grain the chain motion between two beads. From short to long linear chain molecules, Kröger and Hess21 built the FENE chain motion to analyze the relation-ship between the zero-shear-rate viscosity 共0兲 and the mo-lecular length 共N兲. Consequently, the 0-N relationship
clearly represents a critical chain length characterizing the crossover point from 0⬀N1 of Roused model to 0
⬀N3.0–3.5 of reptation model.46
In both transient and steady state nonlinear flow22,23 for shear rates varying from 30 to 3000 s−1 and chain lengths varying from C
80H162 to
C800H1602, Padding and Briels47investigated rheological data 共shear viscosity and normal stress differences兲 and structural data 共chain dimensions and orientation tensor兲 by using NEMD simulations with a coarse-grained model of polyeth-ylene 共PE兲. Furthermore, Jabbarzadeh et al.25 and Bosko et al.26 clearly presented that the viscosity increases with in-creasing degree of branches of molecular architecture. In ad-dition, the polymer blending study with respect to linear and branched structures was done by Bosko et al.,34who pointed out that the percentage of branched polymer chains enhances so that the overall blending viscosity correspondingly in-creases.
As reviewing the aforementioned NEMD studies, most of attentions worthy are limited with respect to rheological properties, specifically, being related to the molecular intrin-sic structures and the blending ratio of branched to linear polymers. According to rheological treatises,37–39 however, primary factors of induced variations in rheological proper-ties are of course temperature, pressure, and density depen-dent, as well as molecular structure dependent. Except for the few noteworthy NEMD researches,11,15 the effects of temperature, pressure, and density on rheological properties have not been examined completely so far.
More recently, we have reported the NEMD discussions17 of liquid n-hexadecane in terms of the varia-tions in shear thinning and shear dilatancy with temperature, pressure, and density. The objective of the present study is to focus on in-deep analyses of rheological properties—the shear-rate共␥˙兲 dependence of viscosity 共兲 and the first and second normal stress coefficients共1and2兲. These
proper-ties varying with different temperatures, pressures, and den-sities are performed by both constant volume NEMD and constant pressure NEMD simulations.1,3,48
In this present study, Carreau–Yasuda37,39 rheological constitutive equations of the generalized Newtonian fluid are utilized to describe the overall-␥˙ curve, while the0value in the first-Newtonian plateau region is reasonably extrapo-lated. Furthermore, the relaxation time 共R兲 can be assessed by the modified Rouse theory.7,17,41 The critical shear rate 共␥˙c兲, which occurred from the first-Newtonian plateau to the shear thinning region, approaches the inverse of the relax-ation time, namely,␥˙c⬇R
−1
.7Significantly, by selecting both characteristic values of 0 and ␥˙c values,14,35 we can also reduce -␥˙ data to obtain temperature-, pressure-, and density-invariant master curves. Even if NEMD simulations have been well established in literature, those master curves have not been extensively discussed so far. Therefore, the master curves obtained from NEMD simulations should be significant, especially for rheological computations.
The shear thinning characteristic not only occurs explic-itly at -␥˙ curve but also in both 1-␥˙ and −2-␥˙ relation-ships. Simultaneously, the slope of shear thinning can be easily described by the power-law model. Notably, under dif-ferent temperatures, pressures, and densities, we obtain the qualitative relationship between variations in the degree of shear thinning and shear dilatancy. Moreover, we analytically observe the dramatic variations in −2/1-␥˙ curves and their
convergent transition共CT兲 point.
The sections of this present study are organized as fol-lows. In Sec. II, we describe the details of the molecular models, simulation methods, and steady shear material func-tions. In Sec. III, we reveal the results of rheological prop-erties performed at varying temperatures, pressures, and den-sities, and compare the results with the earlier related experiments, theories, and NEMD simulations. Overall con-clusions and future works are summarized in Sec. IV.
II. SIMULATION DETAILS
In a previous study,17we performed NEMD simulations for sheared liquid n-hexadecane. For completeness, here we briefly summarize the molecular potential models, simulation methods, and rheological properties in this present study. This section can be split neatly into three parts: the first describes the construction of molecular modeling and poten-tial models, including van der Waals 共vdW兲 and covalent bonding interactions; the second explains equations of mo-tion and their numerical methods used; and the third defines rheological properties, such as stress tensor and material functions, containing viscosity and normal stress coeffi-cients.
A. Potential models
At the coarse-grained level, a n-hexadecane molecular chain is simply modeled using spherical interaction sites, re-garded as methylene 共CH2兲 groups. Connected interaction sites will combine together to form molecular chains. This type of molecular chain model is known as the united atom 共UA兲. Thus, 1 n-hexadecane molecule is approximately con-sisted of 16 CH2 groups. The descriptions of chain motions
are governed by the vdW interaction and the covalent bond-ing interaction comprised of bond stretchbond-ing, bond bendbond-ing, and torsion motions.
In this present study, the modeling of these molecular motions above is based on the set of realistic potential mod-els of Chynoweth and Michopoulos9,49共CM兲, which only has one UA, CH2group. In passing, the transferable potential for phase equilibria 共TraPPE兲 model50 is an adaptation for cal-culating the vapor-liquid coexistence curve and the surface tension of n-alkane phase diagram. TraPPE model contained two UA groups: CH2 group and CH3 group. In a previous study,17 we have clearly examined both usual CM and TraPPE models for suitability of predicting equilibrium ther-modynamic and rheological properties, which are relative to the vapor-liquid coexistence curves and the zero-shear-rate viscosity0, respectively.
By using TraPPE model in rheological properties, Mc-Cabe et al.51 predicted the0value at different state points
for 9-octylheptadecane. As the pressure increases largely, the derivation of their predicted 0 values and experimental
values52 is increased obviously. Thus, they suggested that TraPPE model’s0value was underpredicted, while TraPPE model was parametrized for vapor-liquid equilibria. In addi-tion, Khare et al.10modified TraPPE model’s bond stretching motion by FENE potential; this improved model estimated that the 0 value of n-hexadecane was almost two times larger than the experimental value.53
When the CM model was adopted, Chynweth and Michopoulos9,49 concluded that CM model was suitable in the prediction of rheological properties. Furthermore, Jab-barzadeh et al.54–56 applied the CM model to analyze the rheological properties in heterogeneous shear flows. More-over, for n-hexadecane at a state point of 477.6 K and 0.896 g/cm3, its experimental
0 value 9,49,52
is 8.34 cP. At the same state point for n-hexadecane, our previous study17 indicted that CM model’s0value of 5.39 cP is close to the
experimental value and is better than TraPPE model’s 0
value of 3.55 cP.
In summary, when TraPPE model is used in equilibrium thermodynamics, its predicted density of vapor-liquid coex-istence curves is close to the related experimental values; correspondingly, when TraPPE model is used in rheological properties, the deviation of its0value with the experimental
value is large. On the other hand, CM model predicted that the 0 value is better, while its predicted density is rather
poor. More importantly, no matter which potential model is adopted, the qualitative tendency of simulated physical phe-nomenon would be similar. Therefore, using CM model in rheological properties is surely more reasonable as compared quantitatively to TraPPE model. Expectedly, we may propose
that using TraPPE model to predict the variation in rheologi-cal properties is in qualitative agreement with using CM model.
According to the basic viewpoint of quantum chemistry, it is hard to describe molecular orbits and intramolecular interactions共i.e., vdW force, polar bond, and hydrogen bond兲 by using a simple potential function. The well-known mate-rial science computational software—MATERIAL STUDIO— adopts a complex potential function, such as “condensed-phase optimized molecular potentials for atomistic simulation studies 共COMPASS兲” force field.57,58 The appli-cations of COMPASS model can perform many predictions, including structural, conformational, vibrational, and ther-mophysical properties for a broad range of molecules in iso-lation and in condensed phases and under a wide range of conditions of temperature and pressure. However, no litera-ture has related that this model is able to predict “rheological properties.” Therefore, in the MD simulation field, a certain molecular potential model should not be used simultaneously in the predictions of equilibrium thermodynamic and rheo-logical properties, but the confirmation only shows that the simulated physical phenomena are same, whether molecular potential model is used.
For a simple objective, we would relevantly choose CM model in the present study to predict qualitatively rheologi-cal properties—material functions under steady shear. In ad-dition, we would like to emphasize that the focus is not on whether one molecular potential model is better than the other to predict quantitatively the rheological properties. Substantially, the primary objective of this present study is to qualitatively present “similar macroscopic rheological ex-perimental results.” Thus, those results by NEMD simula-tions may be helpful for understanding the relasimula-tionship be-tween microscopic interactions and macroscopic rheological properties, especially for various materials in nanoscale.
The CM model is adopted in the steady state shear flow,17,54–56,59 oscillatory shear flow,36 and nanocontraction flow60 portions of MD simulations. For completeness, we introduce all potential functions for the CM model below and their parameters are listed in TableI.
1. van der Waals interaction
The vdW interaction occurs between CH2groups of
dif-ferent chains and also between CH2groups in the same chain
separated by more than three CH2groups. The vdW potential
can be described by the 12–6 Lennard-Jones共LJ兲 potential9 ULJ= 4LJ
冋
冉
LJ rij冊
12 −冉
LJ rij冊
6册
, 共1兲where rij is the distance between two CH2 groups, LJ and
LJare the energy and length parameters of the LJ potential,
respectively, for the pair of groups i and j.
The LJ potential can provide the short-range repulsion effect or excluded volume effect and long-range attraction effect. To reduce computational time of the vdW force, the shifted LJ potential61is usually truncated at a cutoff distance rc 共in this present study, rc= 9 Å兲 so that ULJ共rc兲=0. Thus, physical quantities are of course affected by the LJ potential
truncation. When the shifted LJ potential is used, long-range corrections must be added to both internal energy and pres-sure during the MD simulation procedure.
2. Covalent bonding interaction
The bond stretching potential62 Us connects two CH2
groups by Hooke’s harmonic potential with an equilibrium bond length l0of 1.53 Å,49
Us=
1
2kl共li− l0兲2, 共2兲
where klis the bond stretching energy constant and liis the bond length between groups i − 1 and i.
The bond bending potential62Ubis described by the Tay-lor series’ cubic term expansion of bending angle deviation with an equilibrium bond angle0of 109.47°,49
Ub=
1
2k关共i−0兲2− k
⬘
共i−0兲3兴, 共3兲where kis the bond bending energy constant, k
⬘
is the bond bending angle constant, and i is a bond angle among three adjacent CH2groups i − 1, i, and i + 1.The torsion potential63 Ut is expressed by a fifth-order cosine polynomial of a dihedral angle,
Ut= c0+ c1cosi+ c2cos2i+ c3cos3i+ c4cos4i
+ c5cos5i, 共4兲
where兵cn其 are the values of the set of torsion energy coeffi-cients andi is the dihedral angle formed by four consecu-tive CH2groups i − 1, i, i + 1, and i + 2. There are three stable
minima in Ut. The lowest energy state is the trans conforma-tion at i= 0° or i= 360°. The other two stable states are gauche conformations, g+and g−, located at
i=⫾120°, re-spectively. The cis state, ati= 180°, has very high and un-stable energy.64
B. Simulation algorithms
The NEMD algorithm1,3,48 was originally developed by combining SLLOD 共Ref. 65兲 equations of motion with the Lees–Edwards sliding brick periodic boundary condition.66
In this present study, we performed the NEMD simulations under isothermal conditions involving both constant volume NEMD 共NVT-NEMD兲 and constant-pressure67,68 NEMD 共NPT-NEMD兲 systems. The flow 共x-axis兲 and gradient 共y-axis兲 directional sizes 共Lx and Ly, respectively兲 of the simple shear flow system were 3.0 and 4.5 nm, respectively. A shear rate ␥˙ was applied to the fluid to characterize the shear flow field;␥˙ is related to the streaming velocity vxin the x direction, namely, ␥˙ =vx/y. The periodic boundary condition1,61 was adopted in all directions, while the Lees– Edwards boundary condition1,66 was used in the xy plane.
Significantly, for a system of rigid homonuclear diatomic molecules undergoing planar Couette flow, Travis et al.69,70 recently demonstrated that molecular stress tensor can con-tain a nonvanishing antisymmetric component due to unin-tentional body torques of molecular architecture occurring via an atomic thermostat.17 Thereby, their results presented that both thermostating schemes differ in their viscosity-shear-rate relationship, especially for high shear rate 共re-duced shear rate ⱖ2.5兲.25In contrast to low shear rates, the same results are produced essentially for both thermostating schemes.
In the present study, both NVT-NEMD and NPT-NEMD simulations choose the atomic version under constant shear rate, including the SLLOD equations of motion, temperature, and stress tensor to result in no strange effects on the pre-dicted rheological properties for ␥˙⬍1.1⫻1012 s−1 共below
2.5 in reduced units of shear rates兲.25
Most of NEMD simulations10,13,22,56,71at shear rates over 1⫻108 s−1are
ex-treme shear rate studies in contrast to the typical macro-scopic experiments of shear flow. For modern tribology in automobile engines, such as disk drives, micromachines, and camshaft lifters,71 however, an extreme shear rate in the thickness of lubrication film about 5 nm共quite ten molecu-larly lays兲56,72
and as high as 1⫻108 s−1 may be expected. Hence, some high shear rates should be accessibly imposed to analyze computationally rheological properties in ultrathin films of industrial lubrications.
In addition, the SLLOD equations of motion can be implemented by the leapfrog-Verlet scheme of MacGowan and Heyes73 which offers a fast converging iterative algo-rithm for Gaussian thermostat multiples.7The magnitude of time step depends on a shear rate from 1.0 to 0.1 fs due to ensuring numerical stability.17 Detailed information above regarding the molecular potentials, the SLLOD algorithms, and other related methods is available elsewhere.17
C. Rheological properties
Under the steady shear, the standard material functions of fluids contain viscosity and first and second normal stress coefficients. All of the functions depend on the atomic stress tensor and shear rate below. Note that the atomic stress ten-sor is characterized from the trajectories obtained in the NEMD simulation procedure.
1. Atomic stress tensor
In a homogenous system volume V, the atomic stress tensor is given by the Irving–Kirkwood’s equation1,74 TABLE I. The potential parameters of LJ and covalent bonding interactions.
Parameter Valuea Unit
Lennard-Jones LJ 4.045 Å
LJ 0.420 kJ mol−1
Bond stretching kl 2650.98 kJ mol−1Å−2
l0 1.53 Å
Bond bending k 0.1004 kJ mol−1deg−2
k⬘ 0.0096 deg−1 0 109.47 deg Torsion c0 9.278 kJ mol−1 c1 12.155 kJ mol−1 c2 ⫺13.119 kJ mol−1 c3 ⫺3.060 kJ mol−1 c4 26.239 kJ mol−1 c5 ⫺31.493 kJ mol−1 aLJ potential parameters共
LJandLJ兲 are taken from Ref.9; equilibrium
bond length and bond angle共l0and0兲 are taken from Ref.49; bond
stretch-ing and bond bendstretch-ing force constants共kl, k, and k⬘兲 are taken from Ref.62;
and torsion potential parameters are taken from Ref.63.
␣= − 1 V
冉
兺
i=1 N pi␣pi mi +兺
i=1 N兺
j⬎iN rij␣fij冊
, 共5兲 where ␣ is a component of the stress tensor, subscripts ␣,= x , y , z, piis the peculiar momentum of the ith atom, pxi and pyiare components of pi, miis the mass of the ith atom, rij denotes the distance vector from atom j to atom i, fij denotes the force imposed on atom i due to atom j, and N equals the total number of atoms. On the right side of Eq. 共5兲, the first sum describes the contribution of the kinetic energy, and the second sum describes the contribution of virial energy.1The force term fijconsists of both vdW inter-action and covalent bonding interinter-actions, which contain the bond stretching, bond bending, and torsion motions. The ex-pressions of these forces’ Virial energy were briefly de-scribed in the stress tensor study of Carpenter.752. Viscosity and normal stress coefficients
In the steady state shear flow field, the viscosity of fluids is defined by37–39
=yx
␥˙ , 共6兲
whereyxis the yx component of the stress tensor. The tra-ditional log versus log␥˙ curve is called the flow curve, including both features—the first-Newtonian plateau and the shear thinning slope. The first-Newtonian plateau regime in-dicates that as the shear rate approaches zero, all fluids ex-hibit Newtonian behavior, which allows the determination of the zero-shear-rate viscosity, 0, i.e., 0= lim␥˙→0共␥˙兲. At
high shear rates, the shear thinning regime is described to be linear relationship between log and log␥˙ by power-law model,⬀␥˙−k, where k is an exponent.
The first and second normal stress coefficients1and2
are obtained from37–39 1= N1 ␥˙2 = xx−yy ␥˙2 , 共7兲 2= N2 ␥˙2 = yy−zz ␥˙2 , 共8兲
where N1 and N2 are the first and second normal stress
dif-ferences, respectively. Experimentally, for polymeric fluids, 2is a negative value with a magnitude of about one-tenth
1, 2⬇− 1
101. As for the zero-shear-rate limit, 1,0
= lim␥˙→01共␥˙兲 and 2,0= lim␥˙→02共␥˙兲. On the logarithmic coordinate, 1 and −2 at high shear rates are plotted as a
linear function of shear rate, namely, 1⬀␥˙−␣ and −2
⬀␥˙−, where exponents ␣ and can quantify the slope of shear thinning.
III. RESULTS AND DISCUSSION
In a homogenous steady shear flow field, the rheological properties of liquid n-hexadecane including the dependence of viscosity 共兲 and first and second normal stress coeffi-cients共1and2兲 on shear rate 共␥˙兲 are analyzed in detail as
follows. First, Sec. III A clearly illustrates that the shear
thin-ning feature described by using power-law model37,39 not only presents in -␥˙ curves but also appears in both 1-␥˙ and −2-␥˙ relationships; then, these results are compared
with related NEMD simulations, experiments, and theories. Second, in Sec. III B one of the main objective of the present study is to further perform -␥˙ flow curves normalized to gain three master curves with respect to temperature, pres-sure, and density invariant, when based on our earlier results.17 Also, master curves are well formulated by using the Carreau–Yasuda rheological model.37,39 Lastly, in Sec. III C another goal of the present study is to observe how first and second normal stress differences and coefficients change in relation to the effects of temperature, pressure, and density; significantly, we discuss variations in the rate of shear thinning in detail. Accordingly, as compared qualita-tively, the degree of shear thinning in rheology is related to that of shear dilatancy in thermodynamics.
A. Validity of normal stress coefficients
Regarding non-Newtonian fluid, its-␥˙ flow curve con-sists of two regions, namely, the zero-shear-rate viscosity 共0兲 in first-Newtonian plateau region and the slope of shear
thinning in non-Newtonian region. In our earlier study,17we have offered valid evidences with respect to the -␥˙ flow curves in both constant volume NEMD 共NVT-NEMD兲 and constant pressure NEMD 共NPT-NEMD兲 simulations. These results are in agreement with the previous related studies including NEMD simulations, experiments, and theories.
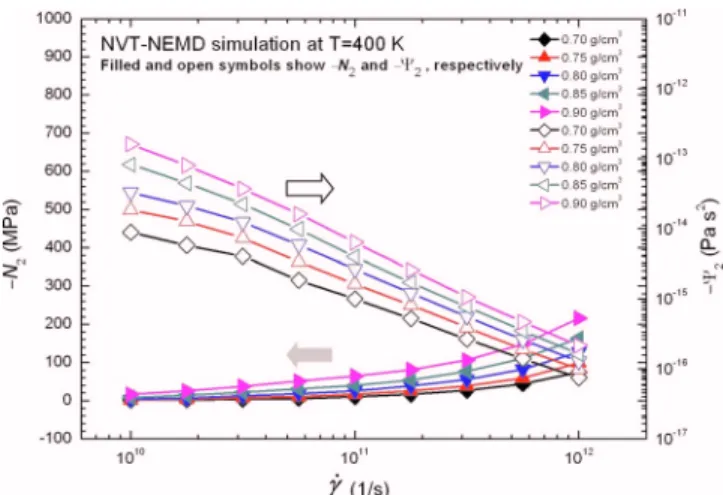
Here, the NVT-NEMD simulation system of the present study, which is a rectangular three-dimensional box with Lx = 3.0 nm, Ly= 4.5 nm, and Lz= 4.5 nm, contains 144 n-hexadecane molecules at a state point of 477.6 K and 0.896 g/cm3. The n-hexadecane fluid is surely of a liquid state at this state point since its melting and boiling points are at about 291.3 K共Ref.76兲 and 560 K,9respectively. The x and y directions of the system box correspond to flow and gradient directions, respectively. Significantly, we focus on the␥˙ dependence of1,2, and −1/2 on the following.
In rheological experiments, measuring the1and2 val-ues is not easily obtained. For polymeric liquid,1is a posi-tive value, and 2 is a negative value which is about one-tenth magnitude of 1. Notably, to represent on logarithmic coordinates together with1,2must add a minus sign, i.e., −2.37–39 As shown in Fig. 1 over a wide shear range of 1 ⫻109.5− 1⫻1012.5 s−1, both results are in accordance with
those characteristics above of 1 and −2 and are also in
close agreement with the results of Chynoweth et al.49In this present study, the shear rate is least limited at 1⫻109.5 s−1
due to the fact that lower shear rates generate the lower signal-to-noise ratio producing large statistical errors.10 Ob-viously, between 1⫻1010.0 and 1⫻1012.0 s−1 the
1-␥˙ and
−2-␥˙ curves are close to the linear line in the logarithmic
plot. This is one representation of shear thinning. In contrast to ␥˙⬍1⫻1010.0 s−1, both curves start deviating from the
slope of shear thinning.
Additionally, both curves are fit via the power-law model, namely, 1⬀␥˙−␣ and −2⬀␥˙−, where ␣= 1.42 and
= 1.38 in Fig. 1. Early NEMD study of Edberg et al.6
garding n-butane共C4H10兲 and n-decane 共C10H22兲 fluids have
shown 1⬀␥˙−1.5 and −2⬀␥˙−1.5. Khare et al.10 suggested
1⬀␥˙−共1.30–1.45兲for a wide various n-alkane molecules.
Inci-dentally, in the molecular theory with regard to entangled polymer dynamics, the Doi–Edwards model predicted 1 ⬀␥˙−2.0 and −
2⬀␥˙−2.5 as ␥˙→⬁.22,23,46 For long molecular
chains consisting of 100–400 beads, NEMD results of Aoyagi and Doi20revealed1⬀␥˙−1.5and −2⬀␥˙−1.8, which
are in close agreement with the theory46 of polymer dynam-ics.
In the ensuing discussion of shear thinning, as for our earlier study,17 the-␥˙ curves on the logarithmic coordinate between 1⫻1010.0 and 1⫻1012.0 s−1 is also a linear
ten-dency. The slope of shear thinning can be also depicted by the power-law model, namely, ⬀␥˙−k, where k is an
expo-nent. This exponent k is 0.47, which falls reasonably within the range of 0.4–0.9 often reported for the treatise37of poly-meric liquid. In NEMD results of Khare et al.,10 for varied n-alkane molecules, the k value is about 0.37–0.43. Espe-cially in regard to the theory of entangled polymer dynamics, the Doi–Edwards model predicted ⬀␥˙−1.5 as ␥˙→⬁.22,23,46
Although molecule lengths and state points are somewhat different, our predicted power-law model’s exponents includ-ing k共0.47兲,␣共1.42兲, and共1.38兲 for⬀␥˙−k,
1⬀␥˙−␣, and
−2⬀␥˙− are reasonable values in comparison with the re-lated studies mentioned above, respectively.
Eventually, the −1/2 ratio in general is unchanged
with shear rate and is about 0.1–0.3 according to the related polymer rheological treatises.37–39 In the theory of polymer dynamics, for a high shear rate of ␥˙⬇4.3⫻1011.0 s−1, the
Doi–Edwards model had derived −1/2= 2/7⬇0.3.46In the
present study, Fig.2shows that −1/2 versus␥˙ is made a
constant function via least-squares fitting,7which is indicted by the horizontal dashed line; then, our −1/2ratio of
least-squares fitting for liquid n-hexadecane is about 0.45 and is larger than that of polymeric liquid of 0.3. As compared with the result of Chynoweth et al.,49we present that the change in −1/2 with␥˙ does not evidently result in the fluctuant
tendency at lower shear rates due to our numerical
conver-gence requiring long computational time. Especially for short-chain PE consisting of 100 repeat units, Moore et al.22 concluded that the −1/2 ratio approaches a value of 0.19.
As the −1/2 ratio of Khare et al.10 is about 0.4–0.5 for
various liquid n-alkanes, our predicted −1/2⬇0.45 for
n-hexadecane is a rather acceptable value.
In summary, n-hexadecane molecules related to polymer chain are quite short and should be properly considered as the Newtonian fluid in macroscopic perspective. As corrobo-rated above, liquid n-hexadecane at the molecular level ob-viously represents rheological characteristics of polymeric fluids, namely, shear thinning behavior.
B. Master curves of viscosity-shear-rate relationship
With various thermodynamics states 共temperature-pressure-density data兲, the changes in viscosity are notice-ably sensitive.37,39 In our earlier study,17 using Doolittle’s free volume concept42 cooperated with our data of nonther-modynamic state, we have attempted to explain qualitatively the variations in viscosity with respect to the temperature, pressure, and density. While based on our earlier study,17 here, it is significant that all -␥˙ curves are normalized to obtain separately temperature-, pressure- and density-invariant master curves via both characteristic values—zero-shear-rate viscosity and critical shear rate.41Also, these mas-ter curves can be well formulated by the Carreau–Yasuda rheological constitutive equation.37,39
1. Temperature-invariant master curve
As a beginning, we use NPT-NEMD simulations at a constant pressure of 250 MPa for liquid n-hexadecane and the variations in-␥˙ flow curves occur at five different tem-peratures of 300, 350, 400, 450, and 500 K. Substantially, the melting point and boiling point of n-hexadecane are 291.3 K 共Ref. 76兲 and 558 K,9 respectively. The fluid between 300 and 500 K is surely of a liquid state. This result has been represented in our earlier study.17 Doolittle’s free volume concept42 is often useful in explaining the variations in vis-FIG. 1. 共Color online兲 Shear-rate␥˙ dependence on the first normal stress
coefficient1and the minus second stress coefficient −2for n-hexadecane
at 477.6 K and 0.896 g/cm3as obtained from NVT-NEMD simulation.
FIG. 2. 共Color online兲 Shear-rate␥˙ dependence on the minus ratio of the
second to first normal stress coefficient −2/1for n-hexadecane at 477.6 K
and 0.896 g/cm3as obtained from NVT-NEMD simulation.
cosity with thermodynamic state: as the free volume of the fluid’s molecules increases, its viscosity falls. As for our ear-lier result,17 it is evident that density decreases with rising temperature so that the free volume is also enhanced. From a molecular aspect, a decrease in the viscosity is the presenta-tion of the increasing mobility or decreasing resistance to molecular motion; thus, the viscosity decreases with increas-ing free volume.17
With respect to gaining the extrapolative zero-shear-rate viscosity 0 values, first, we use the Carreau–Yasuda
equa-tion here37,39 to fit-␥˙ data of our earlier study,17 =⬁+ 0−⬁
关1 + 共␥˙兲a兴共n−1兲/a. 共9兲 The Carreau–Yasuda equation has five parameters:0is
the very low shear-rate viscosity, i.e., zero-shear-rate viscos-ity;⬁ is the very high shear-rate viscosity; is the dimen-sion of time; a and n are the exponents; a affects the curva-ture of the transition region between the first-Newtonian plateau and shear thinning slope; and n controls the slope of the shear thinning region.39 In general, ⬁= 0 and a = 2 are set to reduce the Carreau–Yasuda model for liquid polymeric fluids.37 Notably, as shown in our previous study,17the very high shear-rate viscosity is constrained to zero, i.e., ⬁= 0, due to no second-Newtonian viscosity appearing in the shear thinning region between 1⫻1010.0 and 1⫻1012.0 s−1.
Next, the rotational relaxation time R is calculated by the modified Rouse model7,17,41with the known extrapolative 0value above, R= 60M 2 eRT , 共10兲
where M is the molecular weight ande is the equilibrium density. In addition, a critical shear rate␥cindicates an on-set point of shear thinning. Berker et al.7 found that ␥c ⬇R−1, which is in close agreement with the observed NEMD simulation data. Lastly,0,e,R, and␥˙cvalues at different temperatures are arranged in TableII. As a result,0andR values decrease with rising temperature. Subsequently, the slope of shear thinning can be described by the power-law model, ⬀␥˙−k, where k is the power-law model’s exponent
and implicitly indicates “the rate or degree of shear thin-ning.” The temperature dependence of the k value is also listed in Table II; thus, the rate of shear thinning falls with
rising temperature. These results are also consistent with the general physical understanding of polymers. The power-law model’s exponent k of⬀␥˙−kwill be discussed together with
that of1⬀␥˙−␣and −2⬀␥˙− in Sec. III B 2.
To obtain a temperature-invariant master curve,-␥˙ flow curves at different temperature are always normalized via both characteristic values of 0 and ␥˙c according to the treatises37,41 of polymer viscoelasticity and rheology. In re-lated NEMD simulations, Moore et al.12 and Kairn et al.35 also adopted 0 and ␥˙c values to normalize -␥˙ curves at different state points. In addition, the normalized-␥˙ curves of MaCabe et al.14are performed by choosing a scale factor Z in the/Z versus␥˙ Z diagram, where Z =/refandrefis
the reference viscosity. In particular, employing the time-temperature superposition,42an important finding of Bair et al.13is presented in which the NEMD and experimental data follow the same master curve, together.
Therefore, at five different temperatures of 300–500 K, we also attempted to normalize -␥˙ curves to result in a temperature-invariant master curve by adopting 0 and R values, which are listed in Table II. As a result, and ␥˙ values are reduced to /0 and ␥˙/␥˙c, respectively. As ex-pected in Fig. 3, almost all/0-␥˙/␥˙cpoints exhibit a very narrow bandwidth; further, the normalized Carreau–Yasuda TABLE II. The temperature dependence of various rheological properties at 250 MPa in NPT-NEMD
simula-tion. T 300 K 350 K 400 K 450 K 500 K 0共mPa s兲 8.253 4.215 2.637 1.905 1.363 e共g/cm3兲a 0.836 0.818 0.801 0.785 0.770 R共ps兲 543.7 243.2 136.0 89.1 58.5 ␥˙c共s−1兲 1.8⫻109 4.1⫻109 7.4⫻109 1.1⫻1010 1.7⫻1010 ka 0.585 0.541 0.499 0.457 0.412 ␣ 1.609 1.546 1.489 1.420 1.368  1.578 1.503 1.452 1.386 1.331
aTaken from Ref.17.
FIG. 3. 共Color online兲 Temperature-invariant master curve of the reduced viscosity/0vs reduced shear rate␥˙/␥˙cfor n-hexadecane at 250 MPa between 300 and 500 K as obtained from NPT-NEMD simulation. The solid line is the Carreau–Yasuda model curve fit to the data.
model to well fit these reduced points is used, ⴱ= ⬁ ⴱ+ 0ⴱ−⬁ⴱ 关1 + 共ⴱ␥˙ⴱ兲a兴共n−1兲/a, 共11兲 where ⴱ=/0, 0ⴱ=0/0, ⬁ⴱ=⬁/0, ⴱ=␥˙c, and ␥˙ⴱ =␥˙/␥˙c. Successfully, we can formulate the reduced /0
−␥˙/␥˙cdata to obtain the temperature-invariant master curve of the normalized Carreau–Yasuda model with its param-eters, i.e.,0ⴱ= 1,⬁ⴱ= 0,ⴱ= 0.142, a = 0.53, and n = 0.10, as seen in Fig.3.
2. Pressure-invariant master curve
Over a wide pressure region between 50 and 1000 MPa, using NPT-NEMD simulations, the variations in the -␥˙ curves are discussed for liquid n-hexadecane at a constant temperature of 400 K. Our previous study17has represented this illustration, which indicated evidently that viscosity in-creases with pressure. As a result, only at four different pres-sures of 50, 100, 250, and 500 MPa, the curves opposes a Newtonian plateau following shear thinning region; other curves only has a shear thinning characteristic. Explained by Doolittle’s free volume concept, the effect of increased dsity and decreased free volume signify that viscodsity is en-hanced with pressure; thus, this result is in agreement with general rheological understanding.
Referring to Sec. III B 1,-␥˙ flow curves at four differ-ent pressures共50–500 MPa兲 in our earlier study17are fit via the Carreau–Yasuda model of Eq.共9兲to extrapolate0value; further, using the modified Rouse model of Eq. 共10兲and0 value,Rcan be determined while␥˙capproachesR
−1, where
the modified Rouse model needs theevalue. Thereby, the 0,e,R, and␥˙c values are arranged together in Table III. As expected, 0 and R values increase with pressure; this tendency is consistent with the general physical understand-ing of polymers. Moreover, the slopes of shear thinnunderstand-ing be-tween 1⫻1010.0and 1⫻1012.0 s−1at different pressures can
be easily described by the power-law model,⬀␥˙−k, where k
is an exponent and implies the rate of shear thinning. Furthermore, the pressure against the exponent is listed in TableIII; then, with rising pressure, the rate of shear thinning enhanced is in accordance with common rheological percep-tion.
Eventually, -␥˙ curves possess zero-shear-rate viscosi-ties only at four different pressures of 50, 100, 250, and 500 MPa. As in Sec. III B 1, we can also normalize these
flow curves to gain one pressure-invariant master curve by adopting 0 and ␥˙c values which the data are obtained in TableIII; then, the normalized plot of /0against ␥˙/␥˙cis depicted in Fig. 4. Expectedly, all /0-␥˙/␥˙c points also present a very narrow bandwidth; those points can be fitted using the normalized Carreau–Yasuda model of Eq. 共11兲 again, where a controlling curvature at the transition point is held constant at 0.53共a=0.53兲 and is the same with tempera-ture effect. Thus, the pressure-invariant master curve is well described by the normalized Carreau–Yasuda model with its parameters: 0ⴱ= 1, ⬁ⴱ= 0, ⴱ= 0.217, a = 0.53, and n = 0.20, as seen in Fig. 4.
3. Density-invariant master curve
In a liquid-vapor coexistence curve of n-hexadecane molecules, the observation of phase diagram at 400 K shows the liquid state at density of over 0.65 g/cm3; in contrast to below 0.65 g/cm3, the fluid exhibits the coexistence of liq-uid and vapor states. This result is referred to in our previous study.17To ensure that our simulated fluid is well within the one liquid phase region, therefore, in the present study for NEMD simulation at a constant temperature of 400 K, five different densities of n-hexadecane fluid can be surely set at 0.70, 0.75, 0.80, 0.85, and 0.90 g/cm3.
TABLE III. The pressure dependence of various rheological properties at 400 K in NPT-NEMD simulation.
P
50 MPa 100 MPa 250 MPa 500 MPa 750 MPa 1000 MPa
0共mPa s兲 1.102 1.424 2.637 7.835 ¯ ¯ e共g/cm3兲a 0.699 0.737 0.801 0.866 ¯ ¯ R共ps兲 65.1 79.8 136.0 373.9 ¯ ¯ ␥˙c共s−1兲 1.5⫻1010 1.3⫻1010 7.4⫻109 2.7⫻109 ¯ ¯ ka 0.449 0.459 0.499 0.542 0.578 0.612 ␣ 1.415 1.433 1.489 1.558 1.611 1.671  1.369 1.391 1.452 1.524 1.559 1.601
aTaken from Ref.17.
FIG. 4. 共Color online兲 Pressure-invariant master curve of the reduced vis-cosity/0vs reduced shear rate␥˙/␥˙cfor n-hexadecane at 400 K between 50 and 500 MPa as obtained from NPT-NEMD simulation. The solid line is the Carreau–Yasuda model curve fit to the data.
At five different densities above, we observe the varia-tion in the-␥˙ flow curves by using NVT-NEMD simulation of liquid n-hexadecane at a constant temperature of 400 K. This representation of -␥˙ curves has been shown in our earlier study.17 Notably, between 0.70 and 0.75 g/cm3, the
-␥˙ flow curves are from the first-Newtonian plateau follow-ing the slope of shear thinnfollow-ing. With density increasfollow-ing slightly, the Newtonian regime’s scope decreased rapidly. As the density approached 0.80 g/cm3, the Newtonian regime’s
scope almost vanished. At higher densities of 0.85 and 0.90 g/cm3, no sign of the Newtonian plateau exhibits in the -␥˙ flow curves. In addition, there is an incremental increase in viscosity at increased density. According to Doolittle’s free volume concept, the increase in density results in a de-crease in the free volume of molecules.17
The Carreau–Yasuda model also can be used to fit the overall-␥˙ flow curves at 0.70 and 0.75 g/cm3in our
ear-lier study.17The same as the discussions in Secs. III B 1 and III B 2, at different densities, all related rheological proper-ties including the0,R, and␥˙cvalues are listed in TableIV. As a result, 0 and R values increase with density that is qualitatively consistent with the physical perspective of poly-mers. In addition, the slopes of shear thinning between 1 ⫻1010.0 and 1⫻1012.0 s−1 at all different densities can be
obtained by power-law model fitting to-␥˙ data, where the power-law model’s exponent with respect to the density also is arranged in TableIV.
As the density increased, the rate of shear thinning en-hances. This tendency is the same with the effect of pressure. Notably, the variation ranges of the exponent in Tables III and IV are 0.449–0.612 at a pressure interval of 50–1000 MPa and 0.278–0.505 at a density interval of 0.70– 0.90 g/cm3, respectively. Comparably, the rate of
shear thinning enhanced with slightly increasing density is more sensitive than that with the incremental increase in pressure. Noteworthily, with varying temperatures, pressures, and densities, we perceive that variations in the degree of shear thinning in rheology is qualitatively contrary to that of shear dilatancy in thermodynamics, according to those expo-nents mentioned above and the data of shear dilatancy of our earlier study.17
In a constant shear-rate region of 1⫻109.0− 1
⫻1012.0 s−1, -␥˙ flow curve only at 0.70 and 0.75 g/cm3
has the0value, while both curves can be normalized by the
0 and ␥˙c values, again. Expectedly, in Fig. 5 almost all reduced points共/0 and ␥˙/␥˙c兲 show a very narrow
band-width which is formulated by the normalized Carreau– Yasuda model, where a is also held constant at 0.53 共a = 0.53兲 and is the same with the effects of temperature and pressure. Consequently, Carreau–Yasuda model parameters are0ⴱ= 1,⬁ⴱ= 0,ⴱ= 1.151, a = 0.53, and n = 0.58. As shown in Fig.5, the/0-␥˙/␥˙cdata own the density-invariant mas-ter curve.
In particular, what needs to be remarked regarding the variation sensitivity of the-␥˙ flow curves which are influ-enced by the effects of temperature, pressure, and density, is an order of these effects. In our earlier study,17the change in shape of -␥˙ flow curves are simply observed at different temperatures, pressures, and densities, respectively. As a re-sult, we cautiously inspect in a qualitative comparison con-cerning the order of sensitizer: the strongest is density effect, the second is pressure effect, and the weakest is temperature effect.
Finally, for temperature-, pressure-, and density-invariant master curves, we have tabulated all of the param-eters of the Carreau–Yasuda model in TableV, where0ⴱ,⬁ⴱ, and a are held constant to be 1.0, 0.0, and 0.53, respectively. Furthermore,ⴱand n parameters, which imply the molecu-lar chain’s relaxation time and the slope of shear thinning, respectively, are quantitatively compared. Accordingly, the order of the sensitivity, which describes the degree of the variation in-␥˙ flow curves with temperature, pressure, and TABLE IV. The density dependence of various rheological properties at 400 K in NVT-NEMD simulation.
0.70 g/cm3 0.75 g/cm3 0.80 g/cm3 0.85 g/cm3 0.90 g/cm3 0共mPa s兲 0.814 1.278 ¯ ¯ ¯ R共ps兲 48.0 70.4 ¯ ¯ ¯ ␥˙c共s−1兲 2.1⫻1010 1.4⫻1010 ¯ ¯ ¯ ka 0.278 0.332 0.392 0.449 0.505 ␣ 1.179 1.295 1.388 1.486 1.580  1.128 1.229 1.315 1.385 1.473
aTaken from Ref.17.
FIG. 5. 共Color online兲 Density-invariant master curve of the reduced vis-cosity/0vs reduced shear rate␥˙/␥˙cfor n-hexadecane at 400 K between 0.70 and 0.75 g/cm3as obtained from NVT-NEMD simulation. The solid
line is the Carreau–Yasuda model curve fit to the data.
density by the magnitude of ⴱ and n parameters, is con-cluded: density effect⬎pressure effect⬎temperature effect. Whether dealing with “qualitative observation of flow curves” or “quantitative comparison of fitting parameters mentioned above,” such results lead us to assure that the sequence of substantially affecting variations in -␥˙ flow curves is expressly addressed as follows: density, pressure, and temperature effects.
C. Normal stress differences and coefficients for shear shinning
Shear thinning not only presents in the viscosity-shear-rate 共-␥˙兲 relationship but also its characteristic behavior results in variations in first and second normal stress coeffi-cients共1and2兲 along shear rates. Early NEMD studies of Barker et al.,7 Davis et al.,67 and Chynoweth et al.49 have been performed to compute1and2values for alkane mol-ecules. Recently, for short-chain PE, Moore et al.22examined the NEMD results of1and2compared with the reptation dynamic theory of the Doi–Edwards model,46 which pre-dicted1⬀␥˙−2and −
2⬀␥˙−2.5for the entangled polymer
dy-namics, as␥˙→⬁. The variations in the1-␥˙ and −2-␥˙ data with molecular length have been mostly reported,20,21,26,34,43,44,47 while Jabbarzadeh et al.25 and Bosko et al.26discussed in detail that the degree of branching of molecules influences the 1-␥˙ and −2-␥˙ curves. In
par-ticular, Bosko et al.34further revealed the polymer blending and polymeric solutions dependence on the1and2value.
In spite of the large number of literatures, those studies men-tioned above are limited to the investigations of molecular
structure dependence on normal stress coefficients. It is gretful that little information has been made available re-garding which thermodynamic state is directly relative to normal stress coefficients.
The major aim here is to analyze the variations in the dependence of normal stress differences and coefficients on shear rate, including N1-␥˙ , −N2-␥˙ ,1-␥˙ , and −2-␥˙ , as well as the minus ratio of normal stress coefficients, −2/1-␥˙ ;
the discussions of these properties at different temperatures, pressures, and densities are addressed analytically. Signifi-cantly, the slope of shear thinning of1-␥˙ and −2-␥˙ curves
obeys the power-law model to observe how the rate of shear thinning changes. In addition, a CT point, which undergoes in the dramatic variations in −2/1-␥˙ curves, is found
obviously.
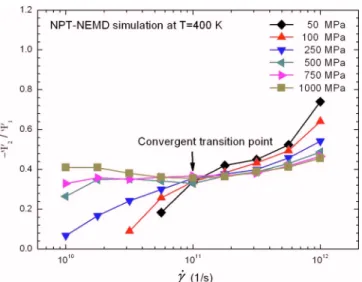
1. Variations with temperature
The N1 and 1 versus ␥˙ for different temperatures of
300–500 K are shown in Fig.6, where NPT-NEMD simula-tions were performed at a constant pressure of 250 MPa. Note that solid symbols indicate N1 related to the left axis,
while open symbols indicate1related to the right axis. On
the one hand, at ␥˙⬍1⫻1011.5 s−1, the
1 value decreases
with increasing shear rate and with increasing temperature. Surprisingly, at␥˙⬎1⫻1011.5 s−1, the
1-␥˙ curves at
differ-ent temperatures closely match each other. This result should be concluded virtually the␥˙ independence of1.
Overall, regarding the changes in −2 and −N2 values with shear rate and temperature, Fig.7 is similar to the fea-tures mentioned above of1-␥˙ curves in Fig.6. Expectedly,
FIG. 6.共Color online兲 Shear-rate␥˙ dependence of the first stress difference N1共left axis兲 and coefficient1共right axis兲 for n-hexadecane at 250 MPa
and varying temperatures between 300 and 500 K as obtained from
NPT-NEMD simulation. Filled and open symbols above show N1and1,
respectively.
TABLE V. The five parameters of the Carreau–Yasuda rheological constitutive equation fitting to the reduced
-␥˙ data for the temperature-, pressure-, and density-invariant master curves.
Parameter 0ⴱ ⬁ⴱ ⴱ a n
Temperature invariant 1.0 0.0 0.142 0.53 0.10
Pressure invariant 1.0 0.0 0.217 0.53 0.20
Density invariant 1.0 0.0 1.151 0.53 0.58
FIG. 7. 共Color online兲 Shear-rate␥˙ dependence of the minus second stress
difference −N2共left axis兲 and coefficient −2共right axis兲 for n-hexadecane
at 250 MPa and varying temperatures between 300 and 500 K as obtained from NPT-NEMD simulation. Note that filled and open symbols above show −N2and −2, respectively.
−2-␥˙ curves at ␥˙⬎1⫻1011.5 s−1 also closely match each
other, while the −2-␥˙ curves start separating at ␥˙⬍1
⫻1011.5 s−1. In addition, the −
2 values also decrease with
increasing shear rates and with increasing temperatures. Un-expectedly, within a narrow shear-rate range of about 1 ⫻1010.0− 1⫻1011.0s−1, an analogous first-Newtonian plateau
of −2-␥˙ curves is inspected for 350–500 K; this feature
usually appears in rheological experiments.37The NEMD re-sults of Kröger et al.43 and Daivis77 discussed the first-Newtonian plateau of1-␥˙ and −2-␥˙ curves under the
zero-shear-rate limit, namely,1,0and −2,0, respectively.
On the other hand, N1 and −N2 values increase with
shear rate, while they decrease correspondingly with rising temperatures; additionally, at low shear rates, both values gradually tend toward near zero. Because thermodynamic fluctuation at low shear rates results in large statistical uncer-tainty, N2 values in the present study are small positive and decay to close zero so that −2values are negative, not to be shown in Fig.7, which is due to on the logarithmic coordi-nates. Consequently, overall N1 and N2 values decrease to approximate zero with decreasing shear rates. This tendency is apparently observed in the NEMD studies of Xu et al.44 and Jabbarzadeh et al.25In the other words, as both N1 and
N2 values are almost equal to zero, the fluid approaches the
Newtonian fluidic behavior.38
As shown in Figs.6 and7, the1-␥˙ and −2-␥˙ curves
are nearly a linear function on the logarithmic coordinate and therefore are simply described by the power-law models, 1⬀␥˙−␣ and −2⬀␥˙−, where ␣ and  are the power-law
model’s exponent of 1 and −2 variables, respectively;
then, these exponents at different temperatures can be ob-tained in TableII. In NEMD studies of n-butane共C4H10兲 and
n-decane共C10H22兲 fluids, Edberg et al.6revealed that1and
−2 values are proportional to ␥˙−1.5. Thereby, our predicted
exponent values␣andare roughly reasonable as inspected in TableII.
Proceeding to Fig.8, a CT point, which indicates that all curves converge together at a transition location of ␥˙⬇1
⫻1011.0 s−1, is evidently found. After the CT point of ␥˙
⬎1⫻1011.0 s−1, −
2/1-␥˙ curves matching each other is
similar to 1-␥˙ and −2-␥˙ curves in Figs. 6 and7,
respec-tively. In addition to our earlier study,17for high shear rates of ␥˙⬎1⫻1011.5 s−1, -␥˙ curves at different temperature
nearly match each other. In summary, we suggest that at high shear rates rheological properties including ,1, −2, and
−2/1 virtually do not depend on temperature. In passing,
NEMD studies of Guo et al.45 also presented such a result mentioned above for the-␥˙ curves of perfluoropolyether at high shear rates.
In contrast, before the CT point of␥˙⬍1⫻1011.0 s−1, we
notice that only at the lower temperature of 300 K the −2/1 ratio does remain approximately constant; and at
other temperatures, the −2/1 ratio falls as temperature
rises. As a whole, the −2/1 ratio increases with shear rate
that is in accordance with the previous NEMD study of Daivis et al.,8 who presented the comparative rheological properties of branched and linear alkanes. Nevertheless, the existence of this CT point should be attributed to the non-equilibrium state density being close to the non-equilibrium state density. The location of CT point is unexpectedly inspected at␥˙⬇1⫻1011.0 s−1and is also near to the location of
tran-sient point for the shear dilatancy behavior, which happens at about 1⫻1011.0 s−1as referring to our earlier study.17
To describe the rate of shear thinning, we have arranged three exponents k,␣, andin TableIIfor⬀␥˙−k,
1⬀␥˙−␣,
and −2⬀␥˙−, respectively. As a result, the viscosity’s k
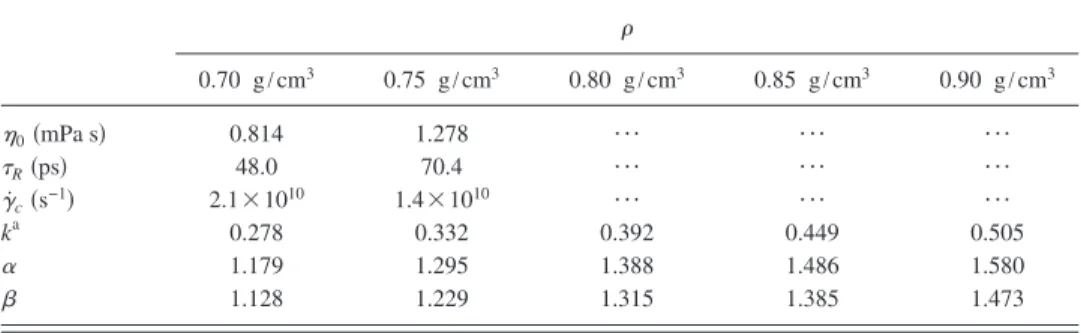
value is rather smaller than the normal stress coefficients’␣ andvalues. In Fig.9, the exponents depending on tempera-ture are shown together in both left and right axes, which are related to viscosity and normal stress coefficients, respec-tively. Significantly, the rate of shear thinning linearly de-clines with increasing temperature.
Lastly, the related NEMD researches regarding power-law model’s exponent are mentioned briefly below. In a het-erogeneous shear flow field of n-hexadecane molecules un-FIG. 8. 共Color online兲 Shear-rate␥˙ dependence of the minus ratio of the
second to first normal stress coefficient −2/1 for n-hexadecane at 250
MPa and varying temperatures between 300 and 500 K as obtained from
NPT-NEMD simulation.
FIG. 9.共Color online兲 Temperature T dependence of exponents k,␣, and in shear thinning behavior of the viscosity共left axis兲, first stress coeffi-cient1, and minus second stress coefficient −2共right axis兲 given by
⬀␥˙−k,
1⬀␥˙−␣, and −2⬀␥˙−for n-hexadecane at 250 MPa as obtained
from NPT-NEMD simulation in the high shear-rate range, respectively. The drawn lines are fit to the data. The square, circle, and diamond symbols above show results for,1, and −2, respectively.
der constant temperature and density conditions, Jabbarzadeh et al.54 offered that as film thickness increased, the k value decreased for⬀␥˙−k. For linear molecular chains, the
find-ings of Kröger et al.43 and Bosko et al.26 resulted in which the ␣ and values increase with molecular lengths for 1
⬀␥˙−␣ and −2⬀␥˙−, respectively. In addition, for
dendrim-ers, Bosko et al.34further reported that the change in␣and values with increasing the degree of branching of molecules is not obvious.
2. Variations with pressure
Over a broad pressure of 50–1000 MPa, the changes in 1and −2with␥˙ are illustrated in Figs.10and11,
respec-tively, as NPT-NEMD simulations have been performed at a constant temperature of 400 K. With increasing shear rates, the variations in 1 and −2 values in Figs. 10 and 11 are almost similar to those in Figs.6and7. As the shear thinning characteristic is also observed in Figs. 10and 11, the 1-␥˙ and −2-␥˙ relationships are easily fitted by the power-law
model; their exponents,␣ and, are listed in TableIII. Ad-ditionally, as the pressure increases, it is evident that the 1
and −2 values increase correspondingly while both
expo-nents␣andalso increase.
Only at lower pressures of below 250 MPa, the −2-␥˙
curves in Fig. 11 possess a similar first-Newtonian plateau characteristic. Returning to Fig.7, at higher temperatures of 350–500 K, this first-Newtonian plateau of −2-␥˙ curves is
also found. Figures10and11show that at lower pressures of 50–250 MPa, both N1and −N2values rapidly converge near
to zero with decreasing shear rate; at higher pressures of over 250 MPa, it is clear that both values gradually decay to zero. Therefore, this result indicates that the fluidic behavior ap-proximates Newtonian fluid especially at low shear rates.
The change in −2/1-␥˙ curves with pressure is shown
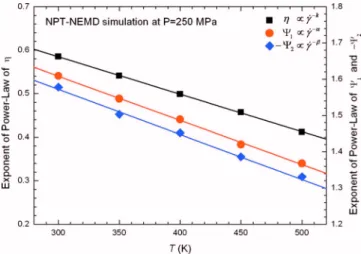
in Fig. 12, while the CT point is observed at ␥˙⬇1 ⫻1011.0 s−1again. Notice that the CT point of the −
2/1-␥˙
curves obtained at different pressures in Fig.12is similar to that at different temperatures in Fig. 8. Overall, the −2/1 ratio increases with shear rate. Especially for the higher pres-sure approaching to over 250 MPa, after the CT point of ␥˙ ⬎1⫻1011.0 s−1, the −
2/1 ratio does not vary with
in-creasing␥˙ and all −2/1-␥˙ curves almost match each other. In contrast to before the CT point of ␥˙⬍1⫻1011.0 s−1, at
higher pressures, the change in the −2/1ratio is not
obvi-ous. In addition, at over and below shear rates of the CT point, the variations in the −2/1 ratio with pressure are
fortuitously inverse.
Referring to Sec. III C 1, all exponents are listed in Table III for ⬀␥˙−k,
1⬀␥˙−␣, and −2⬀␥˙−. As a result,
these exponents increase with pressure, where ␣ and⬎k. In Fig. 13, three intersections are inspected respectively by two straight lines fitting to the data and their common loca-tion is found at about 320 MPa. In our earlier study,17 nota-bly, this intersections has been once shown in the-P curve under constant temperature and shear-rate conditions of 400 K and 1⫻1012.0 s−1. Thus, a wide pressure region should result in the existence of the intersections regarding the FIG. 10.共Color online兲 Shear-rate␥˙ dependence of the first stress difference
N1共left axis兲 and coefficient1共right axis兲 for n-hexadecane at 400 K and
varying pressures between 50 and 1000 MPa as obtained from NPT-NEMD simulation. Note that filled and open symbols above show N1 and 1,
respectively.
FIG. 11.共Color online兲 Shear-rate␥˙ dependence of the minus second stress
difference −N2共left axis兲 and coefficient −2共right axis兲 for n-hexadecane
at 400 K and varying pressures between 50 and 1000 MPa as obtained from NPT-NEMD simulation. Filled and open symbols above show −N2and −2,
respectively.
FIG. 12. 共Color online兲 Shear-rate␥˙ dependence of the minus ratio of the
second to first normal stress coefficient −2/1for n-hexadecane at 400 K
and varying pressures between 50 and 1000 MPa as obtained from
NPT-NEMD simulation.