行政院國家科學委員會補助專題研究計畫成果報告
行政院國家科學委員會補助專題研究計畫成果報告
行政院國家科學委員會補助專題研究計畫成果報告
行政院國家科學委員會補助專題研究計畫成果報告
※※※※※※※※※※※※※※※※※※※※※※※※※
※ ※
※
半導體集結式機台整合檢測與控制
(3/3)
※
※
Integrated Inspection and Control for Semiconductor Cluster Tools
※
※
※
※※※※※※※※※※※※※※※※※※※※※※※※※
計畫類別:整合型計畫
計畫編號:NSC-89-2218-E-002-055
執行期間:89 年 8 月 1 日至 90 年 7 月 31 日
計畫主持人:郭瑞祥
共同主持人:陳正剛
本成果報告包括以下應繳交之附件:
□赴國外出差或研習心得報告一份
□赴大陸地區出差或研習心得報告一份
□出席國際學術會議心得報告及發表之論文各一份
□國際合作研究計畫國外研究報告書一份
執行單位:台灣大學工商管理學系
中 華 民 國 90 年 8 月 1 日
行政院國家科學委員
行政院國家科學委員
行政院國家科學委員
行政院國家科學委員會專題研究計畫成果報告
會專題研究計畫成果報告
會專題研究計畫成果報告
會專題研究計畫成果報告
半導體集結式機台整合檢測與控制
Integrated Inspection and Control for Semiconductor Cluster Tools
計畫編號:NSC 89-2218-E-002-055
執行期限:89/8/1 ~ 90/7/31
主持人:郭瑞祥
台灣大學工商管理學系
共同主持人:陳正剛
台灣大學工業工程研究所
摘要
本計劃發展整合檢測與控制技術,其中包
含了離線製程最佳化技術與線上製程控制技
術。藉由整合機台、製程、材料與晶圓的資料
收集,決策分析與執行,以改善機台與製程的
表現。
在第一年中,我們發展了合理分群技術以
建立了快速熱氧化製程之非均勻度統計模型。
在第二年中,我們發展了自我調適督導控制技
術。
第三年重點為製程整合檢測與控制,具體
的工作項目包含了:
1. 發展整合檢測與控制技術
2. 建立整合檢測系統雛型
3. 進行資料分析
目前第三年的目標均已完成,我們已發展
了整合檢測與控制技術,並且建立了整合檢測
系統雛型。運用時間序列與多變量統計之技
術,我們建立了及時機台資料之模型,以作為
線上機台監控之用。
關鍵詞
關鍵詞
關鍵詞
關鍵詞:統計製程管制、督導控制、及時機台
監控
Abstract
The goals of this three-year project are to develop
integrated inspection and control schemes for
semiconductor cluster tools, which include
off-line process optimization and on-line process
control techniques.
In the first year, we have developed rational
subgrouping technique for modeling the oxide
thickness non-uniformity of the rapid thermal
cluster tool. In the second year, we then
developed the on-line supervisory control
technique.
The tasks of the third year include: 1) to develop
integrated inspection and control methodology 2)
to construct an integrated inspection system
prototype and 3) to conduct data analysis.
Currently the tasks are all completed. The
proposed integrated inspection methodology is
developed and the equipment monitoring system
prototype is constructed. Time-series modeling
and multivariate statistics are used to model the
real-time equipment data for on-line monitoring
purpose.
Keywords: statistical process control, supervisory
Integrated Inspection and Control for
Semiconductor Cluster Tools
ABSTRACT
As the wafer size increases from 200mm to 300mm, quality improvement and control for single wafer processing demand a tighter inspection and automation requirement. In recent years the use of cluster tools has become increasingly important for semiconductor fabrication. It is the goal of this research to develop integrated inspection and control schemes for semiconductor cluster tools, which include off-line process optimization and on-line process control techniques. Key algorithms of the developed techniques are reviewed.
INTRODUCTION
As the wafer size increases from 200mm to 300mm, quality improvement and control for single wafer processing demand a tighter inspection and automation requirement. In addition, to maintain the current productivity improvement in IC fabrication, the overall equipment effectiveness (OEE) must improve from the current 35% to 70% [1]. Studies have shown that process control will contribute to the OEE improvement because 1) it reduces the time for running test wafers 2) it improves wafer output quality 3) it reduces unscheduled downtime 4) it reduces the time for wafer rework and 5) it enhances correction efficiency. In the meantime, there has been a trend toward more in-situ measurements and real-time control for future semiconductor fabrication. This in turn demands an integrated inspection and control solution. It is then the goal of this research to develop integrated inspection and control schemes for semiconductor cluster tools. Here we define process optimization and control as the improvement of equipment / process performance by the integration of equipment, process, material, and wafer information acquisition; decision making; and execution.
In the current practice, process optimization and control are implemented in two stages: off-line and on-line. Off-line optimization uses the techniques of design of experiments [2]. Response surface methods [3][4] and the Taguchi method [5][6] are examples of methodologies based on the design of experiments. Both methods create models for the purpose of estimating the optimal operating point (recipe).
The most popular approach for on-line process control is the use of statistical process control for on-line fault detection [7][8]. Although it has been practiced in the semiconductor industry for many years, its capability is not fully utilized. Two examples are rational subgrouping and sampling techniques. For example, Roes et al. [9] describe
the rational subgroup techniques. Nurani et al. [10] and McIntyre et al. [11] investigate the sampling issue within the semiconductor industry. Spanos et al. in UC-Berkeley [12][13] and Bunkofske in IBM [14] propose an SPC scheme that utilizes time-series and multivariate SPC techniques to monitor tool data. Another on-line process control scheme that is getting more attention within the semiconductor industry is the supervisory control or run-to-run control. The SIA roadmap has specifically mentioned that during 1999-2004, run-to-run control should be implemented [15].
In summary, the integrated process control strategies have been identified as [16]:
a) use in-line / in-situ metrology b) use supervisory control c) track individual wafers
d) use multivariate SPC methods, and
e) monitor equipment performance in real time.
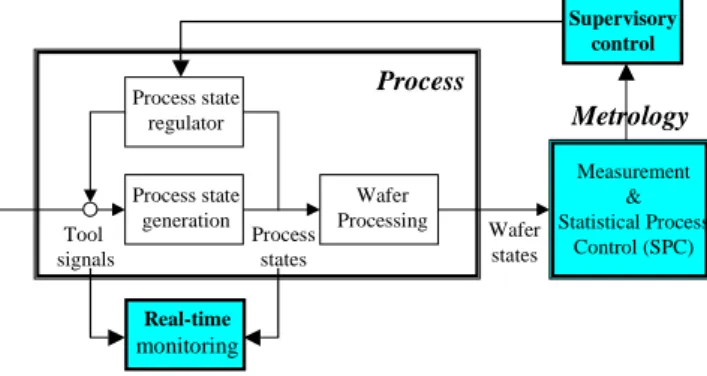
Based on these requirements, an integrated inspection and control framework for semiconductor equipment is proposed in Figure 1. As can be shown, the proposed framework consists of three modules: SPC, supervisory control and real-time monitoring. The SPC module serves as an on-line post-process monitoring tool while the real-time monitoring module serves as a real-time equipment/process monitoring tool. The supervisory control module serves as a run-to-run control on wafer output quality. Below, we review the key algorithms of each module. Wafer Processing Process state generation Process state regulator Tool signals Process states Wafer states Measurement & Statistical Process Control (SPC) Process Metrology Real-time monitoring Supervisory control
Figure 1: Integrated inspection and control
SPC AND SUPERVISORY CONTROL
Figure 2 illustrates the functional framework of the SPC and supervisory (feedback) control. As can be seen, the SPC module is used to distinguish between the common causes of variations and the special causes of variations. Only when there is an evidence indicating that the abnormal deviation is statistically significant, will the control actions be taken. Here, the Shewhart control chart is used to
detect a large process deviation while the EWMA control chart is used to detect a small process deviation. In the supervisory control module, both small and large deviation prediction modules use a moving average formulation. The constant term of a linear control model, initially obtained through off-line design of experiments and regression technique, is then re-tuned based on the estimated process deviation. A new process recipe (equipment setting) for the next run is generated to compensate for the observed process deviation. This detection and control process is then repeated on a run to run basis. Output measurement station Equipment Equipment settings Output measurements Model tuning Recipe generation Small deviation ?
Small deviation prediction
Feedback Control Module
Large deviation? Yes
No Controllable? Yes No Stop Shewhart control chart
Residual Model prediction
Statistical Process Control Module t t t Y Y e= −ˆ t k t a bX Yˆ= −1+ t Y σ 3 > t e b a T Xt+1=( − k)
EWMA control chart
1 ) 1 (− − + = t t t We W E E W W Et >3σ 2− Yes No
Large deviation prediction
t X ∑− + = = t M t j j t e M 1 1 ˆ δ Recipe in spec ? ∑−+ = = t m t j j t e m 1 1 ˆ δ t k k a a = −1+δˆ Stop Yes No
Figure 2: SPC and supervisory (feedback) control Next we demonstrate the effectiveness of the proposed algorithm through a simulated example. In this simple example, a process is assumed to have the model form as:
t t
t X
Y =α+β +ε
(1) in which α = 3000, β = 10 and
ε
t ~ N(0, σ2), σ = 50.Let’s further assume the target output is 3500. Now suppose that the process mean has a sudden shift of 3σ at run 10 and the results of the process output with and without using the detection and control algorithm are compared in Figures 3(a), 3(b) and 3(c).
As can be seen, the process is brought back to the target value in two
adjustments that occur at runs 13 and 27. The first adjustment at run 13 is actually triggered by the Shewhart control chart at run 12 and the adjustment magnitude is around 1.89σ. Since it is not completely compensated, there is another adjustment at run 27 which is triggered by the EWMA control chart at run 26 and the adjustment magnitude is around 1.15σ. 3300 3350 3400 3450 3500 3550 3600 3650 3700 3750 3800 1 11 21 31 41 51 61 71 81 91 101 run ou tp ut without control with control (m=4)
Figure 3(a): A simple example to show the effectiveness of the proposed detection and control algorithm.
-200 -150 -100 -50 0 50 100 150 200 1 11 21 31 41 51 61 71 81 91 101 R un R e si dua l L CL UCL
Figure 3(b): Shewhart control chart for the simulated shifting process. -45 -35 -25 -15 -5 5 15 25 35 45 55 1 11 21 31 41 51 61 71 81 91 101 Run UCL LCL ) 2 ( 3 W W − σ
Figure 3(c): EWMA control chart for the simulated shifting process.
REAL-TIME MONITORING
Real-time equipment monitoring and fault detection become critical as most problems reveal themselves first on the equipment performance and much later on the wafer quality. To perform real-time monitoring, we have proposed the following generic functions as shown in Figure 4.
Integrated monitoring scheme Raw data Run data Real-time SPC SPEC Run-to-run SPC Data classification Pattern filtering Multivariate SPC Trend chart Simultaneous monitoring
Overall health index
Integrated monitoring scheme Raw data Run data Real-time SPC SPEC Run-to-run SPC Data classification Pattern filtering Multivariate SPC Trend chart Simultaneous monitoring
Overall health index
Figure 4: Generic functions in real-time monitoring. As can be seen, the raw data can be examined through the pre-determined specification windows. In this respect, we propose the following functions:
a) Overall health index: This index provides an overall evaluation of the equipment’s health. Based on evaluation of the tool parameters’ performance against the setting specifications, a score is calculated. The score is re-evaluated when new sampled data points are received.
b) Simultaneous monitoring scheme: The scheme consists of 3 concentric circular regions. Observations of different parameters are first normalized and then displayed simultaneously on a dartboard. The farther away the observations from the dartboard center, the worse the performance of the corresponding tool parameters. The display of the scheme provides an easy reading of the equipment’s overall status.
c) Trend analyses: The trend charts will help us to examine the equipment performance over time. Based on the proposed functions, a prototype is developed using the data from a single-wafer rapid thermal chamber (Figure 5). Figure 6 and 7 show the overall health index, simultaneous monitoring dartboard and trend analysis for the rapid-thermal chamber.
Gate valve Process gas in Shower head Furnace (3 zone) Quartz window To pump Single wafer
Figure 5: Single-wafer rapid thermal chamber.
Figure 6: Overall health index and simultaneous monitoring for the rapid thermal chamber.
Figure 7: Trend analysis for the rapid thermal chamber. Because of the presence of process dynamics and internal feedback control mechanism, the real-time raw data often possess auto-correlation and cross-correlation natures. This prevents us from directly applying the traditional SPC techniques to the real-time data. Pre-treatment of raw data is thus needed. With data items classified into independent groups, the following functions are proposed for the real-time statistical monitoring:
a) Pattern filtering: This function builds a mathematical model to characterize the equipment behavior based on equipment data collected in real-time. Such a model allows us to predict the running trend of each data item under in-control conditions. By subtracting the predicted values from the actual observed value, the running pattern of the equipment data is filtered out. Left over is the residuals that can be later used to detect faults caused by special causes.
b) Multivariate SPC: The multivariate SPC technique is applied to the residuals of multiple data items to detect special faults that cause the process excursion. With the pattern filtering function described earlier, the normal behavior of the equipment data has been correctly predicted. If any excursion occurs, the actual observed values will deviate from the predicted values and the excursion will manifest itself in the residuals’ deviations.
Figure 8 shows the correlation between two equipment signals while Figure 9 shows the data pattern filtering function applied to the monitored signals.
Chamber temperature 424.00 426.00 428.00 430.00 432.00 1 5 run Current 0 5 10 15 20 1 5 run
Figure 8: Correlation between temperature and current.
Measured vs. time-series fitted current data
0 5 10 15 20 1 5 measured fitted
Residuals of current data
-4 -2 0 2 4 1 5 9 13 17 21 25 29 33 37 41 45 49 53 57 61 65 69 point
Figure 9: Data pattern filtering.
CONCLUSIONS
In this research, we have presented an integrated inspection and control scheme for semiconductor cluster tool. It consists of three modules of SPC, supervisory control and real-time monitoring. The SPC module and the supervisory control module provide an on-line run-to-run process quality control capability. The real-time monitoring module provides real-time equipment/process
monitoring function. Generic functions and modeling algorithms were developed and a prototype was constructed to demonstrate its feasibility.
REFERENCES
[1] L. Peters, J. Griffin, and R. Skinner, Cost Effective
IC Manufacturing 1995, Integrated Circuit
Engineering Corporation, 1995.
[2] D. Montgomery, Design and Analysis of Experiments,
New York: Wiley 1984.
[3] G. Box and N. Draper, Empirical Model-Building
and Response Surfaces, New York: Wiley, 1987.
[4] R. Myers, A. Khuri, and W. Carter, “Response Surface Methodology: 1966-1988,” Technometrics, vol. 31, no. 2, May 1989.
[5] G. Taguchi, Introduction to Quality Engineering,
Asian Productivity Organization, 1986.
[6] M. Phadke, Quality Engineering Using Robust Design, Englewood Cliffs, NJ: Prentice-Hall, 1989.
[7] D. Montgomery, Introduction to Statistical Quality Control, New York: Wiley 1996.
[8] S. Cunningham, C. Spanos, and K. Voros, “Semiconductor Yield Management: Results and Best Practices,” IEEE Trans. Semiconductor Manufacturing, vol. 8, no. 2, May 1995.
[9] K. Roes and R. Does, “Shewhart-type Charts in Nonstandard Situations,” Technometrics, vol. 37, no. 1, February 1995.
[10] R. Nurani, R. Akella, and A. Stojwas, “In-line Defect sampling Methodology in Yield management: An Integrated Framework,” IEEE Trans. Semiconductor Manufacturing, vol. 9, no. 4, November 1996.
[11] M. McIntyre, R. Nurani, and R. Akella, “Key Considerations in the Development of Defect Sampling Methodologies,” Advanced Semiconductor Manufacturing Conference, Cambridge, MA, 1996. [12] C. Spanos, H. Guo, A. Miller, and J. Levine-Parrill,
“Real-Time Statistical Process Control Using Tool Data,” IEEE Trans. Semiconductor Manufacturing, vol. 5, no. 4, November 1992.
[13] S. Lee, E. Boskin, H. Liu, E. Wen and C. Spanos, “RTSPC: A Software Utility for Real-Time SPC and Tool Data Analysis,” IEEE Trans. Semiconductor Manufacturing, vol. 8, no. 1, February 1995.
[14] R. Bunkofske, N. Pascoe, J. Colt and M. Smit, “Real-Time Process Monitoring,” Advanced Semiconductor Manufacturing Conference, Cambridge, MA, 1996.
[15] The National Technology Roadmap for Semiconductor, Semiconductor Industry Association, 1994.
[16] B. Johnson, “300mm Fab Architecture,” SEMATECH APC/EPC Workshop, September 1997.