行政院國家科學委員會專題研究計畫 成果報告
用系統工程方法設計強健生物 IC 電路--子計畫六:以定向
演化達成合成途徑最佳化與驗證強健系統設計理論
研究成果報告(精簡版)
計 畫 類 別 : 整合型 計 畫 編 號 : NSC 99-2221-E-009-153- 執 行 期 間 : 99 年 08 月 01 日至 100 年 07 月 31 日 執 行 單 位 : 國立交通大學生物科技學系(所) 計 畫 主 持 人 : 李曉青 計畫參與人員: 碩士班研究生-兼任助理人員:高敏智 碩士班研究生-兼任助理人員:翁正儀 大專生-兼任助理人員:吳劭易 處 理 方 式 : 本計畫涉及專利或其他智慧財產權,1 年後可公開查詢中 華 民 國 100 年 10 月 27 日
計畫成果報告內容
1 Introduction
Programming and controlling cell behavior require fine control of the protein expression levels. Previous studies provide several methods to predict the transcription rates of promoters and translation rates of ribosome binding sites (RBSs) respectively [19-23]. However, the protein expression level with time is hard to predict accurately by those methods. To overcome this problem, we selected four promoters and three RBSs with different regulation strengths and constructed 12 green fluorescent protein (GFP) expression devices which combine promoter, RBS and GFP in Escherichia coli (Fig.1a). Time course changes of fluorescence strengths were measured using a flow cytometry, and a dynamic model that captured the experimentally observed differences for each GFP expression device was developed in this study. Using this model, we can calculate the protein expression ability of the combined promoter-RBS biobrick in the different E. coli population density. Efforts to quantitatively characterize promoter-RBS biobricks and building databases of biobricks that conform to a standard are the first steps toward building database(s) of standardized and well-characterized biological biobricks. The characterization of these biobricks will allow the construction of computational models that would correctly represent the real system, and the standardization of the parts, in addition to aiding the models, also allow the parts to be assembled more efficiently [23].
The modeling component of synthetic biology allows one to design biological circuits and analyze its expected behavior. To verify this model can define the protein expression ability of the combined promoter-RBS biobrick in the different E. coli population density and can apply in complex genetic circuits, we report a model-based design method and apply in the repressor-controlled genetic circuits (Fig. 1b). The fitting results indicated this model-based design method can correctly predict the behavior of a system, and modeling can provide mechanistic understanding of a given system. This model-based design method provides a new tool for engineers to program new cellular behavior without having to perform large numbers of trial-and-error experiments.
2 Materials and Methods
2.1 Biobricks Used
The green fluorescent protein (GFP) expression devices for identifying the expression ability of the combined promoter-RBS biobrick were constructed as showing in Fig. 1a. Promoter, (BioBrick ref BBa_J23105, BBa_J23106, BBa_J23114, and
BBa_R0040) are a family of constitutive promoter which can constitutively transcript the downstream gene. Ribosomal binding sites, (RBSs, BioBrick ref BBa_B0030, BBa_B0032, and BBa_B0034) are downstream from promoter, which can regulate the quantity of a protein translation level. As the signal output of GFP expression devices, GFP (GFP, BioBrick ref BBa_E0040) is derived from jellyfish Aequeora
victoria wild-type GFP. The relation between protein concentration and fluorescence
strength was regard as positive correlation. Terminator ( BioBrick ref BBa_J61048) is a T1 terminator from rnpB gene of E. coli MG1655 which is responsible for stopping transcription step. The biobricks used in this study were listed in Table 1.
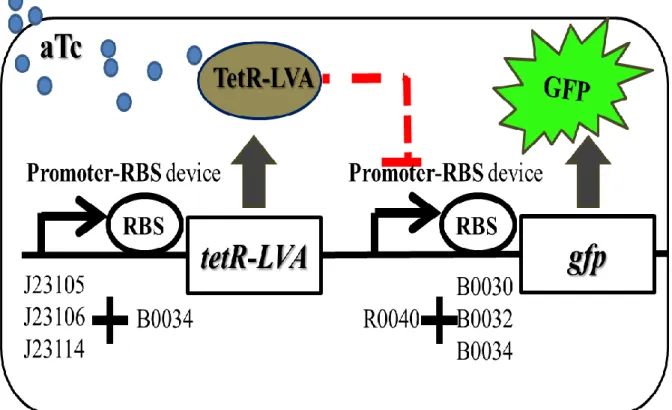
In the part of verification and application, we design nine repressor-controlled genetic circuits to verify the predictable behavior (Fig. 1b). In this circuit, TetR is expressed constitutively from upstream promoter-RBS biobrick. aTc, which freely diffuses into the cell, binds TetR and prevents the repression of downstream Ptet -RBS biobrick. In the upstream promoter-RBS biobrick, we pick three constitutive promoter, (BioBrick ref BBa_J23105, BBa_J23106, BBa_J23114) combining with RBS, (BioBrick ref BBa_B0034) for controlling TetR expression levels. TetR repressor protein (BioBrick ref BBa_C0040) coding gene is modified with an LVA tail for rapid protein degradation. In the downstream promoter-RBS biobrick, we select repressible promoter Ptet, which is constitutively ON and repressed by TetR repressor protein. We combine this promoter with three different RBSs, (BioBrick ref BBa_B0030, BBa_B0032, and BBa_B0034) to form three promoter-RBS devices with different protein expression ability. A genetic devices or circuit needs to be inserted into a carried backbone to express protein. The backbones contain a replication origin for determining the copies number in a host cell.
In the step of collecting GFP expression level, we transfer the well prepared genetic circuit into low copy number backbone pSB3T5 or pSB3K3. The pSB3T5 Backbone is a low copy number vector carrying tetracycline resistance and p15A replication origin (10–12copies per cell) is utilized in GFP expression devices. Backbone, pSB3K3 which is a low copy number vector carrying kanamycin resistance and p15A pMR101-derived replication origin (20–30copies per cell) is utilized in repressor-controlled genetic circuits.
2.2 Data Analysis, Computational Models, and Simulations
Fluorescence from an individual sample was calculated using CyFlow software (Partec.). The original log-binned fluorescence intensity values were collected with cell number counting, then, the normal distribution fluorescence intensity graphics could be ranged for obtaining mean and standard deviation of the resulting values. The mean and standard deviation of the resulting values were obtained for each
sample within a small forward and side scatter gate to reduce variability in cell size and shape. Finally, the mean of fluorescence intensity will be transformed into Molecular Equivalents of Fluorescent (MEFL) by the conversion of standard curve of measurement of SPHERO Rainbow Calibration Particles (Peak Technology Co., Ltd.).
Computational models were developed based on chemical mass action kinetics, and the resulting analytical formulas were fitted in Matlab (Math-Works) to the average of 3 experimental replicates.
3 Result
In principle, construction of genetic circuit with predicted functions requires fine control of the protein expression levels in host cells. In order to efficiently select adequate biobricks to achieve desired behaviors, the protein expression ability of promoter-RBS device should be characterizing based on the experimental data. The model-based design method for a synthetic genetic circuit is including following steps: (i) Construction of a promoter-RBS library and assay of GFP expression. (ii) Build a mathematical model to characterize protein expression ability of promoter-RBS devices. (iii) Explore desired circuit dynamic in silico. (iv) Verification of circuit behavior in vivo.
3.1 Construction of a Promoter-RBS Library and Assay of GFP Expression Programming and controlling cell behavior requires fine control of the protein expression levels in synthetic circuits. The first step is to establish a library of well-defined combined promoter-RBS devices that control protein expression levels of downstream genes. We selected four promoters and three RBSs with different regulation strengths and constructed 12 green fluorescent protein (GFP) expression devices which combine promoter, RBS and GFP gene in Escherichia coli (Fig. 2 and Table 2). All of the promoter-RBS expression devices in our GFP expression devices are constructed in low copy number backbone (pSB3T5) and performed experiment in the host cells, E. coli. This promoter-RBS library was cultured in M9 medium and assayed the GFP fluorescence by flow cytometry. This library showed three decades of variation in protein expression level (Fig. 3). Temporal analysis of GFP expression devices reveals that the promoters (J23105, J23106, and J23114), combined with the same RBS (B0030) displays higher fluorescence intensity than the same promoter combined with RBS (B0034) (Fig. 3 a-c). In the promoters (J23105, J23106, and J23114,), the translation activity of RBS (B0030) is higher than RBS (B0034). However, Ptet promoters (R0040) combined with the RBS (B0030) displays lower
fluorescence intensity than combined with RBS (B0034) (Fig. 3d). The results indicated that the strength of RBS is not explicitly dependent on the sequence of RBS, the promoter sequence also affects the strength of RBS. The reusing of the same-well characterized RBS sequence for different promoter is not likely to work reliably. To address this problem, protein expression rate of combined promoter-RBS devices were characterized to replace the transcription rate of promoter and translation rate of RBS separately in this study.
3.2 Build a Mathematical Model to Characterize Protein Expression Ability of Promoter-RBS Devices.
The logistic growth model is commonly used to describe the bacterium growth curve under the nutrient limited condition as follow [24-25]:
max 1 s s s k s s (1)
where s denotes the cell density parameter (optical density at 600 nm (O.D. 600)),
max
s denotes the maximum value of cell density, and k denotes growth rate s
constant. The cell density time course data of the bacteria with different GFP
expression devices were used to solve Eq. (1) (Fig. 4). The growth rate constant ks
was calculated and listed in Table 3. The Ptet promoter (R0040) combined with RBS
(B0034) had higher GFP protein expression level and had the smaller k i.e., slower s
growth rate. The results indicated that protein expression level of a genetic circuit is negatively correlated to the growth rate of a host bacterium. Bacteria with a low metabolic load have greater growth rate.
The protein expression ability of promoter-RBS devices is indirectly measured by fluorescence intensity of GFP expression devices (Fig. 2 and 3). Since the protein concentration per cell is diluted due to the cell growth and protein degradation, a dynamic model to character the protein expression ability of promoter-RBS devices can be built as follows:
GFP
x p s g s x (2) Where x denotes the protein expression level of a GFP expression device (Fig. 1a).
p s denotes the protein expression ability of a promoter-RBS device, which is the
GFP
denotes the protein degradation rate of GFP. g s
denotes the cell growth rate and can be determined from Eq. (1) as:
max 1 s s s g s k s s (3)The cell growth rate g s
can be calculated directly by experimental data of O.D. 600 (Fig.4). The negative correlation between cell growth rate g s
O.D. 600 indicated that bacteria loss their growth potential gradually when grow in the nutrient limited condition (Fig.5).To calculate the protein expression ability of a promoter-RBS devices p s
, we assume p s
is related to cell growth rate g s
, and a polynomial Eq. (4) is used to trace p s
as fellow (Fig. 6):
2 0 1 2p s P P g s P g s (4) where P denotes zero-order coefficient, 0 P denotes first-order coefficient and 1 P 2
denotes second-order coefficient. As we expect, promoter-RBS activity decrease during cell growth (Fig. 7). Similarly, promoter-RBS activity also decreases with time (Fig. 8).
3.3 Prediction and verification of protein expression levels in repressible system 3.3.1 Experimental description
To demonstrate reverse engineering, this model is used to predict the protein expression level in different genetic circuits (Fig. 9), and test if the experimental results consistent with the model prediction. Owing to this purpose, we design a repressible system to demonstrate the feasibility of our model. Our repressible system is composed of the part repressor expression and the part of green fluorescence protein output. There exists repressible interaction between the two parts. The part of upstream element expresses repressor and the downstream element is inhibited by TetR repressor (C0040) binding to TetR promoter (R0040). After adding inducer, anhydrotetracycline (aTc), the downstream gene expression turn on as output signal. Here, we select green fluorescence protein as the reporter gene for the output signal. The signal can be easily collected by flow cytometry.
In order to determinate the working concentration of inducer aTc, we tested 8 different concentrations, i.e. 0, 50, 100, 150, 250, 500, 1000, 2000 (ng/ml). For ensuring the cells grow to the steady-state, bacteria were cultured for 7 hours incubation with aTc. Then, we performed the data collection to achieve the defining of dose-dependent (Fig. 10) and cell density data (Fig. 11). We pick 1000 (ng/ml) as our working concentration for the purpose of inducing our repressible system [26]. Besides, we find that cells growth rate becomes slowing down in the higher inducer aTc concentration (Fig. 11). When the inducer concentration rises up to 10 times comparing to our working concentration, a phenomenon is observed that cell growth is inhibited (data not showed).
Furthermore, our circuits should be constructed in low copy number backbone pSB3K3 instead of pSB3T5 to carry out desirable behavior. Our repressible circuits can be turn on only in the inducer aTc existing condition. As information showed, inducer aTc is the analogue of antibiotic tetracycline. If we pick pSB3T5 as the backbone of circuits, the selection antibiotic tetracycline partially block the function of repressor. Then, the behavior of our repressible circuits may act not as our prediction. In order to integrate the parameters of GFP expression devices into our repressible circuits, we need to clarify one matter that the affect between the two different backbones. The backbone with 10–12copies per cell is called as pSB3T5 which used in GFP expression devices. And the backbone with 20–30copies per cell is called as pSB3K3 which used in repressible circuits for the aim of application and verification. The difference between backbones pSB3T5 and pSB3K3 are indicated that copy number can directly cause the protein expression quantity ratio changing as showing in (Fig. 12). This effect should be considered as a constant in the model prediction process.
3.3.2 Mathematical model description
In this section, the parameters we use which are from Table 4 and Table 5 and all of fluorescence measurement data of these repressible circuits do not participate modeling identified process. The dynamic model in Eq. (5), expressed from a constitutive promoter and model in Eq. (6), expressed from a repressible promoter which is regulated by an inducer aTc, is shown as follows:
tetR tetR tetR tetRx p s
g s x (5)
GFP
tetR
GFP GFP GFP GFP * tetR tetR 1 1 n p s x p s g s x x K (6)max 1 c s s k s s (7)
where xtetR and xGFP denotes the concentrations of protein TetR and GFP,
respectively; t e t R and GFP denotes the degradation rates of protein TetR and GFP, respectively; KtetR denotes the TetR-DNA binding affinity; ntetR denotes the
binding cooperatives between TetR and DNA; s denotes the cell density (Fig. 13);
c
k denotes growth constant in repressible circuits (Table 6); the growth g s rate
also descripts in (Fig. 14) ; denotes the leaky expression constant; x*tetR denotes the repressor activity while TetR is expressed from a constitutive promoter and interacted with the downstream repressible promoter to inhibiting expression.
Furthermore, the repressor activity x*tetR is also regulated by the inducer aTc. The
relationship between the repressor activity x*tetR and the inducer aTc can be described as follows Eq. (8):
aTc tetR * tetR tetR aTc 1 1 n x x x aTc K (8)where KaTc denotes the aTc-TetR dissociation rate; naTc denotes the binding
cooperativity between aTc and TetR; ptetR
s and ptetR
s represent to the regulation function of protein expression; denotes the leaky expression constant; aTc denotes the inducer working concentration. As Table 5 showing, the proteinexpression strength of promoter-RBS devices ptetR
s and ptetR
s , respectively. Almost all of the parameters are mentioned above can be selected from Table 4 andTable 5. However, there are lacks of two parameters KtetR and KaTc to be estimated
3.3.3 Prediction result
The expression parameters in the library of promoter-RBS devices in Table 4 and Table 5 can determine the corresponding devices regulatory activity. The different selections of devices specify different regulation functions in Eq. (1) and the synthetic regulatory network have the different behaviors by these devices. Base on the combinational devices which are selected from Table 2 to become a new circuit with repressible behavior in Table 7. The predictable results are showed in (Fig. 15). The simulated curve can predict the real experimental trend. Hence, the selection of adequate device from library can be considered as a design method for the synthetic gene network to achieve some desired behaviors. The devices in the synthetic regulatory network could be considered as a device set, and then the device set in the regulatory network can regulate gene expression to desired behaviors.
4 Discussion
Recently, a controllable life system is concerned. In a life system, protein-protein interaction directly affected whole system behaviors, and all of these functional proteins were decided by the genetic codon. Therefore, synthetic scientists can utilize molecular biology techniques to manipulate and modify DNA sequences for a specific application. In the last years many gene circuits have been developed to achieve a fine tune of gene expression and protein synthesis. All of these literatures displayed the same ideal that protein expression level can be tuned and predicted [27-31]. Predictable function is performed by mathematic model calculating, that is the major feature in synthetic biology. Each case showed that simulation result can match with experiment data. As description, it exhibited a very useful application by using mathematic model to predict system behaviors. Unfortunately, some problems had been existed for a period of time. The simulation of each case needed to develop a new model system by iterative model calculation. Even in the similar events, synthetic scientists also required to create a new model for fitting their own experiment data. For the reason, it will waste a large amount and time and money to iteratively calculate the mathematical model. In order to solve this problem, we proposed three strategies as our results. Before we studied a complex life behavior, several simple components were analyzed for estimating the parameters of our model by the identification technique. Then, our model could generally apply to another gene expression system by using our promoter-RBS library. Furthermore, we proposed a new concept totally subverting existing opinion. Previous researches told us how to define the promoter and RBS strengths. However, only the steady states of system were considered. Since the gene expression is a dynamic behavior, the time profile plays an important role in estimating promoter-RBS strength constant. On the other
hand, environmental stresses frequently caused great effects in protein expression level by shooting down gene activity. For the above reasons, we think the cell density is the most important factor, especially the cell density reached the steady-state. Furthermore, previous studies considered that protein expression strength corresponds to time scale. However, experimental samples which were transformed with different plasmid. And the output signals were carried out with different cell growth rate in the same time scale. As our result showing, the different growth rate of samples can be compared within (Fig. 14). When cell transforms plasmid with the repressible circuits, the cell doubling time was lower than transforms plasmid with simple express gene. For example, the doubling time of repressible circuit in (Fig. 14(I)) was 79.327 minutes and the doubling time of simple express gene in (Fig. 14(I)) was 114.844 minutes. We suspect that extra protein expression directly affected cell growth. Here, we provided the protein expression rate in the different E. coli population density devices for the protein expression predicted. Designers can pick up any well-defined protein expression to achieve desire protein expression. Our works can exactly accelerate the development of synthetic biology.
In previous studies, the transcriptional strengths of promoter and transcriptional strengths of RBSs were defined separately as constant values [29-30]. However, the transcriptional rate is faster than the translational rate. Therefore, it is a compromising consideration that the transcriptional and translational rates were integrated. Thus, we proposed that promoter and RBS can be integrated into a well-defined promoter-RBS device with simply mathematical description by our own model. In biological concepts, the expression rates of most proteins decreased dramatically while the bacteria density growing up to the stationary phase. Our model can accurately describe the decreasing current of the protein expression activity from log phase to stationary phase (Fig. 7). This concept significantly improved the simulation results (Fig. 6). The protein expression rate of different promoter and RBS which changed with cell density (O.D. 600) were estimated in (Fig. 7), and the function of growth rate changed with cell density (O.D. 600) was estimated in (Fig. 5). The simulation curves in (Fig. 7) and (Fig. 8) have the similar patterns, suggesting the bacteria growth state was an important indicator to the expression strength of promoter-RBS devices.
We also find that the DNA copy number can directly affect the protein expression level. In order to prove this hypothesis, we picked up three expression devices, (PtR30, PtR32, and PtR34) which were constructed in pSB3K3 and pSB3T5, respectively. For comparing the difference between two type backbones, we collected the time-course data and analyze the difference of output signal (Fig. 12). As result showing, when the plasmid copy number was double, the protein quantities
proportionally double.
In this study, to design a novel gene network and functional circuit with predictable function were our final goal. Based on this reason, we designed repressible circuits for verifying our hypothesis. In these repressible circuits, we randomly picked up promoter-RBS devices to demonstrate the predictable functional (Fig.15). In result (Fig. 15), the simulation curves were not matching as our expected. The main reason was that a synthetic gene network suffers from both (1) intrinsic parameter fluctuations due to gene expression noises, alternative splicing, DNA mutation, thermal fluctuations, and (2) external disturbances due to undefined or changing extra cellular environment, interactions with cellular context in the host cell. These intrinsic parameter fluctuations and external disturbances currently hindered us from performing the interactional networks of specific gene and protein.
Finally, if the transcription and translation processes were not considered during the engineering of the synthetic gene networks, the realized networks cannot show the predictable or desired behaviors. Hence the distribution of this paper is not only to improve the existing gene networks, but also to engineer a novel gene networks by the mathematical model developed in this paper. In the future, more and more biological compositions are identified and well-characterized, engineering a novel and predictable gene network will be easily implemented. This will be a great distribution for synthetic biology.
(a)
(b)
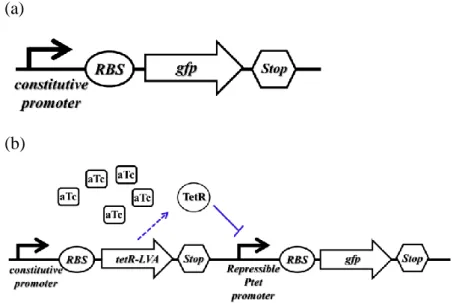
Figure 1: The different parts are assembled in a device.
(a) A transcription unit to express specific proteins needs promoter, ribosome binding sites (RBS), green fluorescence protein (GFP) and transcriptional terminators. (b) In this circuit, TetR is expressed constitutively from constitutive promoter. aTc, which freely diffuses into the cell, binds TetR and prevents the repression of Ptet promoter.
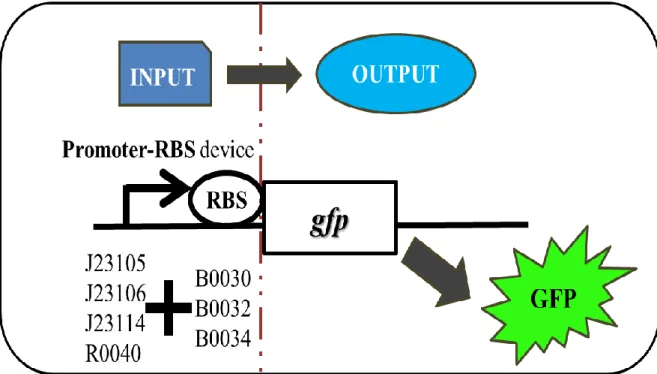
Figure 2: Combinatorial promoter-RBS architecture reveals constitutive expression.
(a) The reporter gene, green fluorescence protein (GFP) locates downstream of promoter-RBS devices as output. The output expression is controlled by differently combinatorial promoter-RBS devices. Each promoter-RBS device is expected to show the significant expression diversity. The combinatorial library contains 12 sets of promoter-RBS devices. Each set consists of different promoters and RBSs.
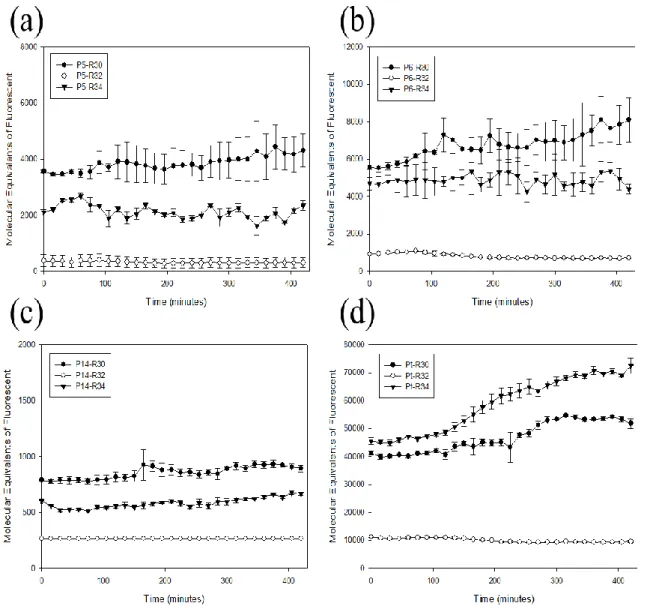
Figure 3: The time-course expression results were measured with time for 12 sets of GFP expression devices.
(a) promoter-RBS devices which contained the same promoter J23105 combined with three different RBSs (B0030, B0032, and B0034) were selected for measuring. (b) promoter-RBS devices which contained the same promoter J23106 combined with three different RBSs (B0030, B0032, and B0034) were selected for measuring. (c) promoter-RBS devices which contain the same promoter J23114 combined with three different RBSs (B0030, B0032, and B0034) were selected for measuring. (d) promoter-RBS devices which contained the same repressible promoter R0040 combined with three different RBSs (B0030, B0032, and B0034) were selected for measuring. Each measuring even was detected every 15 minutes. And all of the data represented the average of three independent measurements. Error bars indicated standard deviations. X-axis indicated the time units, and Y-axis indicated the fluorescence units with different scales. Furthermore, the fluorescent signals changed with time per cell were measured by using a flow cytometer.
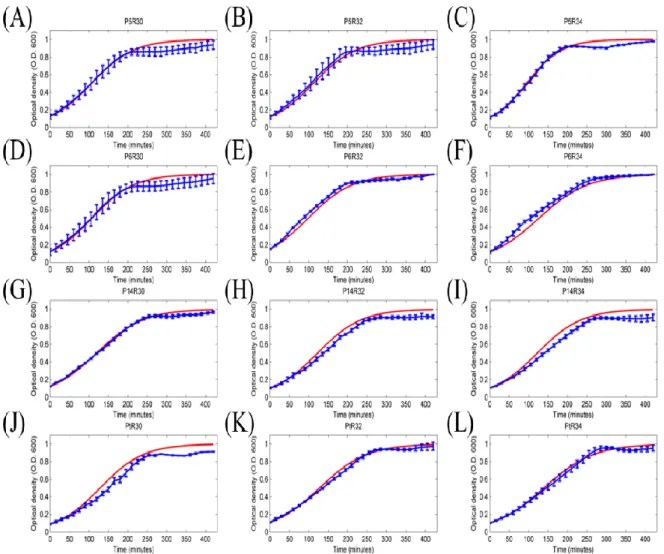
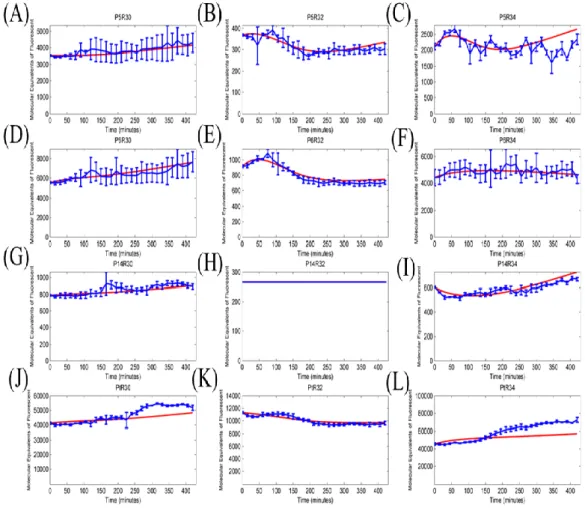
Figure 4: The simulated result of 12 sets of promoter-RBS expression devices. Blue dotted lines were the fluorescence intensities of individual expression devices with different promoters and RBSs. Red curves were the simulated result based on the least squares to estimate parameters in Table 2. Label numbers from (A) to (L) corresponded to Table 6. And all of the data represented the average of three independent measurements. Error bars indicated standard deviations. X-axis indicated the time units, and Y-axis indicated the fluorescence units with different scales.
Figure 5: The growth rate changed with cell density (O.D. 600) in GFP expression devices.
Blue dotted lines were the growth rate of individual expression devices with different promoters and RBSs. Red curves were the simulated result based on the least squares estimated parameters in table 2. Label numbers from (A) to (L) corresponded to table 6. The growth rate showed a significant decreasing current with cells growing. In the saturated stage, cell density reached to the maxima concentration and the cell growth rate almost decreased to 0. All of the data represented the average of three independent measurements. Error bars indicated standard deviations. X-axis indicated the cell density units, and Y-axis indicated the growth rate with the different scales.
Figure 6: The simulated result of 12 sets of promoter-RBS expression devices. Blue dotted lines were the fluorescence intensities of individual expression devices with different promoters and RBSs. Red curves were the simulated result based on the least squares to estimate parameters in Table 2. Label numbers from (A) to (L) corresponded to Table 6. And all of the data represented the average of three independent measurements. Error bars indicated standard deviations. X-axis indicated the time units, and Y-axis indicated the fluorescence units with different scales.
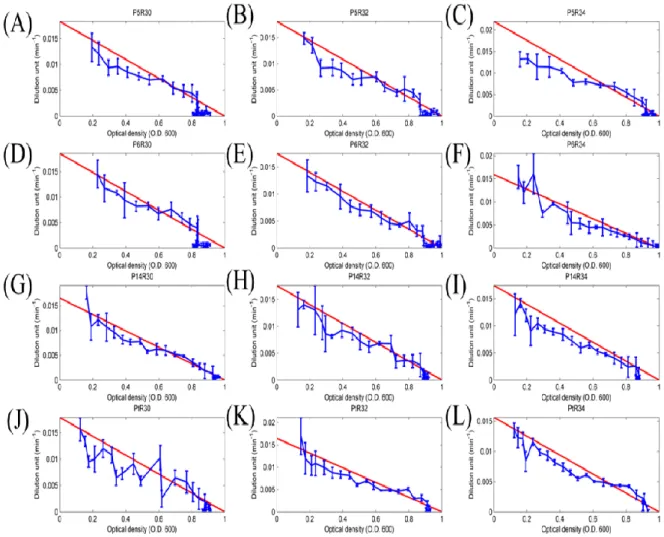
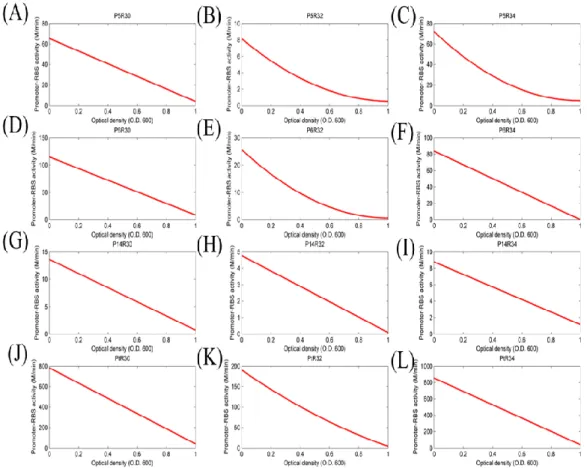
Figure 7: The activity of different promoter-RBS devices changed with cell density (O.D. 600).
We proposed that the activity of promoter-RBS devices will decrease and change with cell growing. Label numbers from (A) to (L) corresponded to table 6. And all of the data represented the average of three independent measurements. X-axis indicated the cell density units, and Y-axis indicated the device expressed units with different scales.
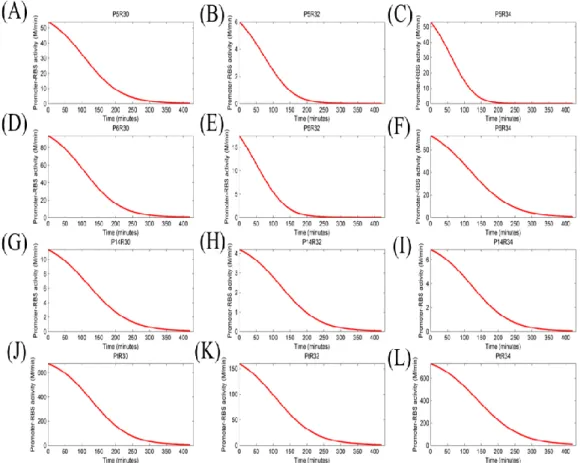
Figure 8: The activity of different promoter-RBS devices changed with time. We proposed that the activity of promoter-RBS devices will decrease and change with cell growing. Label numbers from (A) to (L) corresponded to table 6. And all of the data represented the average of three independent measurements. X-axis indicated the cell density units, and Y-axis indicated the device expressed units with different scales.
Figure 9: The schematic diagram for measuring the promoter-RBS activities included 9 sets of combinatorial promoter-RBS devices.
We designed a repressor-controlled system for verifying our predicted model. It can be divided into two parts. In the part of upstream was responsible for yielding repressor to repress target promoter. In the part of upstream, promoter-RBS devices controlled the TetR protein producing. In the part of downstream, promoter-RBS devices controlled the yielding of reporter gene, green fluorescence protein. And the expression of reporter gene will be turned on when inducer was adding to block the repressor. Thus, each promoter-RBS devices were expected to play a major role for showing expression diversity. As diagram showing, upstream contained 3 sets of promoter-RBS devices and each set had the same ribosome binding site (B0034). Downstream contained 3sets of promoter-RBS devices and each set has the same repressible promoter (R0040).
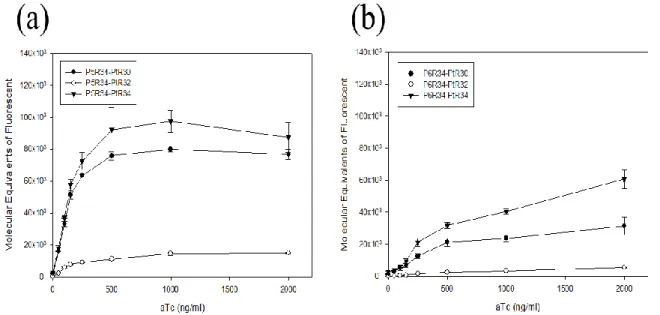
Figure 10: Repressible circuits treated with different concentration inducer (aTc).
X-axis indicated the concentration units of inducer, and Y-axis indicated the fluorescence units with the same scale. Mean fluorescence of cells transformed with 9 different combined circuits and treated with different inducer aTc concentrations. After 420 minutes, the data was collected for three repeats in the condition of cells growing into steady-state. All of the data represented the average of three independent measurements. Error bars indicated standard deviations. Based on our result, circuits (c) had an improved sensitivity comparing with circuits (a). Conversely, circuits (b) had a worsen sensitivity comparing with circuits (a). The transition from low to high output occurred on the different range of aTc concentrations.
Figure 11: The dose-affected in repressible circuits caused a significant variation. X-axis indicated the inducer aTc concentrations, and Y-axis indicated the optical density values with the same scale. Each measuring even was detected after 420 minutes and at the same time fluorescence signal is also measured (Fig.5). As result (a)(b)(c) demonstration, when inducer aTc concentration raised up to 2000 ng/ml, cell density had a significant decreased current. Result (c) had a higher variation in the low inducer concentration region and high inducer concentration.
Figure 12: Different copy number plasmid caused proportional exchanging of protein level.
Promoter-RBS devices which contained the same repressible promoter R0040 combined with three different RBSs (B0030, B0032, and B0034) were selected for inserting into different copy number backbones, pSB3T5, and pSB3K3. The copy number of pSB3T5 was 10-12 copies per cell and pSB3K3 was 20-30 copies per cell. Base on the copy number ratio, pSB3K3 was 2-2.5 times than pSB3T5. As the result showing, all of the data displayed a proportionate diversification. Each case (a)(b)(c) of expression evens had a similar feature that the expression quantity with backbone pSB3K3 is 2-2.5 times than with backbone pSB3T5. Each measuring even was detected every 15 minutes. And all of the data represented the average of three independent measurements. Error bars indicated standard deviations. X-axis indicated the time units, and Y-axis indicated the fluorescence units with different scales. Furthermore, the fluorescent signals changed with time per cell were measured by using a flow cytometer.
Figure 13: The features of cell density were descripted via model fitting in the repressible circuits.
Blue dotted lines were the optical density (O.D. 600) of individual circuits with different promoters and RBSs. Red curves were the simulated result based on the least squares to estimate parameters in table 2. Label numbers from (A) to (I) correspond to table 7. And all of the data represented the average of three independent measurements. Error bars indicated standard deviations. X-axis indicated the time units, and Y-axis indicated the cell density units with normalized scales. The parameter (table 2) can be identified by using equation (7). The growth characteristics of each circuit can be individually descripted as table 5 by modeling operation.
Figure 14: The growth rate changed with cell density (O.D. 600) in repressible circuits.
Blue dotted lines were the growth rate of individual circuit with different promoters and RBSs. Red curves were the simulated result based on the least squares estimated parameters in table 2. Label numbers from (A) to (I) corresponded to table 7. The growth rate showed a significant decreasing current with cells growing. In the saturated stage, cell density reached to the maxima concentration and the cell growth rate almost decreased to 0. All of the data represented the average of three independent measurements. Error bars indicated standard deviations. X-axis indicated the cell density units, and Y-axis indicated the growth rate with the different scales.
Figure 15: The dynamic of the behavior of repressible circuits fitted with simulated result.
Each scheme from (A) to (I) can correct to table 7 with the abbreviation. The data represented the average of three independent measurements. Error bars indicated standard deviations. X-axis indicated the time unit, and Y-axis indicated the fluorescence quantity units with the same scale. Blue dotted lines were the fluorescence quantity of individual expression devices with different promoters and RBSs. Red curves were the simulated result for predicting circuit behavior.
Table 1: List of biobricks used in this study
BioBricks
No. Function Description
J23105 Promoter A constitutive promoter with medium transcriptional intensity. J23106 Promoter A constitutive promoter with high transcriptional intensity. J23114 Promoter A constitutive promoter with low transcriptional intensity. R0040 Promoter A promoter is constitutively ON and repressed by TetR protein. B0030 RBS A ribosome binding site with medium translational intensity. B0032 RBS A ribosome binding site with low translational intensity. B0034 RBS A ribosome binding site with high translational intensity.
C0040 Protein Tetracycline repressor from transposon Tn10 Modified with an LVA tail for rapid degradation of the protein. E0040 Protein Green fluorescent protein derived from jellyfish Aequeora victoria J61048 Terminator A terminator from rnpB gene of E. coli MG1655.
pSB1A3 Backbone A high copy number plasmid carrying ampicillin resistance. pSB1K3 Backbone A high copy number plasmid carrying kanamycin resistance. pSB1C3 Backbone A high copy number plasmid carrying chloramphenicol resistance. pSB3K3 Backbone A medium copy number plasmid carrying kanamycin resistance. pSB3T5 Backbone A medium copy number plasmid carrying kanamycin resistance. Refer to iGEM biobricks web site: http://partsregistry.org/Main_Page
Table 2: The name of 12 green fluorescence protein devices and their composed biobricks
Name Biobricks assembled Backbone
P5-R30 J23105+B0030+E0040+J61048 pSB3T5 P5-R32 J23105+B0032+E0040+J61048 pSB3T5 P5-R34 J23105+B0034+E0040+J61048 pSB3T5 P6-R30 J23106+B0030+E0040+J61048 pSB3T5 P6-R32 J23106+B0032+E0040+J61048 pSB3T5 P6-R34 J23106+B0034+E0040+J61048 pSB3T5 P14-R30 J23114+B0030+E0040+J61048 pSB3T5 P14-R32 J23114+B0032+E0040+J61048 pSB3T5 P14-R34 J23114+B0034+E0040+J61048 pSB3T5 Pt-R30 R0040+B0030+E0040+J61048 pSB3T5, pSB3K3* Pt-R32 R0040+B0032+E0040+J61048 pSB3T5, pSB3K3* Pt-R34 R0040+B0034+E0040+J61048 pSB3T5, pSB3K3* A (*) refers to construct in two different backbone.
Table 3: The growth constant ks for GFP expression devices Name k s P5-R30 0.018 P5-R32 0.018 P5-R34 0.022 P6-R30 0.019 P6-R32 0.018 P6-R34 0.016 P14-R30 0.017 P14-R32 0.018 P14-R34 0.018 Pt-R30 0.018 Pt-R32 0.017 Pt-R34 0.016
The defined promoter-RBS devices carried out different protein level and comprised different growth constant with their corresponding cell growth rate. We used equation (2) to identify the growth constant of devices via experimental data fitting (figure 4). Each promoter-RBS device corresponded to their growth constant.
Table 4: Parameters of the promoter-RBS devices
Parameter Description Value Units Ref.
tetR
K TetR binding affinity 28.209 M *
aTc
K ATc-TetR dissociation
rate 589.049 ng/ml *
tetR
n Binding cooperativity
between TetR and DNA 2 -- [32]
aTc
n Binding cooperativity
between ATc and TetR 4 -- [32]
GFP
GFP degradation rate 3.5×10⁻⁴ min-1 [33]
tetR
TetR degradation rate 0.139 min-1 [34]
a
TetR protein leaky ratio 10-6 -- *b GFP leaky ratio 10-6 -- *
A (*) refers to units designed for this study. All parameter values are obtained from empirical studies in the literature or estimated via our experimental data.
Table 5:Parameter of polynomials used for model fitting P0 denotes the protein leaky
expression, P0 denotes zero-order coefficient; P1 denotes first-order coefficient; P2 denotes
second-order coefficient. Sample P 0 P 1 P 2 P5-R30 3.800 3361.300 52.800 P5-R32 0.500 23.900 22084.800 P5-R34 4.600 0.000 140069.200 P6-R30 8.600 5722.000 89.300 P6-R32 0.500 31.000 80205.300 P6-R34 0.000 5261.900 64.200 P14-R30 0.700 781.400 11.100 P14-R32 0.100 266.000 0.000 P14-R34 1.100 437.200 7.100 Pt-R30 40.000 41364.900 0.000 Pt-R32 1.300 7590.100 224952.100 Pt-R34 40.000 52000.600 0.000
Table 6: The Growth constant of host cells carrying with the plasmid of repressible circuits Circuits k c P5R34-PtR30 0.011 P5R34-PtR32 0.012 P5R34-PtR34 0.011 P6R34-PtR30 0.013 P6R34-PtR32 0.012 P6R34-PtR34 0.012 P14R34-PtR30 0.011 P14R34-PtR32 0.012 P14R34-PtR34 0.010
In the repressible circuits, each individual circuit carried out different protein level and comprised different growth constant with their corresponding cell growth rate. We used equation (7) to identify the growth constant of devices via experimental data fitting (figure 9). Each promoter-RBS device corresponded to their growth constant.
Table 7: The sample labeling for predicted function correlated to the biobricks assembled order
Label Circuits Bricks assembled
A P5R34-PtR30 J23105+B0034+C0040+J61048+R0040+B0030+E0040+J61048 B P5R34-PtR32 J23105+B0034+C0040+J61048+R0040+B0032+E0040+J61048 C P5R34-PtR34 J23105+B0034+C0040+J61048+R0040+B0034+E0040+J61048 D P6R34-PtR30 J23106+B0034+C0040+J61048+R0040+B0030+E0040+J61048 E P6R34-PtR32 J23106+B0034+C0040+J61048+R0040+B0032+E0040+J61048 F P6R34-PtR34 J23106+B0034+C0040+J61048+R0040+B0034+E0040+J61048 G P14R34-PtR30 J23114+B0034+C0040+J61048+R0040+B0030+E0040+J61048 H P14R34-PtR32 J23114+B0034+C0040+J61048+R0040+B0032+E0040+J61048 I P14R34-PtR34 J23114+B0034+C0040+J61048+R0040+B0034+E0040+J61048
The repressible circuits were constructed in backbone pSB3K3 to performing our experiment.
Reference
1. Andrianantoandro, E., et al., Synthetic biology: new engineering rules for an
emerging discipline. Molecular Systems Biology, 2006. 2: p. 2006 0028.
2. Gardner, T.S., C.R. Cantor, and J.J. Collins, Construction of a genetic toggle
switch in Escherichia coli. Nature, 2000. 403(6767): p. 339-342.
3. Kramer, B.P., et al., An engineered epigenetic transgene switch in mammalian
cells. Nat Biotechnol, 2004. 22(7): p. 867-870.
4. Atkinson, M.R., et al., Development of genetic circuitry exhibiting toggle
switch or oscillatory behavior in Escherichia coli. Cell, 2003. 113(5): p.
597-607.
5. Goh, K.I., B. Kahng, and K.H. Cho, Sustained oscillations in extended genetic
oscillatory systems. Biophys J, 2008. 94(11): p. 4270-6.
6. Stricker, J., et al., A fast, robust and tunable synthetic gene oscillator. Nature, 2008. 456(7221): p. 516-9.
7. Tigges, M., et al., A tunable synthetic mammalian oscillator. Nature, 2009. 457(7227): p. 309-12.
8. Basu, S., et al., Spatiotemporal control of gene expression with
pulse-generating networks. Proc Natl Acad Sci U S A, 2004. 101(17): p.
9. Friedland, A.E., et al., Synthetic gene networks that count. Science, 2009. 324(5931): p. 1199-202.
10. Rinaudo, K., et al., A universal RNAi-based logic evaluator that operates in
mammalian cells. Nat Biotechnol, 2007. 25(7): p. 795-801.
11. Win, M.N. and C.D. Smolke, Higher-order cellular information processing
with synthetic RNA devices. Science, 2008. 322(5900): p. 456-60.
12. Hooshangi, S., S. Thiberge, and R. Weiss, Ultrasensitivity and noise
propagation in a synthetic transcriptional cascade. Proc Natl Acad Sci U.S.A,
2005. 102(10): p. 3581-3586.
13. Sohka, T., R.A. Heins, and M. Ostermeier, Morphogen-defined patterning of
Escherichia coli enabled by an externally tunable band-pass filter. J Biol Eng,
2009. 3: p. 10.
14. Sohka, T., et al., An externally tunable bacterial band-pass filter. Proc Natl Acad Sci U S A, 2009. 106(25): p. 10135-40.
15. Win, M.N. and C.D. Smolke, A modular and extensible RNA-based
gene-regulatory platform for engineering cellular function. Proc Natl Acad Sci
U S A, 2007. 104(36): p. 14283-8.
16. Kobayashi, H., et al., Programmable cells: interfacing natural and engineered
gene networks. Proc Natl Acad Sci U S A, 2004. 101(22): p. 8414-8419.
17. Basu, S., et al., A synthetic multicellular system for programmed pattern
formation. Nature, 2005. 434(7037): p. 1130-1134.
18. Pai, A., et al., Engineering multicellular systems by cell-cell communication. Curr Opin Biotechnol, 2009. 20(4): p. 461-70.
19. Murphy, K.F., G. Balazsi, and J.J. Collins, Combinatorial promoter design for
engineering noisy gene expression. Proc Natl Acad Sci U S A, 2007. 104(31):
p. 12726-31.
20. Canton, B., A. Labno, and D. Endy, Refinement and standardization of
synthetic biological parts and devices. Nat Biotechnol, 2008. 26(7): p. 787-93.
21. Hooshangi, S., S. Thiberge, and R. Weiss, Ultrasensitivity and noise
propagation in a synthetic transcriptional cascade. Proceedings of the
National Academy of Sciences of the United States of America, 2005. 102(10): p. 3581 - 3586.
22. Murphy, K.F., et al., Tuning and controlling gene expression noise in synthetic
gene networks. Nucleic Acids Res, 2010. 38(8): p. 2712-26.
23. Chandran, D., et al., Mathematical modeling and synthetic biology. Drug Discovery Today: Disease Models, 2008. 5(4): p. 299-309.
24. You, L., et al., Programmed population control by cell-cell communication
25. RICHARDS, F.J., A Flexible Growth Function for Empirical Use. Journal of Experimental Botany, 1959. 10(2): p. 290-301.
26. Hooshangi, S., S. Thiberge, and R. Weiss, Ultrasensitivity and noise
propagation in a synthetic transcriptional cascade. Proc Natl Acad Sci U S A,
2005. 102(10): p. 3581-6.
27. Anderson, J.C., C.A. Voigt, and A.P. Arkin, Environmental signal integration
by a modular AND gate. Mol Syst Biol, 2007. 3: p. 133.
28. Hammer, K., I. Mijakovic, and P.R. Jensen, Synthetic promoter
libraries--tuning of gene expression. Trends Biotechnol, 2006. 24(2): p. 53-5.
29. Ellis, T., X. Wang, and J.J. Collins, Diversity-based, model-guided
construction of synthetic gene networks with predicted functions. Nat
Biotechnol, 2009. 27(5): p. 465-71.
30. Salis, H.M., E.A. Mirsky, and C.A. Voigt, Automated design of synthetic
ribosome binding sites to control protein expression. Nat Biotechnol, 2009.
27(10): p. 946-50.
31. De Mey, M., et al., Promoter knock-in: a novel rational method for the fine
tuning of genes. BMC Biotechnol, 2010. 10: p. 26.
32. Braun, D., S. Basu, and R. Weiss. Parameter estimation for two synthetic gene
networks: a case study. in Acoustics, Speech, and Signal Processing, 2005. Proceedings. (ICASSP '05). IEEE International Conference on. 2005.
33. Elowitz, M.B. and S. Leibler, A synthetic oscillatory network of
transcriptional regulators. Nature, 2000. 403(6767): p. 335-338.
34. Tuttle, L.M., et al., Model-driven designs of an oscillating gene network. Biophys J, 2005. 89(6): p. 3873-83. 【計畫成果自評】 本研究計畫執行至今,執行進度與預期相符。鑑於目前相關文獻並無法提供 一有效方式可以定義在不同細菌生長時期 promoter 在轉錄層級上的強度以及 RBS 在轉譯層級上的強度。因此,本計畫提供了一個新的方法來重新定義 Promoter_RBS 在轉錄、轉譯層級上的強度並確立其與細菌生長相關性。利用已 知不同蛋白質表現強度的 promoter_RBS 建構成 9 條具有完整功能的表現單位 (device),並將其放入特定載體後送入宿主 E.coli 表現之。目前已經成功利用動 態 model 計算出每一元件在不同生長時期之蛋白質表現強度。之後我們有將 DNA 元件組合成複雜的 device,組裝完成後的表現行為符合設計,證實我們的方式可 以用來設計並預測複雜之生物電路。學術論文發表方面:由於本計畫建構 model 的方法具有其獨創性,加上想法上的新穎性。結合分子生物學及工程學之原理,
將機電領域的系統設計理論應用至生物系統,設計並建造標準化及可交換性 DNA 序列,以構成各式生物元件。而這些生物元件與其他生物元件連結後,便 能組成具有功能性的 device,執行不同的功能,進而控制細胞進行一系列的工 作,將遺傳工程拓展到多基因的研究。因此,在跨領域期刊的接受度上,具有一 定的前瞻性,目前有兩篇期刊論文正在撰寫中。已有一篇研討會論文獲邀至新加 坡進行口頭演講(註一)。 國際競賽方面:2010 年指導交通大學生物科技學生團隊赴美參加 MIT 舉辦 之國際基因工程競賽,以【蚊子終結者】作品獲得銀牌獎,榮登交大首頁,校長 公開表揚成果,獲得媒體廣泛報導,為台灣爭光。
1. Chen C. H., H. C. Lee, and B. S. Chen. 2011. Robust synthetic gene network design via library-based search method Bioinformatics 2011.
2. Lee H. C, and Chen B. S. 2010. Synthetic biology: construction of genetic circuits for engineering applications. International Journal of systems and synthetic biology 1:71-86.
註一:Hsiao-Ching Lee, Pei-Chun Shih, Yao-Te Tsai, Bor-Sen Chen, and Ching-Ping Tseng. Identifying the interaction function between promoters and ribosome binding sites. 2010 August 2-4, The 2nd international conference on cellular and molecular bioengineering
國科會補助計畫衍生研發成果推廣資料表
日期:2011/10/27國科會補助計畫
計畫名稱: 子計畫六:以定向演化達成合成途徑最佳化與驗證強健系統設計理論 計畫主持人: 李曉青 計畫編號: 99-2221-E-009-153- 學門領域: 系統生物研究無研發成果推廣資料
99 年度專題研究計畫研究成果彙整表
計畫主持人:李曉青 計畫編號:99-2221-E-009-153- 計畫名稱:用系統工程方法設計強健生物 IC 電路--子計畫六:以定向演化達成合成途徑最佳化與驗 證強健系統設計理論 量化 成果項目 實際已達成 數(被接受 或已發表) 預期總達成 數(含實際已 達成數) 本計畫實 際貢獻百 分比 單位 備 註 ( 質 化 說 明:如 數 個 計 畫 共 同 成 果、成 果 列 為 該 期 刊 之 封 面 故 事 ... 等) 期刊論文 0 0 100% 研究報告/技術報告 0 0 100% 研討會論文 0 0 100% 篇 論文著作 專書 0 0 100% 申請中件數 0 0 100% 專利 已獲得件數 0 0 100% 件 件數 0 0 100% 件 技術移轉 權利金 0 0 100% 千元 碩士生 0 0 100% 博士生 0 0 100% 博士後研究員 0 0 100% 國內 參與計畫人力 (本國籍) 專任助理 0 0 100% 人次 國外 論文著作 期刊論文 2 2 100% 篇 1. Chen C. H., H. C. Lee, and B. S. Chen. 2011. Robust synthetic gene network design via library-based search method Bioinformatics 2011. 2. Lee H. C, and Chen B. S. 2010. Synthetic研究報告/技術報告 0 0 100% 研討會論文 1 1 100% Hsiao-Ching Lee, Pei-Chun Shih, Yao-Te Tsai, Bor-Sen Chen, and Ching-Ping Tseng. Identifying the interaction function between promoters and ribosome binding sites. 2010 August 2-4, The 2nd international conference on cellular and molecular bioengineering 專書 0 0 100% 章/本 申請中件數 0 0 100% 專利 已獲得件數 0 0 100% 件 件數 0 0 100% 件 技術移轉 權利金 0 0 100% 千元 碩士生 2 2 100% 博士生 0 0 100% 博士後研究員 0 0 100% 參與計畫人力 (外國籍) 專任助理 0 0 100% 人次 其他成果
(無法以量化表達之成
果如辦理學術活動、獲 得獎項、重要國際合 作、研究成果國際影響 力及其他協助產業技 術發展之具體效益事 項等,請以文字敘述填 列。) 國際競賽方面:2010 年指導交通大學生物科技學生團隊赴美參加 MIT 舉辦之國 際基因工程競賽,以【蚊子終結者】作品獲得銀牌獎,榮登交大首頁,獲得媒 體報導,為台灣爭光。 成果項目 量化 名稱或內容性質簡述 測驗工具(含質性與量性) 0 課程/模組 0 科 教 處舉辦之活動/競賽 0 研討會/工作坊 0 電子報、網站 0 畫 加 填 項 目 計畫成果推廣之參與(閱聽)人數 0