1
COMPARISON OF CHROMOSOMAL IMBALANCES
DETECTED BY COMPARATIVE GENOMIC
HYBRIDIZATION IN ARSENIC-INDUCED AND
NON-ARSENIC-INDUCED TRANSITIONAL CELL
CARCINOMA
Lin-I Hsu, Iuan-Horng Wang, Chi-Ling Chen, Yeong-Shiau Pu, Allen Wen-Hsiang Chiu, Chien-Jen Chen
National Taiwan University and National Yang-Ming University ABSTRACT
In order to compare the chromosomal imbalances between arsenic-induced and non-arsenic-induced TCC, we analyzed 24 arsenic-induced and 25 non-arsenic-induced TCC by comparative genomic hybridization. More arsenic-induced TCCs had at least one chromosomal imbalance (100%) than non-arsenic- induced TCCs (70%). The number of chromosomal imbalances (mean + standard error) was also significantly higher in the arsenic- induced TCCs (5.7+0.6) than non-arsenic-induced TCCs (2.9+0.5). Arsenic exposure is significantly associated with an increased number of chromosomal imbalances after adjustment for cigarette smoking and grade and stage of TCCs in the multiple linear regression analysis. We also found a significantly higher frequency of chromosome gains at 1p12-13, 3q24-25, 4q12-13, 7q112 and 8q22 in arsenic-induced TCCs than in non-arsenic-induced ones. In addition, the frequency of chromosome losses in 16p132-p133 and 17p13 was also significantly higher in arsenic-induced TCCs than non-arsenic-induced ones.
INTRODCUTION
We have reported the dose-response relationship between transitional cell carcinoma (TCC) and ingested arsenic among residents in
southwestern and northeastern arseniasis-endemic areas in Taiwan. The relative TCC risks were 1.9, 8.2 and 15.3 for those who drank well water with an arsenic concentration of 10.1-50.0, 50.1-100.0 and >100.0 μg/L, respectively, compared with those who drank well water with an arsenic concentration of <10 μg/L in the northeastern endemic area.
Inorganic arsenic has been reported to induce sister chromatid exchanges, chromosome abberations, micronuclei and aneuploidy in cultured cells. Genomic instatbility induced by inorganic arsenic may cause the development of various cancers.
2
imbalances between arsenic-induced and non-arsenic-induced TCCs by comparative genomic hybridization.
MATERIALS AND METHODS
Patients, Tumor Tissues and Risk Factors Exposure
Patients were recruited from Chi-Mei Hospital in Tainan County from 1998-1999. Specimens of transitional cell carcinomas were obtained from 49 patients affected with cancers of the urinary bladder, ureter, and renal pelvis. Grades and stages of the tumors were assessed according to World Health Organization and TNM classifications. Blood samples were also collected from TCC patients to derive reference DNA for CGH analysis.
The information on the exposures to ingested high-arsenic well water, cigarette smoking, and other risk factors was obtained from the
standardized interview based on a structured questionnaire. The TCCs were considered related to arsenic exposure from whom having lived in the arseniasis-endemic area and consumed high-arsenic artesian well water for more than 10 years. Other TCCs were classified as the non-arsenic-related.
DNA Preparation
Control genomic DNA samples were prepared from the blood of each patient using TALENT genomic DNA Extraction kit (TALENT, Triste, Italy). DNA was extracted from each TCC tissue using a QIAmp Blood Kits (QIAGEN).
CGH Analysis
Control and tumor DNA were labeled with Spectrum Red dUTP or Spectrum Green dUTP by the CGH nick translation kit (Vysis, Illinois, USA). The DNase and DNA polymerase I concentration in the labeling solution was adjusted to reveal an average fragment size of 300-3000bp. A total of 200 ng Spectrum Green-labeled probe, 100 ng of Spectrum Red-labeled probe, and 10 μg of the unlabeled Cot-1 DNA were precipitated with ethanol. The DNAs were dissolved in 10 μL hybridization buffer, denatured at 70C for 5 min and hybridized to denatured normal metaphase spreads.
The slides were washed after a 3 day hybridization. Chromosomes were counterstained with 4’,6-diamidino-2- phenylinodole (DAPI) in an antifading solution. The results were evaluated using a digital image analysis system based on a fluorescence microscope and charge-coupled camera (Photometrics, Tucson, Arizona, USA) interfaced to a Quips XL workstation. The mean green/red ratio of 1.5 and 0,75 was used as cut-off levels for gains and loses, respectively.
Statistical Analysis
3
analysis. P values <0.05 were considered statistically significant. RESULTS
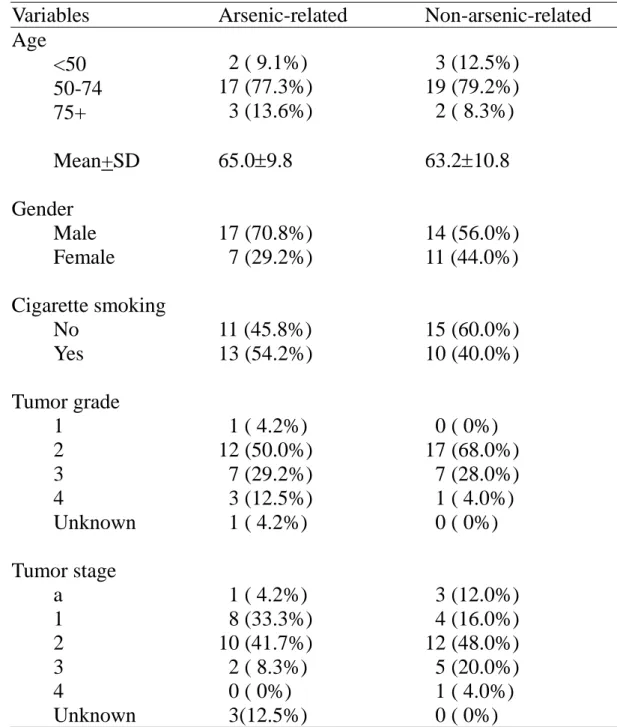
The mean age was similar in patients affected with arsenic-related and non-arsenic-related TCC. There were more males and cigarette smokers among arsenic-related TCC patients than non-arsenic- related TC
patients. Most arsenic-related and non-arsenic-related TCCs were at grade 2 and stage 2 (Table 1).
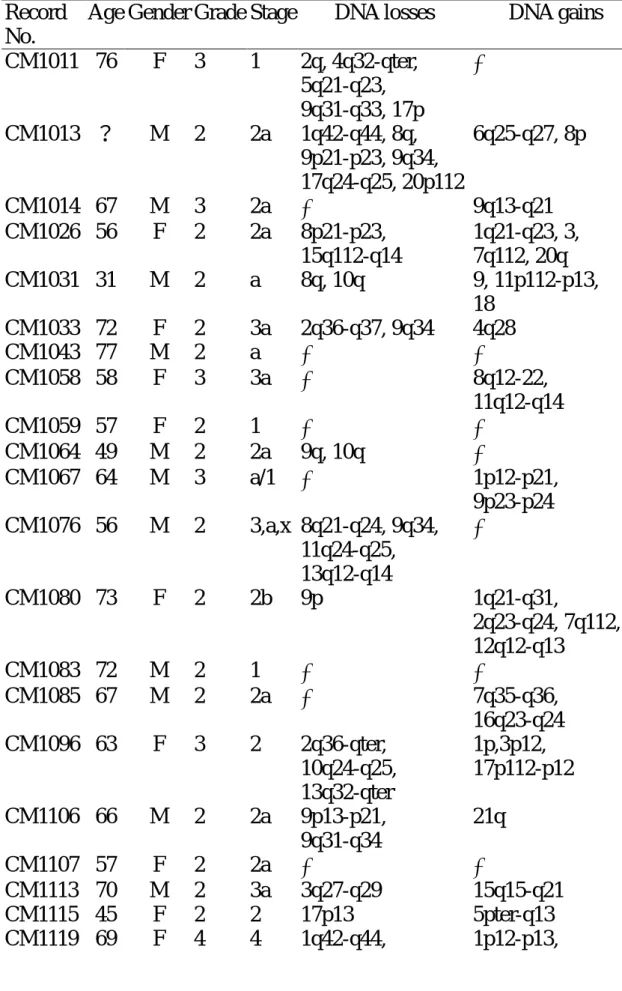
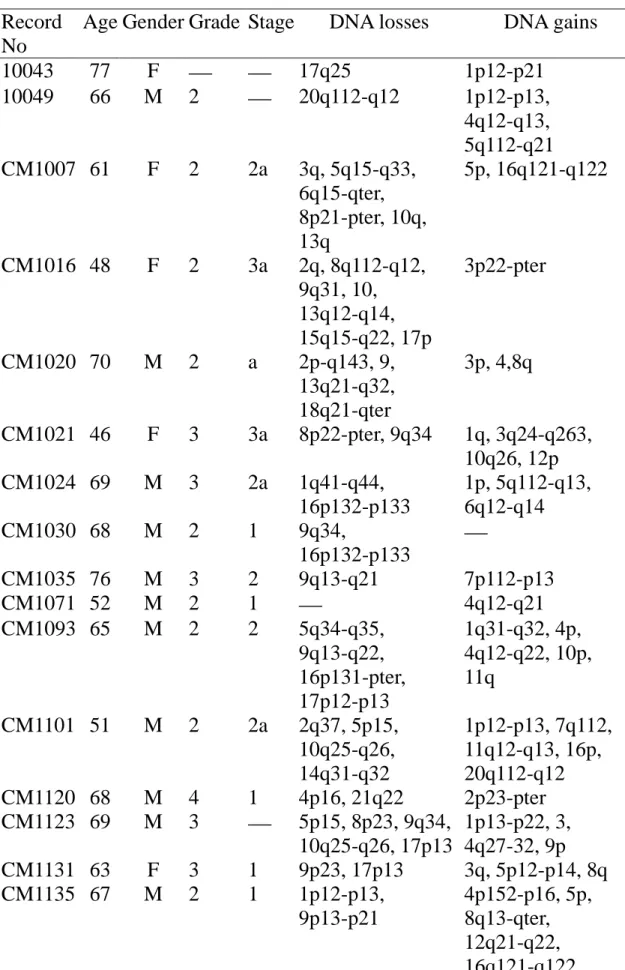
There were less DNA losses and gains in non-arsenic- related TCCs (Table 2) than in arsenic-related TCCs (Table 3). More arsenic- induced TCCs had at least one chromosomal imbalance (100%) than
non-arsenic- induced TCCs (70%). The number of chromosomal
imbalances (mean + standard error) was also significantly higher in the arsenic- induced TCCs (5.7+0.6) than non-arsenic-induced TCCs (2.9+0.5).
A significantly higher frequency of chromosome gains at 1p12-13, 3q24-25, 4q12-13, 7q112 and 8q22 in arsenic-induced TCCs than in non-arsenic-induced ones. In addition, the frequency of chromosome losses in 16p132-p133 and 17p13 was also significantly higher in arsenic-induced TCCs than non-arsenic-induced ones (Table 4).
Arsenic exposure is significantly associated with an increased number of chromosomal imbalances after adjustment for cigarette smoking and grade and stage of TCCs in the multiple linear regression analysis (Table 5).
4
Table 1. Demographical and histopathological characteristics of patients affected with arsenic-related and non-arsenic-related transitional cell carcinomas
Variables Arsenic-related Non-arsenic-related Age <50 50-74 75+ Mean+SD 2 ( 9.1%) 17 (77.3%) 3 (13.6%) 65.09.8 3 (12.5%) 19 (79.2%) 2 ( 8.3%) 63.210.8 Gender Male 17 (70.8%) 14 (56.0%) Female 7 (29.2%) 11 (44.0%) Cigarette smoking No 11 (45.8%) 15 (60.0%) Yes 13 (54.2%) 10 (40.0%) Tumor grade 1 1 ( 4.2%) 0 ( 0%) 2 12 (50.0%) 17 (68.0%) 3 7 (29.2%) 7 (28.0%) 4 3 (12.5%) 1 ( 4.0%) Unknown 1 ( 4.2%) 0 ( 0%) Tumor stage a 1 ( 4.2%) 3 (12.0%) 1 8 (33.3%) 4 (16.0%) 2 10 (41.7%) 12 (48.0%) 3 2 ( 8.3%) 5 (20.0%) 4 0 ( 0%) 1 ( 4.0%) Unknown 3(12.5%) 0 ( 0%)
5
Table 2. Age, gender, tumor stage and grade, DNA losses and gains of 25 patients affected with non-arsenic-related transitional cell carcinomas
Record No.
Age Gender Grade Stage DNA losses DNA gains CM1011 76 F 3 1 2q, 4q32-qter, 5q21-q23, 9q31-q33, 17p CM1013 ? M 2 2a 1q42-q44, 8q, 9p21-p23, 9q34, 17q24-q25, 20p112 6q25-q27, 8p CM1014 67 M 3 2a 9q13-q21 CM1026 56 F 2 2a 8p21-p23, 15q112-q14 1q21-q23, 3, 7q112, 20q CM1031 31 M 2 a 8q, 10q 9, 11p112-p13, 18 CM1033 72 F 2 3a 2q36-q37, 9q34 4q28 CM1043 77 M 2 a CM1058 58 F 3 3a 8q12-22, 11q12-q14 CM1059 57 F 2 1 CM1064 49 M 2 2a 9q, 10q CM1067 64 M 3 a/1 1p12-p21, 9p23-p24 CM1076 56 M 2 3,a,x 8q21-q24, 9q34, 11q24-q25, 13q12-q14 CM1080 73 F 2 2b 9p 1q21-q31, 2q23-q24, 7q112, 12q12-q13 CM1083 72 M 2 1 CM1085 67 M 2 2a 7q35-q36, 16q23-q24 CM1096 63 F 3 2 2q36-qter, 10q24-q25, 13q32-qter 1p,3p12, 17p112-p12 CM1106 66 M 2 2a 9p13-p21, 9q31-q34 21q CM1107 57 F 2 2a CM1113 70 M 2 3a 3q27-q29 15q15-q21 CM1115 45 F 2 2 17p13 5pter-q13 CM1119 69 F 4 4 1q42-q44, 1p12-p13,
6 9q32-qter, 10q22-q23, 21q22 5q112-q12 CM1134 71 M 3 2a CM1142 60 M 2 1 CM1143 70 F 3 3 CM1144 71 M 3 2b 1p21-p32, 3q 5q, 12p12-p13
7
Table 3. Age, gender, tumor stage and grade, DNA losses and gains of 24 patients affected with arsenic-related transitional cell carcinomas Record
No
Age Gender Grade Stage DNA losses DNA gains
10043 77 F 17q25 1p12-p21 10049 66 M 2 20q112-q12 1p12-p13, 4q12-q13, 5q112-q21 CM1007 61 F 2 2a 3q, 5q15-q33, 6q15-qter, 8p21-pter, 10q, 13q 5p, 16q121-q122 CM1016 48 F 2 3a 2q, 8q112-q12, 9q31, 10, 13q12-q14, 15q15-q22, 17p 3p22-pter CM1020 70 M 2 a 2p-q143, 9, 13q21-q32, 18q21-qter 3p, 4,8q CM1021 46 F 3 3a 8p22-pter, 9q34 1q, 3q24-q263, 10q26, 12p CM1024 69 M 3 2a 1q41-q44, 16p132-p133 1p, 5q112-q13, 6q12-q14 CM1030 68 M 2 1 9q34, 16p132-p133 CM1035 76 M 3 2 9q13-q21 7p112-p13 CM1071 52 M 2 1 4q12-q21 CM1093 65 M 2 2 5q34-q35, 9q13-q22, 16p131-pter, 17p12-p13 1q31-q32, 4p, 4q12-q22, 10p, 11q CM1101 51 M 2 2a 2q37, 5p15, 10q25-q26, 14q31-q32 1p12-p13, 7q112, 11q12-q13, 16p, 20q112-q12 CM1120 68 M 4 1 4p16, 21q22 2p23-pter CM1123 69 M 3 5p15, 8p23, 9q34, 10q25-q26, 17p13 1p13-p22, 3, 4q27-32, 9p CM1131 63 F 3 1 9p23, 17p13 3q, 5p12-p14, 8q CM1135 67 M 2 1 1p12-p13, 9p13-p21 4p152-p16, 5p, 8q13-qter, 12q21-q22, 16q121-q122
8 CM1139 72 F 1 1 10p15, 11p15 CM1153 72 M 2 2a 9p23-p24, 17p12-pter 1q21-q22, 7q112, 8q CM1154 79 M 3 2,2 9p, 10q26, 11p15, 16, 17p13 1p12-p31 CM1159 84 M poorly 16q24, 17p12-pter 1p12-p13, 4q12-q21 CM1160 59 M poorly 1 5q33-q35, 10q25-q26, 11p15, 16p131-pter, 17p13 3q133-q25, 7q112 CM1163 64 M 2 2 15q 1p12-p13, 5q112, 7q112 CM1169 69 F 3 2 9, 10q25-q26, 17p13 3q, 8q22-qter, 10p13-pter, 14q21-q23, 18pter-18q12 CM1191 57 M 2 2 16p13, 17p12-pter, 20q132-q133 4q26-q28, 7p, 7q112
9
Table 4. Frequent DNA losses and gains detected by CGH in arsenic- related and non-arsenic-related transitional cell carcinomas
Chromosome
Minimal overlapping
regions Arsenic-related Non-arsenic-relatedP-value (n=24) (n=25) DNA gains 1p 1p12-13 33.3% 12.0% 0.07 3q 3q24-25 20.8% 4.0% 0.10 4p 4p152-pter 12.5% 0% 0.11 4q 4q12-13 20.8% 0% 0.02 4q27-28 12.5% 4.0% 0.35 7q 7q112 20.8% 4.0% 0.10 8q 8q22 20.8% 4.0% 0.10 DNA losses 9p 9p23-24 25.0% 16.0% 0.50 9q 9q13-21 16.7% 4.0% 0.19 9q34 25.0% 24.0% 1.00 10q 10q26 29.2% 12.0% 0.17 11p 11p15 12.5% 0% 0.11 16p 16p132-p133 25.0% 0% 0.01 17p 17p13 41.7% 8.0% <0.01
10
Table 5. Linear regression analysis of the association with the number of DNA losses and gains for arsenic exposure, tumor stage, tumor grade and cigarette smoking
Variable (comparison) β Standard error P value Arsenic exposure(Yes vs. No) 3.39 0.84 <0.001 Tumor stage(2+ vs.1/a) 1.34 0.86 0.13 Tumor grade(3+ vs.1/2) -0.24 0.89 0.79 Cigarette smoking(Yes vs. No) 0.02 0.87 0.98
11
COMPARISON OF LOSS OF HETEROZYGOSITY ON
CHROMOSOMES 15 AND 16 IN ARSENIC-INDUCED AND
NON-ARSENIC-INDUCED TRANSITIONAL CELL
CARCINOMAS
Li-Hua Wang, Chia-Yen Chen, Cheng-Yeh Lee, Iuan-Horng Wang, Yu-Chin Cheng, Lin-I Hsu, Chi-Lin Chen, Yeong-Shiau Pu, Allen Wen-Hsiang Chiu, Chien-Jen Chen
12
ABSTRACT
Transitional cell carcinoma (TCC) has been documented to be associated with ingested arsenic among residents in southwestern and northeastern arseniasis-endemic areas in Taiwan. In order to compare the
chromosomal deletions between arsenic-induced and non-arsenic-induced TCCs, we analyzed 26 arsenic-induced and 28 non-arsenic-induced TCC by analysis of loss heterozygosity (LOH) on chromosome 15 and 16. More arsenic-induced TCCs had at least one LOH than
non-arsenic-induced TCCs. The number of LOH was also significantly higher in the arsenic-induced TCCs than non-arsenic-induced TCCs. A higher frequency of LOH was observed at D15S205, D15S994,
D16S3046, D16S3075, S16S515, D16S516 and D16S3091 in
arsenic-induced TCCs than in non-arsenic-induced ones. In addition, a higher frequency of LOH was observed at D15S1002, D16S3103 and D16S415 in non-arsenic-induced TCCs than in arsenic-induced ones.
13
MATERIALS AND METHODS Tumor and Normal DNA samples
TCCs were obtained by transurethral resection and stored at -80℃. Blood samples were obtained from patients to derive normal DNA samples. Peripheral blood was collected from each subject into an EDTA tube for the isolation of buffy coat and plasma, which were stored at -80 ℃ until analysis. DNA was extracted from buffy coat using a QIAmp Blood Kits (QIAGEN).
Polymerase Chain Reaction (PCR)-based Amplification of Microsatellite Markers
PCR reactions were performed in a total volume of 30 uL containing 50 ng of the extracted DNA, 50 mM potassium chloride, 10 mM Tris-HCl (pH=8.0), 5 mM magnesium chloride,.2.5 mM each dNTPs, 0.3 pmol primer of Linkage Mapping Set-MD10 kits (ABI, Prism), and 0.5 U Gold Taq. The DNA amplification was performed as follows; initial denaturatin at 94℃ for 5 min, followed by 35 cycles of denaturation at 94℃ for 40 s, annealing at 55℃ 30 s, with an extension at 72℃ 40s and a final
extension at 72℃ for 10 min. The PCR products were analyzed by electropheresis on a 2% agar gel stained with ethidium bromide.
Analysis of LOH
The LOH repeat region resides in the first exon of the gene. A system
was established to rapidly analyze the LOH repeat sequence length in a
large number of samples. We constructed a set of kits (ABI Prims,
Linkage Mapping Set-MD10). For rapid and accurate assessment of
14
polyacrylamide gel by automated fluorescence detection (Genescan;
Applied Biosystems 377).
RESULTS
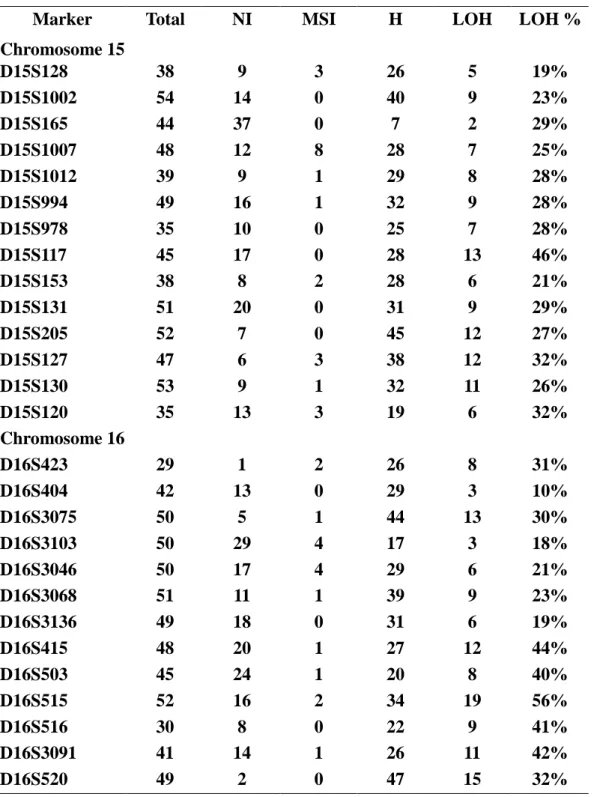
The frequency of LOH at chromosomes 15 and 16 in all 54 TCCs ranged 10% at D16S404 to 56% at D16S515 (Table 1). More arsenic-induced TCCs had at least one LOH than non-arsenic-induced TCCs. The number of LOH was also significantly higher in the arsenic-induced TCCs than non-arsenic-induced TCCs.
As shown in Tables 2 to 3 and Figures, a higher frequency of LOH was observed at D15S205, D15S994, D16S3046, D16S3075, S16S515, D16S516 and D16S3091 in arsenic- induced TCCs than in non-arsenic- induced ones. In addition, a higher frequency of LOH was observed at D15S1002, D16S3103 and D16S415 in non-arsenic-induced TCCs than in arsenic-induced ones.
15 Discussion
The findings of a high frequency (30% or higher) of LOH at chromosome 15 and 16 in TCCs are consistent with those reported in previous studies. More over, we also found a higher frequency of LOH in arsenic-induced TCCs than in non-arsenic- induced ones, especially at chromosome 16. The striking difference in LOH frequency was found to cluster at
D15S205(35%>17%) and D15S127(39%>25%) on chromosome 15, and D16S515 (75%>47%), D16S516 (60%>25%), D16S3091 (71%>36%) on chromosome 16. The markers D16S515、D16S516 and D16S3091 are in a region about 20cM, which indicate that there may be some gene
associated with the mechanism of arsenic-induced TCCs deserving further investigation.
16
Table 1. Frequency of LOH of genetic markers on chromosomes 15 and 16 in all transitional cell carcinomas
Marker Total NI MSI H LOH LOH %
Chromosome 15 D15S128 38 9 3 26 5 19% D15S1002 54 14 0 40 9 23% D15S165 44 37 0 7 2 29% D15S1007 48 12 8 28 7 25% D15S1012 39 9 1 29 8 28% D15S994 49 16 1 32 9 28% D15S978 35 10 0 25 7 28% D15S117 45 17 0 28 13 46% D15S153 38 8 2 28 6 21% D15S131 51 20 0 31 9 29% D15S205 52 7 0 45 12 27% D15S127 47 6 3 38 12 32% D15S130 53 9 1 32 11 26% D15S120 35 13 3 19 6 32% Chromosome 16 D16S423 29 1 2 26 8 31% D16S404 42 13 0 29 3 10% D16S3075 50 5 1 44 13 30% D16S3103 50 29 4 17 3 18% D16S3046 50 17 4 29 6 21% D16S3068 51 11 1 39 9 23% D16S3136 49 18 0 31 6 19% D16S415 48 20 1 27 12 44% D16S503 45 24 1 20 8 40% D16S515 52 16 2 34 19 56% D16S516 30 8 0 22 9 41% D16S3091 41 14 1 26 11 42% D16S520 49 2 0 47 15 32%
17
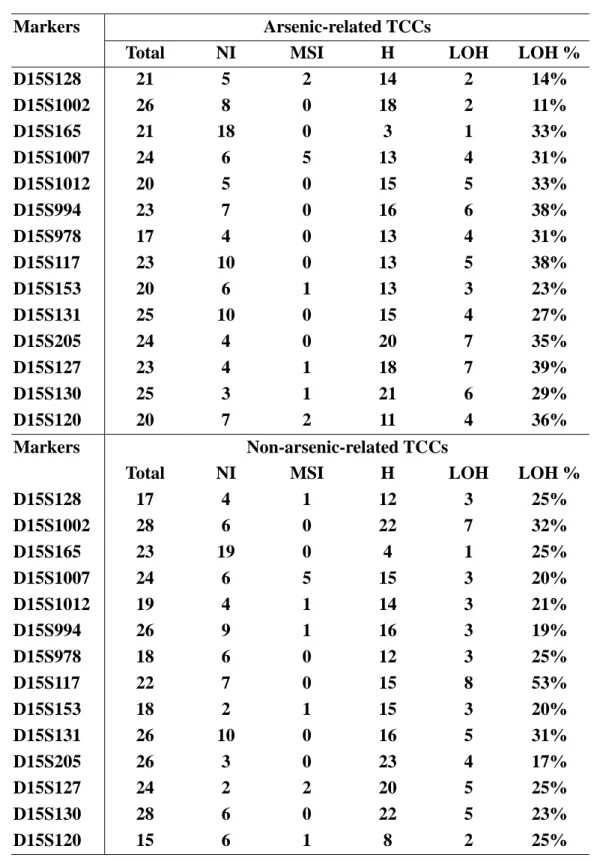
Table 2. Frequency of LOH of genetic markers on chromosomes 15 in arsenic-related and non-arsenic-related transitional cell carcinomas
Arsenic-related TCCs Markers
Total NI MSI H LOH LOH %
D15S128 21 5 2 14 2 14% D15S1002 26 8 0 18 2 11% D15S165 21 18 0 3 1 33% D15S1007 24 6 5 13 4 31% D15S1012 20 5 0 15 5 33% D15S994 23 7 0 16 6 38% D15S978 17 4 0 13 4 31% D15S117 23 10 0 13 5 38% D15S153 20 6 1 13 3 23% D15S131 25 10 0 15 4 27% D15S205 24 4 0 20 7 35% D15S127 23 4 1 18 7 39% D15S130 25 3 1 21 6 29% D15S120 20 7 2 11 4 36% Non-arsenic-related TCCs Markers
Total NI MSI H LOH LOH %
D15S128 17 4 1 12 3 25% D15S1002 28 6 0 22 7 32% D15S165 23 19 0 4 1 25% D15S1007 24 6 5 15 3 20% D15S1012 19 4 1 14 3 21% D15S994 26 9 1 16 3 19% D15S978 18 6 0 12 3 25% D15S117 22 7 0 15 8 53% D15S153 18 2 1 15 3 20% D15S131 26 10 0 16 5 31% D15S205 26 3 0 23 4 17% D15S127 24 2 2 20 5 25% D15S130 28 6 0 22 5 23% D15S120 15 6 1 8 2 25%
NI: non-informative; MSI: Microsatellite instatbility; H: heterozygosity
Table 3. Frequency of LOH of genetic markers on chromosomes 16 in arsenic-related and non-arsenic-related transitional cell carcinomas
18
Arsenic-related TCCs Markers
Total NI MSI H LOH LOH %
D16S423 10 1 1 8 3 38% D16S404 23 6 0 17 1 6% D16S3075 25 3 0 22 9 41% D16S3103 23 12 0 11 1 9% D16S3046 25 8 2 15 5 33% D16S3068 24 6 1 17 5 29% D16S3136 24 10 0 14 3 21% D16S415 23 11 1 11 3 27% D16S503 22 16 0 6 3 50% D16S515 26 10 2 14 10 71% D16S516 13 3 0 10 6 60% D16S3091 19 9 1 10 5 56% D16S520 23 1 0 22 9 41% Non-arsenic-related TCCs Markers
Total NI MSI H LOH LOH %
D16S423 19 0 1 18 5 28% D16S404 19 7 0 12 2 17% D16S3075 25 2 1 22 4 18% D16S3103 27 17 4 6 2 33% D16S3046 25 9 2 14 1 7% D16S3068 27 5 0 22 4 18% D16S3136 25 8 0 17 3 18% D16S415 25 9 0 16 9 56% D16S503 23 8 1 14 5 36% D16S515 26 6 0 20 9 45% D16S516 17 5 0 12 3 25% D16S3091 22 5 0 17 6 35% D16S520 26 1 0 25 9 36%
19 Chormosome 15 0% 10% 20% 30% 40% 50% 60% D 15 S12 8 D 15 S10 02 D 15 S16 5 D 15 S10 07 D 15 S10 12 D 15 S99 4 D 15 S97 8 D 15 S11 7 D 15 S15 3 D 15 S13 1 D 15 S20 5 D 15 S12 7 D 15 S13 0 D 15 S12 0 marker LOH% Arsenic Exposure Non-Arsenic Exposure
20 Chormosome 16 0% 10% 20% 30% 40% 50% 60% 70% 80% D 16 S42 3 D 16 S40 4 D 16 S30 75 D 16 S31 03 D 16 S30 46 D 16 S30 68 D 16 S31 36 D 16 S41 5 D 16 S50 3 D 16 S51 5 D 16 S51 6 D 16 S30 91 D 16 S52 0 marker LOH% Arsenic Exposure Non-Arsenic Exposure
21
COMPARISON OF MUTATION SPECTRA OF p53 GENE IN
ARSENIC-RELATED AND NON-ARSENIC-RELATED
TRANSITIONAL CELL CARCINOMAS
Wei-Liang Shih, Lin-I Hsu, Chi-Lin Chen, Chien-Jen Chen, Wen-Shiang Chiu, Yeong-Hsiao Pu
22
Abstract
The dose-response relationship between transitional cell carcinoma (TCC) and ingested arsenic has been observed in
arseniasis-endemic areas of southwestern and northeastern Taiwan. We carried out this study to compare the mutation spectra of p53 gene between arsenic-related and non-arsenic-related transitional cell carcinomas.
A total of 114 TCCs were collected from 114 affected patients in 1998-2000. The sequences of exons 5 to 8 of p53 gene were determined by polymerase chain reaction (PCR)-based direct DNA sequencing. The history of arsenic exposure through drinking well water, cigarette smoking, and exposures to other risk factors were obtained through standardized interview based on a structured questionnaire.
The p53 gene mutation was observed in 41 (36%) of 114 tumors. The higher the grade or stage of the tumor, the more frequent the p53 mutations. The mutation frequency was 44% for arsenic-related TCC and 30% for non-arsenic-related TCCs showing an odds ratio of 1.9 (95% confidence interval 0.8-4.9) after adjustment for age, gender, cigarette smoking, stage and grade. The longer the duration of consuming high-arsenic artesian well water, the higher the
mutation frequency (trend test P=0.07).
Most frequent mutation type was G:CA:T transition for both arsenic-related and non-arsenic-realted TCCs. The major mutation location were exons 8 (36%) and 6 (36%) for arsenic-related TCCs,
23
and exon 5 (34.8%) for non-arsenic-related TCCs. While only 9% of point mutations in arsenic-related TCCs were at CpG sites, 21% point mutations in non-arsenic-related TCCs were at CpG sites. The mutation hot spots were at codons 208, 280 and 285 for
arsenic-related TCCs; and at codons 179 and 273 for non-arsenic-related TCCs.
24
Materials and Methods
Patients, Tumor Tissues and Risk Factors Exposure
Specimens of transitional cell carcinomas were obtained from 114 patients affected with cancers of the urinary bladder, ureter, and renal pelvis from 1998 to 2000. Grades and stages of the tumors were assessed according to World Health Organization(1)and TNM (2)classifications. The information on the exposures to ingested high-arsenic well water, cigarette smoking, and other risk factors was obtained from the standardized interview based on a structured questionnaire.
Detection of p53 mutation: Direct Sequencing
Mutation of p53 gene from exons 5 to 8 was screened using
PCR-based direct DNA sequencing. Exons 5-8 of the p53 gene were individually amplified by PCR. All the PCR products were purified using Microcon-PCR Filter Unit (Millipore, U.S.A.), and then
directly sequenced using BigDyeTM Terminator Cycle Sequencing Ready Reaction Kits (Applied Biosystems). The sequencing
products were electrophoresed on 5﹪Long Ranger gel. The original data were analyzed by ABI prism DNA sequence analysis software (version 3.4.1). All PCR fragments were sequenced on both forward and reverse strands to exclude the possibility of
cross-contamination.
Statistical Analysis
All results were analyzed byχ2 tests or multiple logistic regression analysis.
25
26
Results
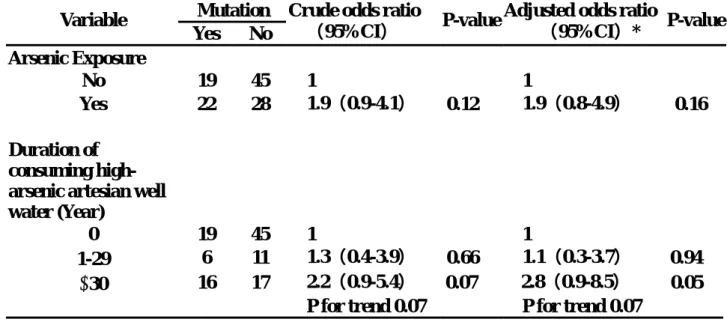
Arsenic exposure was associated with an increased p53 mutations in TCCs showing an OR of 1.9; and the longer the duration of
consuming high-arsenic artesian well water, the higher the p53 mutation frequency in TCCs (Table 1).
As shown in Table 2, the mean age of patients affected with
arsenic-related TCCs was older than those with non-arsenic-related TCCs. The frequency distributions of gender, cigarette smoking and cancer site were similar in both groups. The exposure to TCC
carcinogens was higher in arsenic-related TCC patients than
non-arsenic-related ones. The stage and grade of the arsenic- related TCCs were more advanced than non-arsenic-related TCCs.
The more advanced the grade and stage, the higher the p53
mutation frequency (Table 3). The OR of having p53 mutation was 3.7 for the grade 3 TCCs than the grade 1 and grade 2 TCCs. There was a significant trend of p53 mutation by stage (P=0.02) after adjustment for age and gender.
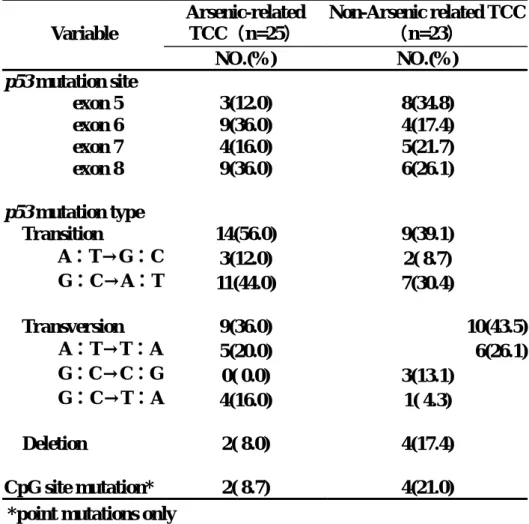
There was some difference in mutation site between arsenic-related and non-arsenic-related TCCs (Table 4). The frequent mutation sites were exons 6 and 8 for arsenic-related TCC, and exon 5 for non-arsenic-related TCCs. The majority of the mutation type was G:C→A:T transition for both types of TCC. There were less deletion mutations and CpG site mutations in the arsenic-related TCCs than non-arsenic-related TCCs.
Figure 1 shows the distribution of the mutation codons in the p53 of arsenic-related and non-arsenic-related TCCs. The most frequent mutation hot spots were codons 208, 280 and 285 in arsenic-related TCCs, and codons 179 and 273 in non-arsenic-related TCCs.
27
Table 1. p53 mutations in transitional cell carcinoma by exposure to arsenic through ingestion of artesian well water
Mutation Variable
Yes No
Crude odds ratio
(95%CI) P-value
Adjusted odds ratio
(95%CI)* P-value Arsenic Exposure No 19 45 1 1 Yes 22 28 1.9(0.9-4.1) 0.12 1.9(0.8-4.9) 0.16 Duration of consuming high- arsenic artesian well water (Year)
0 19 45 1 1
1-29 6 11 1.3(0.4-3.9) 0.66 1.1(0.3-3.7) 0.94
30 16 17 2.2(0.9-5.4) 0.07 2.8(0.9-8.5) 0.05
P for trend 0.07 P for trend 0.07
*Adjusted for stage, grade, cigarette smoking, gender and age.
28
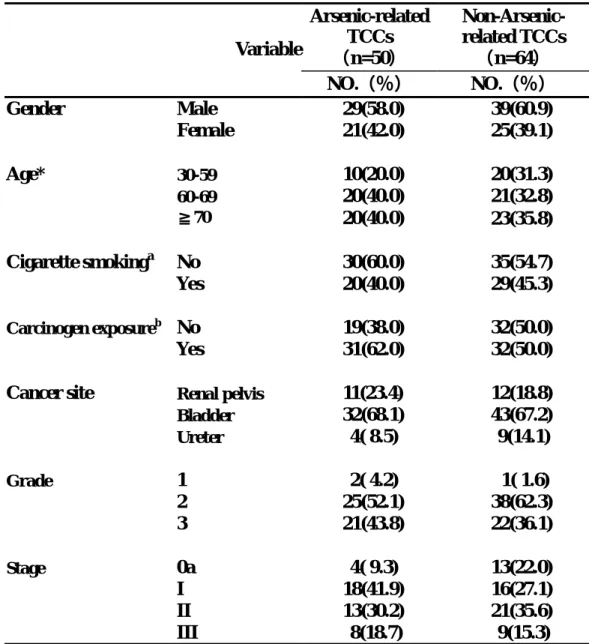
Table 2. Comparison of epidemiological and
pathological characteristics between arsenic-related and non-arsenic-related transitional cell carcinoma
Arsenic-related TCCs (n=50) Non-Arsenic- related TCCs (n=64) Variable NO.(%) NO.(%) Gender Male 29(58.0) 39(60.9) Female 21(42.0) 25(39.1) Age* 30-59 10(20.0) 20(31.3) 60-69 20(40.0) 21(32.8) ≧70 20(40.0) 23(35.8) Cigarette smokinga No 30(60.0) 35(54.7) Yes 20(40.0) 29(45.3) Carcinogen exposureb No 19(38.0) 32(50.0) Yes 31(62.0) 32(50.0)
Cancer site Renal pelvis 11(23.4) 12(18.8)
Bladder 32(68.1) 43(67.2) Ureter 4( 8.5) 9(14.1) Grade 1 2( 4.2) 1( 1.6) 2 25(52.1) 38(62.3) 3 21(43.8) 22(36.1) Stage 0a 4( 9.3) 13(22.0) I 18(41.9) 16(27.1) II 13(30.2) 21(35.6) III 8(18.7) 9(15.3)
*Mean age (± standard deviation) was 67.5±9.2 years for arsenic-related TCCs and 63.9±11.4 years for non-arsenic-related TCCs
a
Mean duration of cigarette smoking (± standard deviation) was 38.2±12.6 years
for arsenic-related TCCs and 37.7±14.6 years for non-arsenic-related TCCs b
History of exposures to hair dyes, paints, pesticides, analgesic, and/or anti-inflammatory drugs.
29
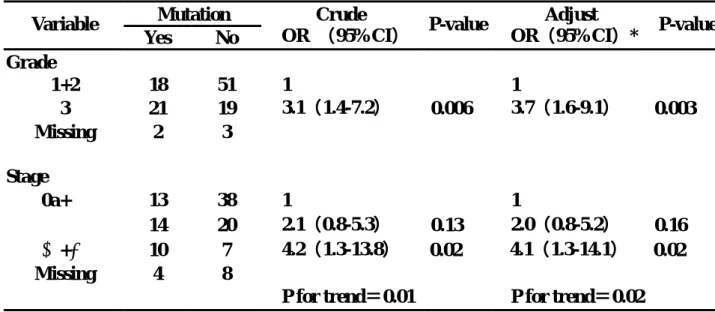
Table 3. Association between p53 mutation and stage and grade of transitional cell carcinoma
Mutation Variable Yes No Crude OR (95%CI) P-value Adjust OR(95%CI)* P-value Grade 1+2 18 51 1 1 3 21 19 3.1(1.4-7.2) 0.006 3.7(1.6-9.1) 0.003 Missing 2 3 Stage 0a+Ⅰ 13 38 1 1 Ⅱ 14 20 2.1(0.8-5.3) 0.13 2.0(0.8-5.2) 0.16 Ⅲ+Ⅳ 10 7 4.2(1.3-13.8) 0.02 4.1(1.3-14.1) 0.02 Missing 4 8
P for trend=0.01 P for trend=0.02
30
Table 4. Comparison of p53 mutation spectra between arsenic- related and non-arsenic-related transitional cell carcinoma Arsenic-related TCC(n=25) Non-Arsenic related TCC (n=23) Variable NO.(%) NO.(%) p53 mutation site exon 5 3(12.0) 8(34.8) exon 6 9(36.0) 4(17.4) exon 7 4(16.0) 5(21.7) exon 8 9(36.0) 6(26.1) p53 mutation type Transition 14(56.0) 9(39.1) A:T→G:C 3(12.0) 2( 8.7) G:C→A:T 11(44.0) 7(30.4) Transversion 9(36.0) 10(43.5) A:T→T:A 5(20.0) 6(26.1) G:C→C:G 0( 0.0) 3(13.1) G:C→T:A 4(16.0) 1( 4.3) Deletion 2( 8.0) 4(17.4) CpG site mutation* 2( 8.7) 4(21.0)
31
Mutated codons in p53 of arsenic-related transitional cell carcinoma(n=23)
280 285 208 0 1 2 3 126 156 186 216 246 276 306 Codon Number of Mutations
Mutated codons in p53 of non-arsenic-related transitional cell carcinoma(n=19)
273 179 0 1 2 3 126 156 186 216 246 276 306 Codon Number of Mutations
32
Figure 1. Distribution of mutation codons in p53 gene of
33
Conclusion
(1) Increased p53 mutation was associated with the tumor grade and stage.
(2) Arsenic-related and non-arsenic-related TCCs had different p53 mutation
location, frequency and hot spots.
(3) The lower mutation frequency of CpG sites suggested that the p53 mutation
in arsenic-related TCCs may not be associated with endogenous carcinogens.