302 Asia Pac J Clin Nutr 2008;17(S1):302-305
Original Article
Development of nutrient databases for epidemiological
studies in Taiwan
Li-Ching Lyu
MPH PhD, I-Chen Chi
BS, Chu-Kai Huang
BS, Liang-Li Huang
MS,
Wan-Jung Lee
BSand Hsin-Chin Lu
BSDepartment of Human Development and Family Studies, National Taiwan Normal University
The nutrient and related databases are essential for calculating intake values in epidemiological studies. To suit our research needs, we have developed an integrated management system not only for processing individual dietary questionnaires including 24-hour recalls, food records and Chinese food frequency questionnaires (CFFQ), but also for maintaining and tracking updated food composi-tion databases. The recall and record calculacomposi-tion system (Normal University Food and Nutrient Calculation System: NUCAL system) considers date of recall/record, number of days and meal separations. The CFFQ editing system (CFFQES system) contains the management of food list, and frequency and portion size selections to facilitate processing the various versions of CFFQ. Since the extension of many bioactive compounds including polyphenols, pollutants and carcinogens in foods and water is considered by epidemiological hypotheses, limitation of current food composi-tion tables needs to be noticed and improved. Laboratory analyses are the foundacomposi-tion of food data-bases, more resources and efforts are urgently needed for analysing the local food items. In practi-cal uses of efficient data processing procedures, the multiple grouping and nomenclature systems need further attention in the future. Nutrient databases need multidisciplinary efforts and play the key role for the success of epidemiological studies.
Key Words: nutrient databases, food frequency questionnaire, 24-hour recalls, epidemiological study, Taiwan
INTRODUCTION
Nutrition epidemiology is the study of the nutritional deter-minants of disease and/or condition in human populations. The calculations of interested dietary components consisting of nutrients and non-nutrients require food composition data to process the various forms of dietary assessment tools, including food records, 24-hour recalls and food frequency questionnaires (FFQ) with and without portion size choices. 1,2 Since 1998, we have developed an integrated database management system named NUFOOD system (Normal University food databank management system)3 to suit our research agenda, for example, to process FFQ with choices of three portion sizes for case-control study4 and family diet study5, to process FFQ without portion sizes and food re-cords during pregnancy, to process 24-hour recalls for in-fants and toddlers.
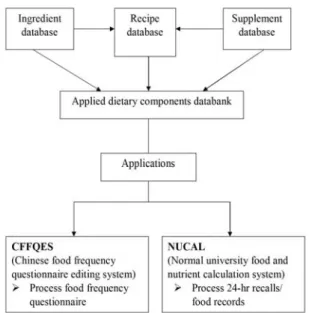
Figure 1 shows the main structure of the NUFOOD sys-tem. The basic nutrient database structures consist of three major databases: first, the ingredient database with 5 digit food codes; second, the recipe database with a 6 digit code; and the third, the supplement database with a 7 digit code. The recipe management system also provides inter-reactive calculation functions by utilizing food code data from all three databases. All three databases can be output into applied dietary component databank, then the applications including the Chinese food frequency questionnaire editing system (CFFQES) to process various forms of food fre-quency questionnaires, the Normal University food and nutrient calculation system (NUCAL) to process 24-hr
recalls and food records.
Corresponding Author: Prof Li-Ching Lyu, #162, Section 1,
Hoping East Road, Taipei, Taiwan 10610. Tel: + 886-2-23648850; Fax: + 886-2-23648850 Email: [email protected]
Manuscript received 9 September 2007. Accepted 3 December 2007.
Figure 1. Normal University food system (NUFOOD databank
LC Lyu, IC Chi, CK Huang, LL Huang, WJ Lee and HC Lu 303
METHODS
We first used Microsoft Access 97 and Visual Basic 6.0 to develop graphic user interface (GUI). Since 2004, we have used Microsoft Access 2000 and Delphi 7 to develop the system. The concept of the three databases for NUFOOD design is client/server, also called a 2-tier database. This system is accessed by the other two subsystems of NUCAL and CFFQES.
The NUCAL system is mainly responsible for calculat-ing the analyscalculat-ing of the nutrients in daily diet. The system was implemented with the concept of object-oriented analysis and design. The CFFQES is responsible for pro-ducing, editing and calculating the different versions of FFQ. Through the use of data mining, we developed FFQ to understand and analyse the complex relationships be-tween various dietary components and human health.
RESULTS
Food grouping system
Table 1 shows the food groups in the three major databases. Currently the ingredient database contains 13 food groups with 558 items, the recipe database has 30 subgroups with 397 items and the supplement database has 6 subgroups with 682 items. Since ingredient database serves as the basic database for establishment of recipes, the nutrient profiles in the ingredient database need to be as complete as possible in order to avoid underestimation for the nutri-ent intakes due to missing values.6 To facilitate the up-dates and adding new dietary components, we selected food items into the ingredient database with consideration of commonly consumed, high values for specific nutrients and research interests1, the main source was from Taiwan food composition table.7
The recipe database management system could utilize food codes from all three data categories and calculate the values per 100 gram. Because most ingredients only have nutrient data from an uncooked state, we referenced local reports8 and The United State Department of Agriculture (USDA) websites, and summarized 13 cooking methods for 18 nutrients to calibrate nutrient loss during cooking. For cooking factors of moisture loss or gain, fat loss or gain, we use expertise judgements to adjust the input val-ues. We estimated and adjusted the recipes based on in-gredient portions and set up the 10% variation for macro nutrients between calculated values and labelling and/or analytical values.
The supplement database has the sample database structure as the ingredient database. The six categories were the Western single formula such as vitamin E, the Western multi formula such as multi vitamin and mineral supplements, the other Western formula contains most so-called health food supplements. The Chinese herb single and Chinese herb multi formula categories were designed to collect traditional herb composition. This database cur-rently collected 682 items; however, except the items with labelled information most supplements, most contents for nutrients remained to be blank.
Data quality control
To assure data accuracy and track the data changes, we have conducted various quality control procedures. Prior to every data entry, manual pen and paper documents are
discussed and filed. References for each food item, also data sources for each dietary component were compared, discussed and documented. Our main data sources were the official publications of the Taiwan food composition table.7 However, because the fatty acids were published by relative values to the total fatty acids measured by gas chromatography (GC),7 We have estimated and re-calculated the fatty acid contents per 100 gram unit. Moreover, the carbohydrate contents were calculated from dry weight minus ash, fat and protein; therefore, after considering the dietary fiber and crude fiber values, we have created “calculated starch” as a new dietary component.
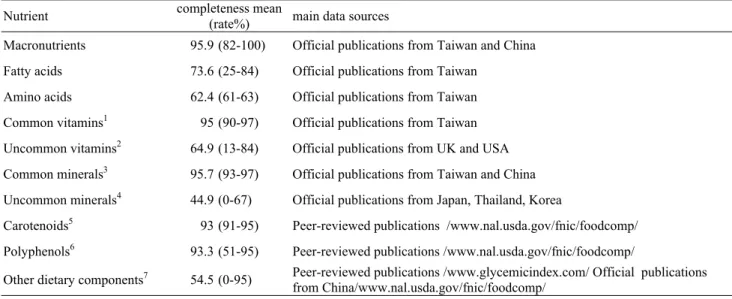
The routine automatic quality control procedure was designed to check nutrient ranges and missing values. The completeness for each dietary component was checked and documented periodically. For example, our completeness rates for most macronutrients and common vitamins and minerals were over 95% (see Table 2). In addition, we conducted manual quality control procedures periodically. For example, we exported variables for wa-ter, complex carbohydrate, protein, fat and ash to excel files, and added the total for the 5 variables to screen the extreme values less than 90 grams or over 110 grams. Due to the complexity of food composition data, various ways to assure data quality are needed.
Many new dietary components have been analysed and published by governments and peer-reviewed journals in-ternationally. For our research needs, we have developed various imputing procedures for various uncommon nutri-ents which are not analysed from local laboratories. For example, we have developed imputation rules and added various phytochemicals, including carotenoids, polyphe-nols and caffeine in 2004. The main data sources were
Table 1. Food groups in ingredient, recipe and
sup-plement databases NUFOOD databank category Food groups Ingredient
Cereals and tubers, beans and nuts, fats and oils, meat products, egg products, dairy products, fishes and seafood, vege-table products, fruit products, special for-mula, condiments, liquors and wines, miscellaneous foods
Recipe
Rice dish, wheat dish, western dish, poul-try dish, meat dish, raw seafood dish, cooked seafood dish, raw vegetable dish, cooked vegetable dish, soy dish, egg dish, vegetable/meat dish, vegetable/seafood dish, other mixed dish, soups, condiments, sauces, ice deserts, Chinese deserts, West-ern deserts, dried and preserved fruits, cookies, candies, other snacks, carbonated beverages, dairy beverages, soy beverages, fruit juices, alcoholic beverages, other beverages
Supplement
Western single formula, Western multi formula, other western formula, Chinese herb single formula, Chinese herb multi formula, miscellaneous supplements
304 Nutrient databases development
from USDA and peer-reviewed publications.
To date, we have collected a total number of 200 dietary components, including basic and rare nutrients, purine, amino acids, fatty acids, trace minerals, isofavonoids, fla-vonoids, carotenoids, glycemic index and glycemic load. Table 2 summaries the main data sources and the means and percentages of completeness for major food composi-tion categories. Because of the similarity and export/import of food items within Asian nations, our main data sources besides Taiwan are China, Japan, Thailand and Korea. Process dietary assessment tools
We have two main applications consisting of CFFQES to process FFQ and NUCAL to process food recalls and records. We have developed various study-specific food frequency questionnaires to suit our research agenda. For example, we have used three food frequency question-naires for children between 9 to 12 month monthly and at 2 and 2.5 years old for complementary and table food items. Therefore the CFFQES system was designed to edit the numbers and proportions of food items under each food list with flexibility. Our concept was to de-velop a template questionnaire with computed food com-position data for each study and process collected ques-tionnaires by a particular template. For example, we have developed the FFQ without portion sizes for pregnancy. The template includes 208 food lists with a new computed food composition table for 208 foods.
Within each food list, we could select 1 to 6 food items and assign the proportion of each food item for computing the new food composition per 100 gram accordingly. For example, the food list for tofu consists of three food items of soya tofu, spicy tofu and cold tofu; the assigned pro-portions for each item are 60%, 20% and 20%, respec-tively. For the frequency category, we have used eight choices for our FFQ. The choices are never, once per month, 2-3 times per month, once per week, 2-3 times per
week, 4-6 times per week, once a day, more than once a day. The portion size choices are small, medium and large. For the case of FFQ without portion sizes for pregnancy, we only set a template with medium portion size input for processing the filled questionnaires.
The NUCAL system was designed to process 24-hr recalls and/or food records. Besides identification of the subjects, we have used the dates of the diets and collec-tive methods to manage data entry. Both food codes and food name could be entered and searched from the data-bank, the source and the weight of the food items have to be entered. Since we have updated the NUFOOD data-bank periodically, the coding manual for pre-processing the food recalls and records needs to be updated accord-ingly. In addition, we have decided to use a meal-based concept to collect our dietary information, therefore the CFFQ and NUCAL applications were pre-designed ac-cordingly. Moreover, both NUCAL and CFFQES systems could be used to re-calculate the input questionnaires when we updated the related food composition databank.
DISCUSSION
We have developed and improved this integrated system for analysing nutritional epidemiological studies for more than 10 years in Taiwan. However, to date we still have little published information on nutrient contents of cooked food items with various cooking methods. Moreover, analytical data on highly consumed local pickled vegeta-bles, dried fruits, cured meats, and herb extracts are rare. Manufactory formula for processed foods and household recipes with high variation are also difficult tasks to vali-date the calculated values versus analytical values. Since many dietary non-nutrient bioactive components such as polyphenols, food additives, as well as the extension of many pollutants and carcinogens in foods and water considered by epidemiological hypotheses, the limitation of current food composition tables needs to be understood
Table 2. Nutrient completeness and main data sources
Nutrient completeness mean (rate%) main data sources
Macronutrients 95.9 (82-100) Official publications from Taiwan and China Fatty acids 73.6 (25-84) Official publications from Taiwan
Amino acids 62.4 (61-63) Official publications from Taiwan Common vitamins1 95 (90-97) Official publications from Taiwan
Uncommon vitamins2 64.9 (13-84) Official publications from UK and USA
Common minerals3 95.7 (93-97) Official publications from Taiwan and China
Uncommon minerals4 44.9 (0-67) Official publications from Japan, Thailand, Korea
Carotenoids5 93 (91-95) Peer-reviewed publications /www.nal.usda.gov/fnic/foodcomp/
Polyphenols6 93.3 (51-95) Peer-reviewed publications /www.nal.usda.gov/fnic/foodcomp/
Other dietary components7 54.5 (0-95) Peer-reviewed publications /www.glycemicindex.com/ Official publications
from China/www.nal.usda.gov/fnic/foodcomp/
1. Common vitamins (Taiwan): vitamin A, vitamin E, thiamin, riboflavin, niacin, vitaminB6, vitaminB12, vitamin C. 2. Uncommon vitamins
(Taiwan): vitamin D, vitamin K. folate, biotin, etc. 3. Common minerals (Taiwan): sodium, potassium, calcium, magnesium., phosphorus, iron., zinc. 4. Uncommon minerals (Taiwan): sulfur, iodine, chlorine, selenium, aluminum, cadmium., etc. 5. Carotenoids: α-carotene, β-carotene, β-cryptoxanthin, lycopene, zeaxanthine, lutein. 6. Polyphenols: isoflavone, counestan, lignan, flavonols, flavones, flavanones, antho-cyanidins, etc. 7. Other dietary components: caffeine, purine, added sugar, glycemic index, etc.
LC Lyu, IC Chi, CK Huang, LL Huang, WJ Lee and HC Lu 305 and discussed by the public health community in Taiwan.
Moreover the knowledge of bioavailability of these die-tary bioactive compounds is also needed to help us to understand the potential health or hazard effects of these dietary non-traditional components.9,10
For decades, dietary supplements provided additional consumptions of many bioactive compounds that have been noticed and documented by the scientific nutrition community. However, calculation of the dietary content of bioactive components including common vitamins and minerals, also non-nutrient bioactive compounds from supplements has been an extremely difficult task. Many intentions have been noticed to improve the quality sci-ence in dietary supplement research. Building up a sensi-ble and easy-to-track dietary supplements database is needed to suit the rapid changes of the formulas in the consumer market.11-13
Collecting and processing dietary assessment informa-tion has been very time consuming and labour intensive in epidemiological studies.1,2,14,15 More rapid and cost-effective methods are needed not only for data collection, but also for data analysis.16 In practical uses of efficient data processing procedures, the multiple grouping and nomenclature systems, and also the portion size estima-tion need further attenestima-tion in both computer and/or man-ual coding procedure. Even though the advanced com-puter technology has been available, much basic cognitive related research for ability to estimate what, how and how much food consumed by individuals need to be further explored and examined. 16
Nutrient databases and related applications need mul-tidisciplinary efforts and play the key role for the success of epidemiological studies and further nutrition policy making. Laboratory analyses are the foundation of food databases, more resources and efforts are urgently needed for analysing the local food items. Due to the active im-port/export food trades among Asian countries, interna-tional cooperation for analytical data is needed to spare limited resources from scientific research funding. It can not be said more for the importance of continuous efforts for fundamental nutrient database research.
ACKNOWLEDGMENT
This system has been sponsored by grants (88WFA0300066, 88WFA0300265, 89WFA0300290) from National Science Council (NSC) in Taiwan.
AUTHOR DECLARATIONS
The authors including Li-Ching Lyu, I-Chen Chi, Chu-Kai Huang, Liang-Li Huang, Wan-Jung Lee, Hsin-Chin Lu have no conflict of interests.
REFERENCES
1. Willett WC. Buzzard IM. Foods and Nutrients. In: Willett WC. Nutritional epidemiology. Oxford: Oxford University Press, 1998. p.18-32.
2. West CE, van Staveren WA. Food consumption, nutrient intake, and the use of food composition tables. In: Margetts BM, Nelson M. Design concepts in nutritional epidemiol-ogy. Oxford University Press, 1997. p.107-122.
3. Lyu L-C, Ho J-Y, Chang F-H, Hsu I-L. An integrated data-base management system for Taiwanese Food composition and related dietary assessment database: the NUFOOD
sys-tem. Nutr Sci J. 2001;26:268-76.
4. Lyu L-C, Hsu C-Y, Yeh C-Y, Lee M-S, Huang S-H, Chen C-L. A case-control study of the association of diet and obe-sity with gout in Taiwan. Am J Clin Nutr. 2003;78:690-701. 5. Lyu L-C, Huang S-H, Hsu C-Y, Lee M-S, Lin S-H.
Inter-relationships of nutrient intakes for urban Chinese Spouses in Taiwan. Int J Food Sci & Nutr. 2004;55:227-36.
6. Schakel SF, Sievert YA, Buzzard IM. Sources of data for developing and maintaining a nutrient database. J Am Diet Assoc. 1988;88:1268-71.
7. Taiwan food composition table. 1998. Publication from Department of Health, Executive Yuan, Taiwan.
8. Retention factor for nutrients in preparation of foods com-monly used in Taiwan. 1996. Report from Department of Health, Executive Yuan, Taiwan.
9. Kris-Etherton PM, Lefevre M, Beecher GR, Gross MD, Keen CL, Etherton TD. Bioactive compounds in nutrition and health-research methodologies for establishing biologi-cal function: The antioxidant and anti-inflammatory effects of flavonoids on atherosclerosis. Annu Rev Nutr. 2004;24: 511-38.
10. Manach C, Scalbert A, Morand C, Remesy C, Jimenez L. Polyphenols: food sources and bioavailability. Am J Clin Nutr. 2004;79:727-47.
11. Dwyer J, Picciano MF, Raiten DJ. Food and dietary supple-ment databases for what we eat in America-NHANES. J Nutr. 2003;133:624S-34S.
12. Haggans CJ, Regan KS, Brown LM, Wang C, Drebs-Smith J, Coates PM, Swanson CA. Computer access to research on dietary supplements: a database of federally funded dietary supplement research. J Nutr. 2005;135:1796-9.
13. Castello RB, Coates P. In the midst of confusion lies oppor-tunity: fostering quality science in dietary supplement re-search. J Am Coll Nutr. 2001;20:21-5.
14. Gulland JC, Aubert R, Lhuissier M, Peres G, MOntagnon B, Fuchs F, Merlete N, Astorg PO. Computerized analysis of food records: role of coding and food composition database. Eur J Clin Nutr. 1993;47:445-53.
15. Perloff BP, Rizek RL, Haytowitz DB, Ried PR. Dietary intake methodology. II. USDA’s nutrient data base for na-tionwide dietary intake surveys. J Nutr. 1990;120:1530-4. 16. Buzzard IM, Sievert YA. Research priorities and
recom-mendations for dietary assessment methodology. Am J Clin Nutr. 1994;59:275S-80S.