The coupling of bacterial production and
hydrography in the southern East China Sea:
Spatial patterns in spring and fall
Fuh-Kwo Shiah
!,*, Kon-Kee Liu!, Shuh-Ji Kao!,
Gwo-Ching Gong
"
!Institute of Oceanography, National Taiwan University, P.O. Box 23-13, Taipei, Taiwan, ROC "Department of Oceanography, National Taiwan Ocean University, Keelung, Taiwan, ROC
Abstract
Heterotrophic bacterial biomass, production and turnover rates were investigated in a tran-sect across the continental shelf of the southern East China Sea during spring and fall. The sampling area covered di!erent water types including nutrient-rich coastal and upwelling waters as well as oligotrophic Kuroshio waters. On area basis, bacterial biomass (IBB; 350}1200 mgC m~2), production (IBP; 28}329 mgC m~2 d~1) and averaged turnover rates (l"IBP/IBB; 0.09}0.22 d~1) in the coastal and upwelling areas were at least 2-fold of those in the Kuroshio waters. IBB, IBP andl were positively correlated with primary production (IPP; 90}2133 mgC m~2 d~1) and particulate organic carbon (IPOC; 1415}4682 mgC m~2) but showed a negative trend with temperature in the outer shelf area. While in the inner shelf ((203C), IBP andl were positively correlated with temperature; the Q10 value for bacterial l was 3.12. These indicated that the spatial patterns of IBB, IBP and l were more likely to be controlled by substrate supply and temperature interactively. Values of IBP : IPP ratio ranged 6}42% with an average of 22$10%. Under the assumption of a growth e$ciency of 20%, shelf bacteria might consume carbon equivalent to almost 100% of the in situ daily particulate IPP. Dissolved organic carbon from non-phytoplankton and allochothonous sources might play a signi"cant role in supporting bacterial carbon demand in the shelf area of the East China Sea. ( 2000 Elsevier Science Ltd. All rights reserved.
Keywords: Bacterioplankton; Continental shelf; KEEP; Kuroshio; POC; Q10
* Corresponding author. Tel.: 011-886-2-2364-0919; fax: 011-886-2-2364-0919. E-mail address: [email protected] (F.-K. Shiah)
0278-4343/00/$ - see front matter ( 2000 Elsevier Science Ltd. All rights reserved. PII: S 0 2 7 8 - 4 3 4 3 ( 9 9 ) 0 0 0 8 1 - 3
1. Introduction
Heterotrophic bacterioplankton (bacteria) are currently believed to be important agents of carbon cycling in aquatic ecosystem, since they are the major (or perhaps the only) organisms responsible for the consumption of biogenic organic carbon (see Ducklow and Carlson, 1992; Fuhrman, 1992 for review). Several studies have sugges-ted that many biological systems are probably the net source of CO2 due to bacterial activities (Findlay et al., 1991; Smith and Hollibaugh, 1993; del Giorgio et al., 1997). Bacterial production have been investigated in many parts of the world oceans, but such data in the shelf area of the western Paci"c, particularly the East China sea, are rarely available until recently.
Although, on area basis, the continental shelves constitute about 10% of the world oceans (Liu et al., 1998), these ecosystems could be very important in a!ecting global carbon cycling due to large standing stocks of particulate organic carbon (POC) and high rates of primary production (PP). The East China Sea (ECS) has one of the largest shelves in the world. Four di!erent water types have been identi"ed that a!ect the hydrography of the southern part of the ECS. They are the China Coastal Waters (the CCW), the oligotrophic Taiwan Strait Waters (the TSW), the upwelled Kuroshio Subsurface Waters (the KSW) and the oligotrophic Kuroshio Waters (the KW). In this area there are two major inorganic nutrient sources: one from river discharges on the east coast of Mainland China and the other from the Kuroshio upwelling occurs at the shelf break north-east of Taiwan (Gong et al., 1996). High rates of PP and concentrations of POC in the CCW and the KSW have been reported (Liu et al., 1995; Shiah et al., 1996; Gong et al., this issue). It is believed that the complicated hydrography caused by the interactions of di!erent water types in the shelf area might ultimately a!ect the spatial patterns of PP, POC and thus bacterial activities.
The major purpose of this study was to understand spatial variability of bacterial biomass, production and turnover rates in the shelf area of the southern ECS in spring and autumn seasons. Their relationships with PP, POC and hydrographic data were analyzed to explore possible controlling mechanisms. Bacterial carbon #uxes and their potential roles in carbon cycling in the ECS shelf were also discussed at the end of this report.
2. Materials and methods
2.1. Study area and sampling
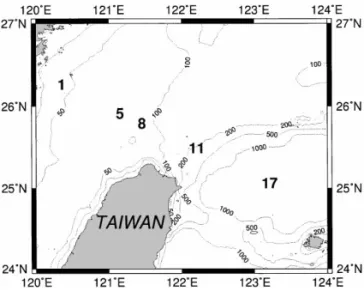
This study was performed at the "ve stations along a transect across the shelf of the southern East China Sea north of Taiwan (Fig. 1). A total of four cruises were conducted during either spring or autumn season; they were Cruises 386 (May 1994), 405 (Nov 1994), 414 (Mar 1995) and 449 (Apr 1996). Seawater was collected from a SeaBird CTD-General Oceanic Rosette assembly with 20 l Go-Flo bottles. Light intensity was measured with a PAR sensor (QSP200L; Biospherical Inc.) and the depth of the euphotic-zone was de"ned as 1% of the surface light penetrated. All
Fig. 1. Map of the southern East China Sea showing sampling stations. Values on dashed lines indicate bottom depth in meter.
measurements described below were conducted before dawn with samples taken from the same cast.
2.2. Primary productivity
Primary production was measured by the14C assimilation method (Parsons et al., 1984). In brief, three light and one dark 250 ml clean polycarbonate bottles were "lled with water which pre-screened through 200lm mesh to remove large zooplankton and detritus and then inoculated with H14CO~3 ("nal conc., 10lCi ml~1). One light bottle was "ltered immediately as the time-zero sample. Incubation was performed by in situ method proposed by Barber (1993) with some modi"cations. Two light and one dark bottles for each depth were in turn tethered onto the in situ array. The array with a 50 kg sinker attached at the bottom, was lowered down to the water column such that the samples would be situated at their original depth. A 50 m tag line connected to the top of the array was tied to the stern of the research vessel.
Following retrieval at dusk, the bottles were stored in the dark and processed immediately. The water samples were "ltered through Whatman 25 mm GF/F "lters with pumping pressure (100 mmHg. The "lters then were placed in scintillation vials and 0.5 ml of 0.5 N HCl was added to remove residual H14CO~
3. Radioactivity was counted in a liquid scintillation counter (Packard 1600) after addition of 10 ml scintillation cocktail (Ultima Gold, Packard) into vials.
2.3. Particulate organic carbon
Water samples (0.5&2.0 l) for particulate organic carbon (POC) measurement were "ltered through 200lm mesh to remove zooplankton and then Whatman
25 mm GF/F "lters. After "ltration, samples were wrapped in aluminium foil and stored at 43C. Both "lters and aluminium foil were pre-combusted at 5503C for 1 h before "ltration processes. POC concentrations were measured by CHN analyzer (Fisons; NA1500) after samples were dried and acid-fumed.
2.4. Bacterial abundance and production
Bacterial abundance was determined by using the acridine orange direct count method (Hobbie et al., 1977). Samples "xed with glutaraldehyde ("nal conc., 1%) were stained with acridine orange ("nal conc., 0.01%) and then "ltered through 0.2lm polycarbonate "lters prestained with Irgalan black solution. Slides were enumerated by epi#uorescence microscopy (Zeiss, Axioplan). Biomass was calculated with a car-bon conversion factor of 2]10~14 g cell~1. Bacterial production was estimated by 3H-thymidine (Fuhrman and Azam, 1982) incorporation with a conversion factor of 1.18]1018 cells mol thymidine~1. Triplicates 40 ml aliquots of water samples were incubated with3H-[methyl]-thymidine (Sp. activity., 6.7 Ci/mmol;"nal conc., 20 nM) in clean polycarbonate tubes in the dark at in situ temperature. Reaction was stopped by adding formaldehyde ("nal conc., 1%). The killed samples including time zero controls were "ltered through 0.2lm cellulose nitrate"lters. Filters were rinsed three times each with ice-cold 5% trichloroacetic acid and ice-cold 80% ethyl alcohol sequentially. Scintillation cocktail (6 ml; Ultima Gold, Packard) was added after dried "lters were dissolved completely in 0.5 ml of ethyl acetate. Radioactivity was deter-mined by liquid scintillation (Packard 1600). Bacterial turnover rates were calculated by dividing bacterial production by bacterial biomass.
2.5. Chlorophyll-a and nitrate concentrations
Chlorophyll-a and nitrate concentrations were measured following the methods of Parsons et al. (1984). Water samples for nutrients analysis were frozen immediately with liquid nitrogen after collection. Nitrate was analyzed with a self-designed #ow injection analyzer (Gong, 1992) and was reduced to nitrite with a cadmium wire which activated with a copper sulphate solution. For chlorophyll-a, 2.5 l of seawater were "ltered through 47 mm GF/F "lters which then stored immediately at !203C. Back at the laboratory, the "lters were ground in 10 ml 90% acetone followed by extraction in a 43C shaking incubator for 2 h. After centrifugation at 1000 rpm for 5 min, concentrations of chlorophyll in the supernatant were measured on a Turner #uorometer (model 10-AU-005). Phytoplankton biomass was calculated by a conver-sion factor of 58 mgC mg chlorophyll~1 (Eppley et al., 1992).
3. Results 3.1. Hydrography
The sampling stations encompassed the inner and outer shelf of the southern East China Sea. The depth of the euphotic zone was very shallow ((40 m) at Sts. 1 and 5
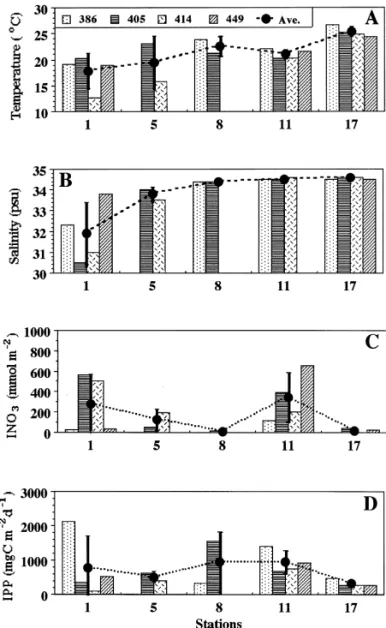
and increased to '75 m at St. 17 (Table 1). Generally, salinity and temperature increased seaward from Sts. 1 to 17 within each cruise (Figs. 2(A) and (B)). However, the local temperature minimum (20}223C) observed at St. 11 marked the area where upwelling occurred (see also below). Individual nitrate (iNO~
3; Table 1) and the euphotic-zone integrated nitrate (INO~
3; Fig. 2(C) concentrations were always higher at coastal (St. 1) and the upwelling (St. 11) areas and showed an opposite trend with temperature and salinity; the upper water column at St. 17 was depleted of iNO~
3 on all cruises. In summary, St. 1 was typical coastal water characterized by high iNO~
3, low temperature and low salinity, while St. 17 represented typical oligotrophic warm oceanic waters with high salinity ('34.4 psu). The copious iNO~
3 con-centrations and low temperature observed in the surface water at St. 11 indicated that there was a source of nutrient supply via upwelling processes in this area (Liu et al., 1992b).
Of these 5 stations, Sts. 11 and 17 were relatively more stable than others, in terms of hydrography or biological activities (see below). These characters varied dramati-cally at Sts. 1, 5 and 8, depending on the magnitude of mixing between di!erent water types and, perhaps, biological activities (i.e. uptake of NO~
3 by phytoplankton). For examples, on Cruise 405, the water at Sts. 5 and 8 probably was more a!ected by the warm oligotrophic and high salinity TSW than the CCW, as indicated by warmer temperature, higher salinity and much lower INO~
3 ((50 mmol m~2). On Cruise 414, the situation reversed and St. 5 was more likely to be in#uenced by the CCW, which resulted in high INO~
3 (196 mmol m~2). The same argument could be applied to St. 8 on Cruises 386 and 405. The upwelling center o! northern Taiwan persisted all year, whereas its position might change with time (Liu et al., 1992a; Gong et al., 1997). We suspected that the water at St. 8 was more likely to have been a!ected by the TSW and KSW on Cruises 386 and 405, respectively. These results suggested that water characteristics at the same sampling station could be quite variable among di!erent cruises and this in fact provided a good opportunity to examine the coupling among physical, chemical and biological phenomena.
3.2. Phytoplankton biomass, primary production and POC concentrations
Individual phytoplankton biomass (iPB; 6}177 mgC m~3) varied about 30-fold among stations (Table 1). Higher values of the euphotic-zone integrated phyto-plankton biomass (IPB) were observed at coastal and upwelling areas, while the values of IPB at St. 17 were all less than 1000 mgC m~2 (data not shown). Depth pro"les of individual primary production (iPP; 0.2}139 mgC m3 d~1; Table 1) at each sampling station showed similar trends with higher values in the surface water and then decreased with depth. The euphotic-zone integrated primary production (IPP) were high at Sts. 1, 8 and 11, with values '750 mgC m~2 d~1, while IPP recorded at Sts. 5 and 17 were low with average values (500 mgC m~2 d~1 (Fig. 2(D)).
The depth pro"les of individual POC concentrations (iPOC; 10}210 mgC m~3) and spatial patterns of the euphotic-zone integrated POC (IPOC; 1415}4682 mgC m~2; Fig. 2(E)) were pretty much the same as iPP and IPP, respectively.
Fig. 2. The euphotic-zone averaged (closed circles) and integrated (columns) values of measured variables. Vertical bars indicate standard errors. (D), IPP: integrated primary production; (E), IPOC: integrated particulate organic carbon; (F), IBB: integrated bact. biomass; (G), IBP: integrated bact. production and (H), bact. turnover rates"IBP/IBB.
3.3. Bacterial biomass, production and turnover rates
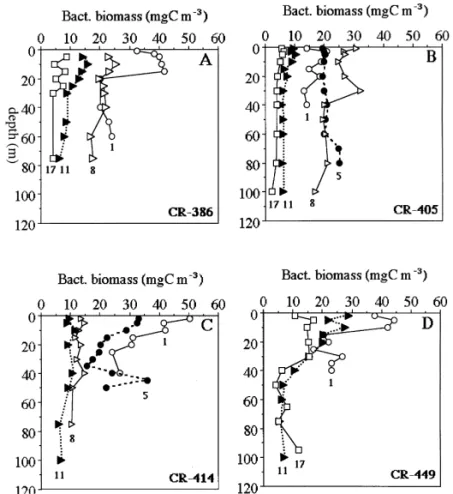
Individual bacterial biomass (iBB) ranged 2.2}50.4 mgC m~3 (0.11}2.5]109 cells l~1; Figs. 3(A)}(D)) with most of the higher values ('30 mgC m~3) recorded at coastal stations. iBB at these stations were high at the surface, decreased with depth and then slightly increased at depths near the bottom. In the oligotrophic KW, iBB seldom exceeded 10 mgC m~3 except on Cruise 449 with iBB ranged
Fig. 2. (Continued.)
10.8}17.0 mgC m~3 in the upper 30 m (Fig. 3(C)). iBB of upwelling stations usually were lower and higher than coastal and Kuroshio stations, respectively.
Individual bacterial production (iBP) varied '60-fold with values ranged 0.22}13.9 mgC m~3 d~1 (Figs. 4(A)}(D)). Depth pro"les of iBP of all sampling sta-tions showed the same trend with higher values at the surface and then decreased with depth. On each cruise, the highest and the lowest iBP were always recorded at the coastal surface waters and the Kuroshio deep water ('50 m), respectively. On Cruise 405, iBP of St. 8 ranked the highest among all stations (Fig. 4(C)) and this might be related with high values of IPOC and IPP (Figs. 2(D)}(E)). On Cruise 414, iBP were all low, particularly for the coastal waters ((4.5 mgC m~3 d~1; Fig. 4(C)) which were
Table 1
A list of the ranges of measured variables! derived from the four cruises conducted at the East China Sea north of Taiwan Cruise Sts. Ze (m) Temp (3C$SD) Salinity (psu$SD) NO~1 3 (lM) POC (mgC m~3) PB (mgC m~3) PP (mgC m~3 d~1) 386 1 40 19.12$0.35 32.345$1.220 0.2/1.0 56/210 18/177 10/139 8 60 23.90$0.01 34.427$0.012 (0.2 28/82 6.4/17 1.2/31 11 75 22.00$2.69 34.476$0.110 (0.2/1.9 17/81 13/55 1.2/93 17 75 26.74$0.62 34.547$0.095 (0.2 30/52 9.3/14 2.9/11.4 405 1 40 20.28$0.31 30.523$0.478 12.9/15.8 57/127 11/77 1.2/32.9 5 40 23.09$0.01 33.990$0.001 1.2/1.5 51/104 23/32 6.2/28.4 8 60 21.18$1.45 34.420$0.024 (0.2/9.1 18/113 5.8/169 0.4/96.6 11 75 20.17$0.62 34.482$0.029 3.4/6.6 27/56 9.9/59 0.2/51.8 17 75 25.18$0.16 34.627$0.023 (0.2/1.1 15/25 8.7/13 0.3/10.2 414 1 40 12.74$0.40 31.024$0.607 11.1/16.0 60/100 13/31 0.3/17.0 5 40 15.75$0.16 33.510$0.016 4.1/6.7 23/88 11/61 0.2/44.5 11 75 20.31$1.44 34.644$0.033 1.9/3.5 10/55 7.0/45 1.2/38.6 17 75 24.91$0.00 34.630$0.002 (0.2/2.3 16/49 10/16 0.8/7.0 449 1 40 19.02$1.49 33.826$0.458 (0.2/1.6 21/145 5.8/50 0.4/34.4 11 75 na na 4.5/12.6 9/70 na 0.6/54.2 17 75 24.44$0.06 34.527$0.043 (0.2/3.3 32/52 na 0.7/5.5 !Ze: depth of the euphotic zone; POC: particulate organic carbon; PB: phytoplankton biomass ("Chl-a]58) and PP: primary productivity. SD: standard deviation and na, not available.
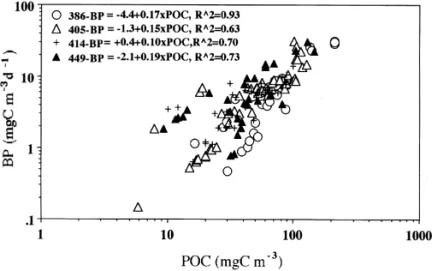
much lower than those recorded on other three cruises. The values of coe$cient of determination (i.e. R2) for iBP vs. iPOC were '0.63 (p(0.01; Fig. 5). Noted that the four slope values (0.10}0.19) for iBP vs. iPOC did not vary much among cruises.
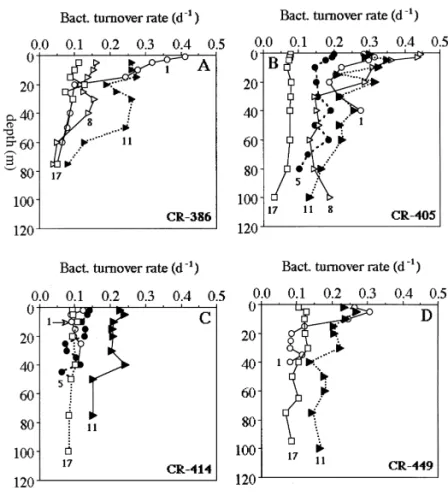
Individual bacterial turnover rates (il"iBP/iBB) ranged 0.03}0.45 d~1 (Figs. 6(A)}(D)). In general, values of bacterial il were higher at the depths less than 40 m of all stations; some, but not all, of the il pro"les decreased exponentially with depth. On each cruise, spatial variations of the il was quite signi"cant; the il in the CCW and the KSW ('0.22 d~1) were at least 2-fold of those recorded in the KW ((0.09 d~1). Noted that on Cruise 414 (Fig. 6(C)), bacterial il in the CCW (i.e. Sts. 1 and 5) were exceptionally low ((0.13 d~1) and this might be due to low temperature (Table 1).
Euphotic-zone integrated bacterial biomass (IBB; Fig. 2(G)), integrated bacterial production (IBP; Fig. 2(H)) and averaged bacterial turnover rates (l"IBP/IBB; Fig. 2(I)) all showed the same patterns with higher values appeared in coastal and upwelling areas. Table 2 revealed the correlation among the euphotic-zone integrated variables. Correlation analysis with all individual data was almost exactly the same as that with euphotic-zone integrated data (data not shown). Nitrate concentrations (INO~
3) showed negative trends with temperature and salinity. All biological vari-ables were positively correlated with each other except IBB, which was negatively
Fig. 3. Depth pro"les of bacterial biomass measured on the four cruises. Numerical numbers below symbols represent sampling stations.
correlated with temperature and salinity. Bacterial rate parameters (IBP andl) were positively correlated with other biological variables (IPOC, IPB and IPP) but showed no correlation with temperature, salinity as well as nitrate concentrations. As the two low temperature ((163C; Cruise 414, Sts. 1 and 5) data removed from correlation analysis, temperature became negatively correlated with all other variables while INO~
3 was positively correlated withl (Table 3). Figs. 7(A) and (B) clearly showed that above 203C (the outer shelf area), IBP andl decreased as temperature increased; temperature alone explained 76 and 62% of the spatial variance of IBP and l, respectively. Note also that in the outer shelf area, the spatial patterns of IBP (andl) during spring (Cruises 386, 414 and 449) and fall (Cruise 405) were quite similar in term of their relationships to temperature. One interesting phenomenon was that IBP andl taken from the inner shelf area (12}203C) increased with the rise of temperature, indicating a possibility of temperature controlled (see more in discussion).
Ratios of IBB:IPB (18}186%) at most stations were (70% with three exceptions; they were 186% at St. 1 on Cruise 414, 114% at St. 1 on Cruise 449 and 146% at
Fig. 4. The same as Fig. 3, but for bacterial production. Note the X-axis are in log scale for better presentation and the X-axis scale of panel C is di!erent from panels A, B and D.
Fig. 6. The same as Fig. 3, but for bacterial turnover rates. Table 2
Correlation coe$cients (r)! among measured variables with euphotic-zone integrated data. ¹ and Sal were euphotic-zone averaged values
¹ Sal
INO3 IBB IBP Bactk IPOC IPB
Sal #0.63 ***** INO3 !0.61 !0.71 ***** IBB !0.76 !0.46 * ***** IBP !0.45 * * #0.65 ***** Bactl * * * na na ****** IPOC * !0.49 * * #0.64 #0.59 ***** IPB * * * * #0.65 #0.75 #0.57 **** IPP * * * * #0.73 #0.64 #0.71 #0.80 !Signi"cant at p"0.01.
St. 8 on Cruise 386. Values of IBP:IPP ratio (6}42%) were (50% except at St. 1 on Cruise 414 with a ratio of 138%. Ratios of IBB:IPB and IBP:IPP seemed quite randomly distributed along the sampling transect and were not correlated with any other measured variables.
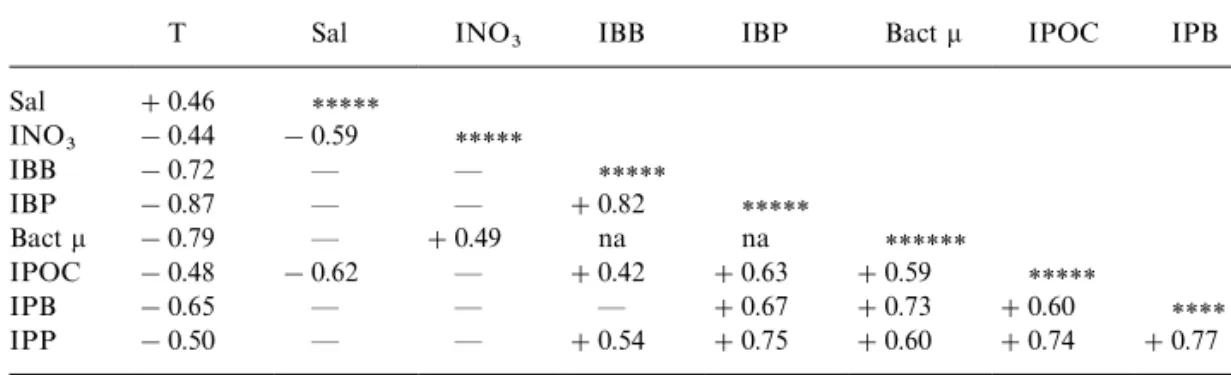
Table 3
Same as Table 2 but for stations with mean temperature '203C
T Sal INO3 IBB IBP Bactl IPOC IPB
Sal #0.46 ***** INO3 !0.44 !0.59 ***** IBB !0.72 * * ***** IBP !0.87 * * #0.82 ***** Bactl !0.79 * #0.49 na na ****** IPOC !0.48 !0.62 * #0.42 #0.63 #0.59 ***** IPB !0.65 * * * #0.67 #0.73 #0.60 **** IPP !0.50 * * #0.54 #0.75 #0.60 #0.74 #0.77
Fig. 7. Scatter plots of integrated bacterial production (A; IBP) and averaged bacterial turnover rates (B;"IBP/IBB) vs. averaged temperature within the euphotic zone. Vertical bars indicate standard error of temperature. Open and closed symbols represent spring (cruises 386, 414 and 449) and fall (cruise 405) data, respectively.
4. Discussions
4.1. Bacterial spatial patterns
Bacterial biomass and rate parameters in the shelf area showed distinct spatial patterns, which might be controlled ultimately by the variations of inorganic nutrient supply rate. Within the study area, the major sources of inorganic nutrient (NO~
3) came from the low temperature ((203C) CCW and KSW. In these two areas, high NO~
3 supply rates might elevate IPB and IPP which indicated high supply rates of dissolved organic matter required for bacterial growth (Cole et al., 1988) as long as temperature was optimal (see below). On the other hand, the warm ('243C) and nutrient-depleted KW constituted the other end member which was characterized by low IPB and IPP in the study area. Noted that from Sts. 11 to 17, IPB, IPP dropped more than 50% with a negligible decrease in IPOC (Figs. 2(D)}(F)). We were not able to explain such phenomenon but to point out this controversy.
Grazing (top-down control), substrate supply rates (bottom-up control) and tem-perature have been proposed as the three major factors in regulating bacterial production in aquatic environments. However, their relative importance might be system dependent and controlling factors might interactively a!ect bacterial proper-ties at di!erent temporal and spatial scales. Sanders et al. (1992) suggested that bottom-up control was more important in oligotrophic environments. Other studies have showed that bottom-up and top-down processes might shift rapidly in days (Psenner and Sommaruga, 1992) and the strength of bottom-up control might be in#uenced by the change in temperature (Ducklow, 1992; Shiah and Ducklow, 1994). Our results revealed some evidences of substrate supply e!ects on the spatial patterns of bacterial properties, particularly for the outer shelf area. The positive correlation observed among bacterial rate parameters and IPOC, IPP and IPB (Table 3) indicated a high possibility of bottom-up control. Another evidence came from the good correlation between BP and BB. It has been proposed that at steady state, the utilization of substrate by bacteria should be very close to substrate supply rate. Thus, a signi"cant correlation between log10 iBP and log10 iBB (r"#0.86, n"153, p(0.01) should be good evidence for bottom-up control (Billen et al., 1990; Ducklow, 1992; Shiah and Ducklow, 1994).
The "nal evidence derived from the results shown in Figs. 7(A) and (B). Within the study area, temperature seemed to be a good tracer for di!erent water types during spring and fall (Fig. 2(A)); it might also re#ect the magnitude of the supply rates of inorganic nutrient (Gong et al., 1995) and dissolved organic substrates (Tables 2 and 3). Therefore, the inverse relationship found between IBP (and l) and temperature particularly in the range of 21}253C, might be viewed as an extra evidence suggesting that bacterial spatial patterns were determined by the variations of substrate supply rates which were resulted from the spatial changes of hydrography.
The low bacterial l observed the inner shelf area ((203C; Fig. 7(B)) might be ascribed to a direct physiological inhibition by low temperature. In this study, bacteriall increased exponentially from 12 to 223C and this gave a Q
10 (the increase in the turnover rate for each 103C increase in temperature) value of 3.12 (R2"0.88,
n"8, p(0.01). One might ask whether the bacteriall vs. temperature relationship derived from our transect-study is applicable to the whole (or most of the) shelf area. In another study conducted in May 1996 which cover broader area of the shelf (25}303N; 120.0}125.53E; Shiah et al., 1999) showed that for the (203C data, the Q10 value for bacterial turnover rate was 3.30 (R2"0.77, n"27, p(0.01). These similar "ndings suggested that temperature might play a more dominant role than the rate of substrate supply in the inner shelf area; however, for the outer shelf area, the situation might reverse. Many studies have demonstrated that bacterial l could be reduced by low temperature at a time scale of hours irrespective of substrate supply rates (Shiah and Ducklow, 1994; Kirchman et al., 1995). Low temperature might also reduce PP and thus algal exudation rates. This might in turn diminish the availability of substrate for bacterial growth and lead to low bacterial l and production. Bacterivory is also a function of temperature (Marrase et al., 1992), higher IBB recorded at Sts. 1 and 5 on Cruise 414 might be due to low grazing rates induced by low temperature. However, we have not had any bacteriovores data up to present, therefor, it was quite di$cult to analyze the top-down e!ects. Overall, these results supported our speculation that changes of hydrography over the shelf area were probably the ultimate cause resulting in the spatial variability of bacterial biomass and turnover rates.
4.2. Bacterial carbon yux
The fates of biogenic particulate and dissolved organic carbon (i.e. POC and DOC) within the euphotic zone is one of the important issues of the KEEP project. The major di$culty in evaluating bacteria importance in the ocean carbon system lies in the uncertainties of factors converting thymidine incorporation rates and biomass (thymidine and carbon conversion factors; TCF and CCF) into carbon based units. In addition, bacterial growth e$ciency (BGE) which is required in estimating bacterial carbon demand also varies. Together, TCF and CCF may vary more than three order of magnitude and BGE can be in the range of (5%}'80% (Ducklow and Carlson, 1992). To avoid over-estimation, lower published values of TCF (1.18]1018 cell mole TdR~1; Fuhrman and Azam, 1982) and CCF (20 fg cell~1; Ducklow and Carlson, 1992) were used here. Another drawback of this study is that we used the same TCF and CCF across di!erent water masses and seasons and there is a possibility that these conversion factors, including chlorophyll to carbon ratios may varied with seasons and water masses.
The grand averages of IBP, IPP, IBB and IPB over the shelf were 138$77 mgC m~2 d~1, 695$562 mgC m~2 d~1, 821$294 mgC m~2 and 1572$ 913 mgC m~2, respectively. Ratios of IBP:IPP were in the range of 6}42% with an average of 22$10%. Assuming a BGE of 20% (del Giorgio et al., 1997), we estimated that bacteria might consume carbon equivalent to almost 100% of the in situ daily particulate primary production within the euphotic zone. The exudation of DOC (i.e. dissolved organic carbon) from primary production was probably insu$cient to sustain such a high bacterial carbon demand. This indicates that other sources of DOC, such as excretion from non-bacterial planktoners, POC dissolution and
Tab le 4 Li st o f th e ra n g es o f p ri ma ry pr od u ct ion (P P ), b a ct eri a l pr od u ct ion (B P ), p h y to p la n k to n bi o m a ss (P B ), b a ct er ia l b io m a ss (B B ), th e ra ti o s of B P /P P a n d B B /P B a n d b a ct er ial tu rn -ov er ra te s (Ba ct .l ) repo rt ed fr o m o th er o ceans Ar ea s! PP BP PB BB BP /P P B B /P B Bac t. l Re fe ren ce s mg C m ~2 d~1 mg C m ~2 d~1 mg C m ~2 mg C m ~2 %%d ~1 Eq -P ac. 5 8 8 /8 35 12 4/1 2 5 1 2 72/158 4 1 2 48/138 0 1 5 /21 87 /98 0 .11/0.1 6 K irch m a n et al. (1 995 ) Eq -P ac. 1 0 80/156 0 1 8 0 /2 40 17 04/194 4 1 0 20/134 4 1 2 /22 65 /76 0 .15/0.2 5 D u ck lo w et a l. (1 9 95) SEEP N A 55 /75 N A N A 1 2 /24 N A 0. 89/6.0 K em p (19 94) N A BE 10 82 32 1 5 3 7 0 1 3 0 3 3 0 2 4 0 .10/0.3 0 D u ck lo w et a l. (1 9 93) N A BE 10 63/114 0 8 0 /20 7 3 9 00/500 0 1 9 00/240 0 8 /18 4 6 /50 0. 08/0.2 5 Li et al. (1 993 ) WC R 3 15 } 69 1 5 4 } 21 4 6 5 0 } 1 750 11 1 } 4 2 4 9 /46 1 1 /50 0. 15/1.1 1 D u ck lo w a n d Ca rl so n (199 2) Sar g a. N A N A 36 0 1 2 7 0 N A 3 5 3 N A Fu hr m a n et a l. (198 9) N. Pa c. 5 2 9 } 81 6 4 1 } 65 11 16 } 157 5 1 1 0 8 } 120 0 5 } 12 72 } 99 0. 04 } 0.0 6 K irch m a n et al. (1 995 ) In d ian 23 6 } 53 3 1 33 } 49 3 N A 1 69 2 } 256 6 3 0 } 92 ' 10 0 0 .0 6 } 0 .40 D u ck low a n d C a rl son (199 2) KE E P 6 9 5 $ 56 2 1 38 $ 7 7 15 72 $ 913 82 1 $ 29 4 2 2 $ 10 69 $ 48 0. 16 $ 0 .6 T hi s st u dy !E q -Pa c., th e E q u ato ri a l P aci " c; SE E P , the Mi dd le A tl a nt ic B ig h t o f the ea st er n U S co n ti n en ta l sh el f a n d sl o p e; N A B E , th e No rt h A tla n ti c B lo o m E x per im ent s; W C R, th e W arm C o re R in g o f th e no rt h A tl a n ti c; S a rg a. , T h e Sar g asso Sea ; N . P a c. , the No rt h P a ci " c.
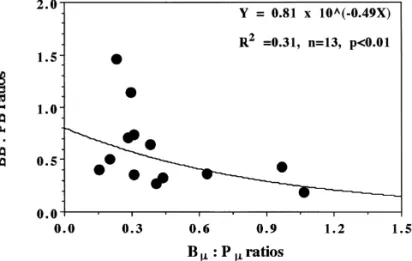
Fig. 8. Scatter plot of biomass ratios of bacteria:phytoplankton vs. turnover rate ratios of bac-teria:phytoplankton.
allochothonous DOC, were probably important in supporting bacterial carbon de-mand in the shelf area. Previous studies showed rich supply of DOC from riverine discharges and remobilization of sur"cial sediments in the ECS (Cauwet and Macken-zie, 1993). The high DOC concentration in the KW was also a possible source of the allochothonous DOC (Hung and Lin, 1994; Hung et al., this issue).
When compared with the data from other Oceans, ratios of IBP:IPP seldom exceeded 50% in many aquatic ecosystems (Table 4; see also Ducklow and Carlson, 1992 for more examples); the global value of IBP:IPP is about 30% (Cole et al., 1984). Of the 16 sampling stations, only one data (St. 1, Cruise 414) showed an extremely high ratio of 138%. As pointed out by Ducklow et al. (1993), higher ratios of IBP:IPP (i.e. '60%) suggested that either BP was supported principally by non-phytoplank-ton DOC sources or the system was at non-steady state. We preferred the second explanation based on the followed reasons. Values of IPP (90 mgC m~2 d~1) and phytoplankton turnover rates (0.14 d~1) were remarkably low, when compared with those recorded at the same station on other cruises ('350 mgC m~2 d~1; '0.50 d~1); this could be ascribed to either the rather low temperature or sun-light intensity (Gong et al, this issue) or both. On the other hand, IPOC (2678 mgC m~2) was not particularly lower than other cruises (2405}4181 mgC m~2). We suspected that bacterial activity was probably out of phase with that of phytoplankton during sampling and this might result in an unusually high ratio.
The values of IBB:IPB ratio at three stations were '100%, while others varied from 36 to 73%. Many studies have shown that IBB surpassed IPB in some oceanic areas (Table 4). In the Sargasso sea, Fuhrman et al. (1989) showed a IBB:IPB ratio of '350% and argued that the dominance of IBB over IPB is possible when bacterial l was lower than phytoplankton l. This idea was supported by Ducklow and Carlson (1992), who reviewed the data collected from di!erent Ocean areas. The same con-clusion was also evident from our data (Fig. 8), which indicated that as the ratio of bacterial l: phytoplankton l increased, IBB:IPB ratios decreased at a logarithmic scale (r"!0.58, n"12, p(0.05).
5. Conclusions
Bacterial biomass, production and turnover rates in the shelf area of the southern East China Sea showed distinct spatial patterns during spring and fall. Such spatial variations could be related to the particular hydrographic conditions of di!erent water types. Coastal and upwelling waters were characterized by low temperature and high concentrations of inorganic nutrients. The rich supply of nutrients usually enhanced primary production and POC concentrations, which might in turn replen-ish the dissolved organic matter required for bacterial growth. With conservative assumptions, we found that the in situ particulate primary production could barely meet bacteria carbon demand in the shelf area. This indicated that non-phytoplank-ton sources of dissolved organic matter might be important in supporting bacterial carbon demand. In addition, allochothonous dissolved organic matter might be needed to ful"l the bacterial carbon demand.
Acknowledgements
NCOR contribution paper d 9. Support for this research was provided by the National Science Council, Taiwan, ROC. The valuable comments for this manuscript from two anonymous reviewers are deeply appreciated. We thank the crew of the R/V Ocean Researcher I for cruise assistance.
References
Barber, R.T., 1993. In situ primary productivity protocol. In: Kadar, S., Leinen, M., Murray, J.W., (Eds.), U.S. JGOFS Equatorial Paci"c Processes Study Sampling and Analytical Protocols. pp. 12}14.
Billen, G., Servais, P., Becquevort, S., 1990. Dynamics of bacterioplankton in oligotrophic and eutrophic aquatic environments: bottom-up or top-down control? Arch. Hydrobiologia. Beih 207, 37}42. Cauwet, G., Mackenzie, F.T., 1993. Carbon inputs and distribution in estuaries of turbid rivers: the Yang
Tze and Yellow rivers (China). Marine Chemistry 43, 235}246.
Cole, J.J., Findlay, S., Pace, M.L., 1988. Bacterial production in fresh and saltwater ecosystems: a cross-system overview. Marine Ecology Progress Series 43, 1}10.
del Giorgio, P.A., Cole, J.J., Cimblerist, A., 1997. Respiration rates in bacteria exceed phytoplankton production in unproductive aquatic systems. Nature 385, 148}151.
Ducklow, H.W., 1992. Factors regulating bottom-up control of bacteria biomass in open ocean plankton communities. Arch. Hydrobiologia. Beih 37, 207}217.
Ducklow, H.W., Carlson, C.A., 1992. Oceanic bacterial production. In: Marshall, K.C. (Ed.), Advance in Microbial Ecology. Plenum, New York, pp. 113}181.
Ducklow, H.W., Kirchman, D.L., Quinby, H.L., Carlson, C.A., Dam, H.G., 1993. Stocks and dynamics of bacterioplankton carbon during the spring bloom in the eastern North Atlantic ocean. Deep-Sea Research 40 (1/2), 245}264.
Ducklow, H.W., Ouinby, H.L., Carlson, C.A., 1995. Bacterioplankton dynamics in the equatorial Paci"c during the 1992 El Nino. Deep-Sea Research 42 (2}3), 621}638.
Eppley, R.W., Chavez, F.P., Barber, R.T., 1992. Standing stocks of particulate carbon and nitrogen in the equatorial Paci"c at 1503W. Journal of Geophysical Research 97 (C1), 655}661.
Findlay, S., Pace, M.L., Lints, D., Cole, J.J., 1991. Weak coupling of bacterial and algal production in a heterotrophic ecosystem: the Hudson River estuary. Limnology and Oceanography 36 (2), 268}278.
Fuhrman, J.A., 1992. Bacterioplankton roles in cycling of organic matter: the microbial food web. In: Falkowski, P.G., Woodhead, A.D. (Eds.), Primary Productivity and Biogeochemical Cycles in the Sea. Plenum, New York, pp. 361}383.
Fuhrman, J.A., Azam, F., 1982. Thymidine incorporation as a measurement of heterotrophic bacterio-plankton production in marine surface waters: evaluation and "eld results. Marine Biology 66, 109}120.
Fuhrman, J.A., Sleeter, T.D., Carlson, C.A., Proctor, L.M., 1989. Dominance of bacterial biomass in the Sargasso Sea and its ecological implications. Marine Ecology Progress Series 57, 207}217.
Gong, G.-C., 1992. Chemical hydrography of the Kuroshio front in the sea northeast of Taiwan. Ph.D. Thesis, Institute of Oceanography, National Taiwan University. Taiwan, ROC.
Gong, G.-C., Chen, Y.-L.L., Liu, K.-K., 1996. Chemical hydrography and chlorophyll distribution in the East China Sea in summer: implications in nutrient dynamics. Continental Shelf Research 16, 1561}1590.
Gong, G.-C., Liu, K.-K., Pai, S.-C., 1995. Prediction of nitrate concentration from two end member mixing in the southern East China Sea. Continental Shelf Research 15, 827}842.
Gong, G.-C., Shiah, F.-K., Liu, K.-K., Chuang, W.-S., Chang, J., 1997. E!ect of Kuroshio intrusion on the chlorophyll distribution in the southern East China sea north of Taiwan during Spring, 1993. Continen-tal Shelf Research 17, 79}94.
Hobbie, J.E., Daley, R.J., Jasper, S., 1977. Use of nuclepore "lters for counting bacteria by #uorescence microscopy. Applied Environmental Microbiology 33 (5), 1225}1228.
Hung, J.J., Lin, P.L., 1994. Distribution of dissolved organic carbon in the continental margin o! northern Taiwan. Terrestrial, Atmospheric and Oceanic Sciences 6, 13}26.
Kemp, P.F., 1994. Microbial carbon utilization on the continental shelf and slope during the SEEP-II experiment. Deep-Sea Research II 41 (2/3), 563}582.
Kirchman, D.L., Rich, J., Barber, T., 1995. Biomass and biomass production of heterotrophic bacteria along 1403W in the equatorial Paci"c: e!ects of temperature on the microbial loop. Deep-Sea Research II 42 (2}3), 603}619.
Li, W.K.W., Irwin, B.D., Dickie, P.M., 1993. Dark "xation of 14C: variations related to biomass and productivity of phytoplankton and bacteria. Limnology and Oceanography 38 (3), 483}494. Liu, K.-K., Gong, G.-C., Lin, S., Yang, C.-Y., Wei, C.-L., Pai, S.-C., Wu, C.-K., 1992a. The year-round
upwelling at the shelf break near the northern tip of Taiwan as evidenced by chemical hydrography. Terrestrial, Atmospheric and Oceanic Sciences 3, 243}275.
Liu, K.-K., Gong, G.-C., Shyu, C.-Z., Pai, S.-C., Wei, C.-L., Chao, S.-Y., 1992b. Response of Kuroshio upwelling to the onset of northeast monsoon in the sea north of Taiwan: observations and a numerical simulation. Journal of Geophysical Research 97, 12 511}12 526.
Liu, K.-K., Iseki, K., Chao, S.-Y., 1998. Continental margin carbon #uxes. In: Hanson, R.B., Ducklow, H., Field, J.G. (Eds.), The Changing Ocean Carbon Cycle. Cambridge University Press., Cambridge pp. 187}239.
Liu, K., Lai, Z., Gong, G., Shiah, F., 1995. Distribution of particulate organic matter in the southern East China sea: implications of production and transport. Terrestrial. Terrestrial, Atmospheric and Oceanic Sciences 6 (1), 27}46.
Marrase, C., Lim, E.L., Caron, D.A., 1992. Seasonal and daily changes in bacterivory in a coastal plankton community. Marine Ecology Progress Series 82, 281}289.
Parsons, T.R., Maita, Y., Lalli, C.M., 1984. In: A Manual of Chemical and Biological Methods for Seawater Analysis. pergamon, New York, pp. 173.
Psenner, R., Sommaruga, R., 1992. Are rapid changes in bacterial biomass caused by shifts from top-down to bottom-up control. Limnology and Oceanography 37 (5), 1092}1100.
Sanders, R.W., Caron, D.A., Berninger, U., 1992. Relationships between bacteria and heterotrophic nanoplankton in marine and fresh waters: an inter-ecosystem comparison. Marine Ecology Progress Series 86, 1}14.
Shiah, F., Ducklow, H.W., 1994. Temperature regulation of heterotrophic bacterioplankton abundance, production, and speci"c growth rate in Chesapeake Bay. Limnology and Oceanography 39 (6), 1243}1258.
Shiah, F., Gong, G., Liu, K., 1996. Light e!ects on phytoplankton photosynthetic performance in the southern East China Sea north of Taiwan. Botanical Bulletin of Academia Sinica 37, 133}140. Shiah, F., Gong, G., Kao, S., Liu, K., 1999. Temperature vs. substrate limitation of heterotrophic
bacterioplankton production across trophic and temperature gradients in the East China Sea. Aquat. Micro. Ecol. 17 (3), 247}254.
Smith, S.V., Hollibaugh, J.T., 1993. Coastal metabolism and the oceanic organic carbon balance. Review of Geophysics 31 (1), 75}89.