Factor construct and health profile which define quality of life in patients with chronic obstructive pulmonary disease
10
0
0
全文
(2) 104. mortality rate 10 years after diagnosis is greater than 50% [3,4]. COPD is one of the leading causes of morbidity and mortality in industrialized and developing countries. The mortality rate for COPD is rising and COPD will probably become the third leading cause of death by the year 2020 [5,6]. According to the World Health Organization, health-related quality of life (QOL) is a broad, multidimensional construct that includes domains such as physical capacity, psychological well-being, social health, and environment [7,8]. Instruments with which to measure QOL can be basically classified as generic or disease-specific. Specific questionnaires (e.g., SGRQ and CRQ, which are used to measure the quality of life in COPD patients) improve the sensitivity of the measurement because they are specially designed for a particular disease, but they are not applicable to the general population. Generic health measures (e.g., WHOQOL-BREF and SF36 Health Survey, which measure the QOL in the general population or any disease group) make comparisons between different conditions possible and thus provide additional information [9,10]. The brief version of the World Health Organization's Quality of Life questionnaire (WHOQOL-BREF) is a multidimensional, multilingual profile that was designed for crosscultural subjective assessment of generic QOL [11,12]. The Taiwan version of the WHOQOLBREF questionnaire includes 2 global WHOQOL items (overall quality of life and overall health status) and 24 facets from the WHOQOL conceptual constructs, as well as 2 additional facets specifically designed for Taiwanese patients. The 24 facets are categorized into four major domains (or factors): Physical Capacity (7 items), Psychological Well-being (6 items), Social Relationship (3 items), and Environment (8 items). The two local items are categorized into the Social Relationships (being respected) and Environmental (availability of food) domains, respectively [13]. It is important that health policy makers. Factor Construct and Health Profile of QOL. address the problem of COPD because of the growing number of patients with the disease and the cost of providing care to those patients over a long period. Hence, a universal, comparable, well-established generic measurement for QOL is needed for a variety of diseases to provide a good comparative methodology for health evaluation [14,15]. The objectives of this study were to assess the factor construct and the health profile of QOL in patients with COPD by the Taiwan version of WHOQOL-BREF questionnaire, to determine the main contributory factors and to make a comparison between the extracted factor constructs and the WHOQOL-BREF conceptual domains. In addition, the association between the four domains (psychological well-being, social relationship, physical capacity and environment) and their effects on overall QOL were analyzed by multiple regression analysis. Results were compared with those obtained from a control group to better understand the characteristics of QOL for patients with COPD. MATERIALS AND METHODS. Sixty-two male patients with stable COPD ≥ 45 years and 84 healthy men ≥ 45 years were included in the study. Patients with COPD were recruited from the China Medical University Hospital outpatient clinics in central Taiwan from December 1999 to May 2000. The healthy men in the control group were selected from a national survey conducted by the WHOQOL Taiwan group in 1999. Demographic and clinical items such as age, smoking, coughing, asthma, religious belief and FEV1 (% predicted) were assessed for individuals with COPD. QOL scores were measured by the Taiwan version of WHOQOLBREF questionnaire for individuals in both groups. Mean scores for each facet were calculated for the COPD and control groups and tested by two-sample t test. The scores for some facets were reversed to allow for comparison with other facets on a scale of 1 to 5 which represented very bad, bad, neither bad nor good, good, and very good. A higher score means a higher QOL in that facet. Domain scores were calculated by multiplying the mean of all facet scores included.
(3) Jian-Jung Chen, et al.. in each domain by a factor of four; potential scores for each domain ranged from 4 to 20. A Cronbach's alpha coefficient of 0.7 or higher [16] or an intraclass correlation coefficient (ICC) of 0.4 or higher [17] was considered acceptable for internal consistency and test-retest reliability. For test-retest, second tests were performed on 21 patients within two to four weeks. Responses to the 26-facet questionnaire were subjected to an exploratory factor analysis (EFA) by applying squared multiple correlations to estimate prior community estimates. In order to make corresponding comparisons between the extracted factors from our data and the four domains of the WHOQOL, the factors were extracted by the principal component method and the 4-factor model (with variance explaining at least 7%) followed by promax (oblique) rotation. The analyses were conducted by SAS/8.12 software. Each of the four factors was assigned a label. Interpretation of the nature of a given factor can be somewhat subjective [18]; therefore, several criteria were adopted in the allocation of domains. In principle, the labeling process for each factor was based on the "high factor loading" method. "High factor loading" was defined as a loading greater than 0.45. We chose 0.45 as the cutoff point because the critical point for testing Pearson's correlation is 0.45 when the type I error is set to 0.01 and the sample size is equal to 30 (a typical minimum sample size). The factor was labeled according to the number of "high factor loading" items. Factor loadings were taken from the matrix of the factor structure (correlations) and represented the Pearson's correlation between the facets and common factors. More sophisticated procedures for identifying significant loadings were discussed by Stevens [19]. A correlation analysis [20], according to the matrix of output from factor analysis, was performed and the reasons for poor correspondence of some facets to the WHOQOLBREF assigned conceptual domain are discussed in this paper. To examine how the four domain factors are related to the overall QOL, the single item. 105. "Overall Quality of Life" in WHOQOL-BREF measured the subject's overall QOL. Crude and multiple regression analyses were applied to examine the effects of the four domains on the overall QOL after controlling for the other demographic and clinical information. The subjective importance ranking among the four domains was used to evaluate the relative importance of each domain. RESULTS. Characteristics of Samples. Table 1 shows the demographic characteristics of the COPD and control groups. The groups were not well-matched in age, education level, or health status. COPD patients were older, less educated and had poorer health status compared with the volunteers in the control group. Fifty-six out of the 62 questionnaires (90%) were filled out by the interviewers for COPD patients because many patients in that group were either elderly, illiterate, or both. These variables were adjusted in the appropriate analyses to account for the age and health status discrepancy across samples. Reliability. The 2 to 4 week test-retest reliability was assessed in 21 COPD patients. The range of intraclass correlation coefficients (ICC) for each facet within each domain is presented in Table 2. The ICC for all items was higher than 0.43, which indicated that the test-retest reliability was acceptable for each item. Table 2 also shows the internal consistency of the WHOQOL-BREF domains. Except for one domain, the Cronbach's alpha coefficient exceeded 0.7 for each domain in both groups. This suggested that facets within domains were highly internally consistent across different groups. The lowest Cronbach's alpha coefficient was for the social domain in the control group (0.63). D i s c r i m i n a n t Va l i d i t y a n d C o n t e n t Validity. Table 3 shows the results of the discriminant validity analysis and the content validity analysis. The COPD group had.
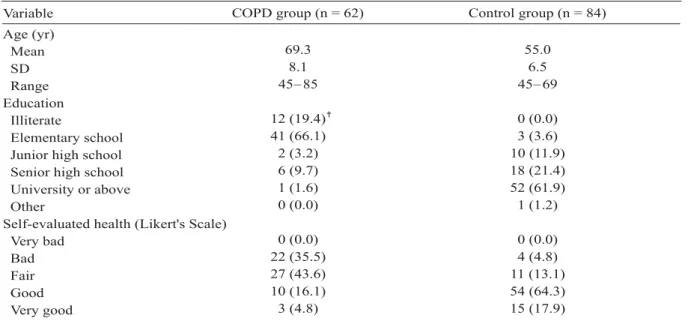
(4) 106. Factor Construct and Health Profile of QOL. Table 1. Characteristics of individuals in the COPD and control groups. Variable. COPD group (n = 62). Control group (n = 84). 69.3 8.1 45 85. 55.0 6.5 45 69. 12 (19.4) 41 (66.1) 2 (3.2) 6 (9.7) 1 (1.6) 0 (0.0). 0 (0.0) 3 (3.6) 10 (11.9) 18 (21.4) 52 (61.9) 1 (1.2). 0 (0.0) 22 (35.5) 27 (43.6) 10 (16.1) 3 (4.8). 0 (0.0) 4 (4.8) 11 (13.1) 54 (64.3) 15 (17.9). Age (yr) Mean SD Range Education Illiterate Elementary school Junior high school Senior high school University or above Other Self-evaluated health (Likert's Scale) Very bad Bad Fair Good Very good. Data are presented as numbers with percentage in parentheses.. Table 2. Test-retest reliability and internal consistency. WHOQOL-BREF domains. Number of facets. Range of ICC COPD group (n = 21). 7 Physical 6 Psychological 4 Social 9 Environmental ICC = intraclass correlation coefficient.. significantly lower mean scores for the physical, psychological and social domains. However, the control group had significantly lower mean scores for the environmental domain. COPD patients' QOL scores were significantly lower for the following facets: general health, dependence on medication or treatment, energy and fatigue, working capacity, positive feelings, spirituality and beliefs, appearance, sex life and friend support. Another interesting finding was that the control group had significantly worse scores for most facets in the environmental domain (physical safety and security, physical environments, financial resources, health and social care availability and quality, transport and food satisfaction) perhaps due to demographic differences between the two groups. Table 3 shows correlations of each facet score to the. 0.59 0.43 0.66 0.62. 0.92 0.84 0.97 0.96. Cronbach's alpha COPD group (n = 62) 0.72 0.75 0.71 0.75. Control group (n = 84) 0.72 0.75 0.63 0.77. overall domain score. These correlations were used to verify whether the domains contained appropriate contents. The results showed that the contents of facets and related domains were valid mainly for the psychological and social relationship domains. One facet (dependence on medication or treatment) in the physical domain weakly correlated (r = 0.36) with its assigned domain, and another facet (physical safety and security) in the environmental domain was also weakly associated (r = 0.35) with its assigned domain. Hence, the content validities were not entirely valid for the physical and the environmental domains. Factor Analysis and Factor Construct Analysis. Table 4 shows the results of the four-factor models from the explanatory factor analysis.
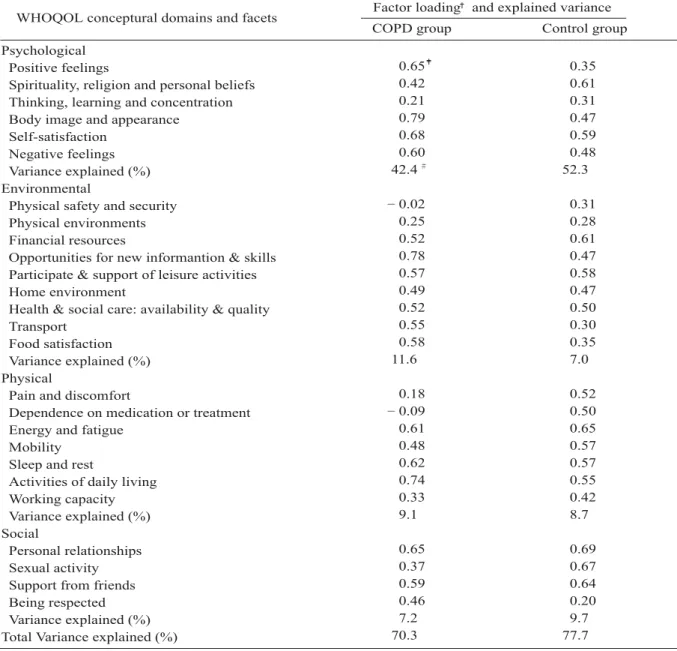
(5) Jian-Jung Chen, et al.. 107. Table 3. Discriminant and content validity. Mean score COPD group (n = 62) 3.4 Overall quality of life 2.9 Overall health 12.4 Physical 3.7 Pain and discomfort 1.3 Dependence on medication or treatment 2.8 Energy and fatigue 3.9 Mobility 3.4 Sleep and rest 3.5 Activities of daily living 2.9 Working capacity 13.2 Psychological 3.1 Positive feelings 2.7 Spirituality, religion and personal beliefs 3.3 Thinking, learning and concentration 3.5 Body image and appearance 3.5 Self-satisfaction 3.6 Negative feelings 13.2 Social 3.5 Personal relationships 3.2 Sexual activity 3.3 Support from friends 3.2 Being respected 14.4 Environmental 3.0 Physical safety and security 3.2 Physical environments 3.7 Financial resources 3.6 Opportunities for new informantion & skills 2.8 Participation of leisure activities 3.6 Home environment 4.2 Health & social care: availability & quality 3.8 Transport 4.5 Food satisfaction WHOQOL-BREF domains and facets. Control group (n = 84) 3.5 3.6 15.6 3.8 4.8 3.5 4.1 3.6 3.6 3.8 14.0 2.7 3.7 3.4 4.0 3.7 3.4 14.0 3.5 3.6 3.6 3.3 12.8 3.4 2.7 3.0 3.3 3.1 3.5 3.5 3.1 3.6. p. Correlation of facet to domain: COPD group. *** *** *** ***. *** * * *** **. 0.56 0.36 0.62 0.70 0.59 0.73 0.70 0.65 0.58 0.59 0.67 0.77 0.71. * ** ** *** * *** ***. *** *** ***. 0.79 0.52 0.84 0.80 0.35 0.56 0.75 0.70 0.64 0.61 0.48 0.42 0.66. 1: very bad, 5: very good. Overall mean of domain is taking by multiplying average for all facets in the domain by 4. Correlation of each facet to overall mean of domain WHOQOL conceptually assigned. *p < 0.05, **p < 0.01, ***p < 0.001.. between both groups. In order to make corresponding comparisons between the extracted factors from our data and the WHOQOL conceptual four domains in Table 4, only the relevant factor loadings for the corresponding domains are shown. Facets with lower loadings indicate weaker correspondence to the domains in the original conceptual model. For example, in the COPD group, there was a negative correlation between the "physical safety and security" facet and its corresponding environmental factor (factor loading = 0.02); the facet "dependence on. medication or treatment" also weakly negatively correlated with its corresponding physical factor (factor loading = 0.09). In the COPD group, the four-factor model accounted for 70.3% of the variance (9.1% for physical capacity, 42.4% for psychological, 7.2% for social relationship, and 11.6% for environment). In the control group, the models accounted for 77.7% (8.7%, 52.3%, 7.0% and 9.7%, respectively) of the variance. Regression Analysis. Regression analysis examined the effect of these four domains on overall QOL by controlling.
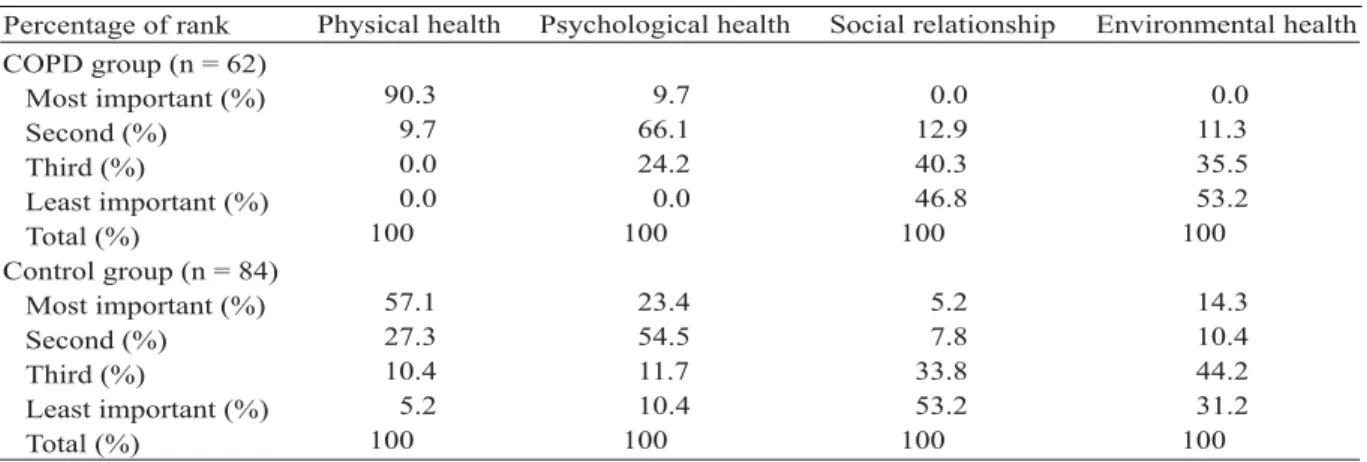
(6) 108. Factor Construct and Health Profile of QOL. Table 4. Factor loadings of quality of life for COPD (n = 62) and control groups (n = 84) measured by the Taiwan version of the WHOQOL-BREF questionnaire. WHOQOL conceptural domains and facets Psychological Positive feelings Spirituality, religion and personal beliefs Thinking, learning and concentration Body image and appearance Self-satisfaction Negative feelings Variance explained (%) Environmental Physical safety and security Physical environments Financial resources Opportunities for new informantion & skills Participate & support of leisure activities Home environment Health & social care: availability & quality Transport Food satisfaction Variance explained (%) Physical Pain and discomfort Dependence on medication or treatment Energy and fatigue Mobility Sleep and rest Activities of daily living Working capacity Variance explained (%) Social Personal relationships Sexual activity Support from friends Being respected Variance explained (%) Total Variance explained (%). Factor loading and explained variance COPD group. Control group. 0.65 0.42 0.21 0.79 0.68 0.60 42.4. 0.35 0.61 0.31 0.47 0.59 0.48 52.3. 0.02 0.25 0.52 0.78 0.57 0.49 0.52 0.55 0.58 11.6. 0.31 0.28 0.61 0.47 0.58 0.47 0.50 0.30 0.35 7.0. 0.18 0.09 0.61 0.48 0.62 0.74 0.33 9.1. 0.52 0.50 0.65 0.57 0.57 0.55 0.42 8.7. 0.65 0.37 0.59 0.46 7.2 70.3. 0.69 0.67 0.64 0.20 9.7 77.7. Factor loadings correspond to the conceptual model. Values (Factor loadings) were from the matrix of factor structure (correlations). Variance Explained was calculated from the 4-factor models separately for COPD and control groups.. for demographic and clinical items such as age, smoking, coughing, asthma, religious belief and FEV1 (% predicted) (Table 5). The effect of each variable (or domain) was evaluated by crude analysis and then the effects of the four domains were analyzed simultaneously by multiple regression analysis. When the four domains were entered into the model separately, each domain correlated significantly with QOL. However, when the four domains were analyzed. simultaneously, the results showed that the psychological domain had the strongest association with QOL, but that the other three domains did not correlate significantly with the overall QOL due to strong inter-correlations among the four domains. Importance Ranking. Table 6 shows the ranking of each WHOQOL-BREF domain for the COPD and control groups. Ninety percent of COPD patients.
(7) Jian-Jung Chen, et al.. 109. Table 5. Crude and multiple regression analyses of the COPD group with WHOQOL-BREF overall quality of life facet as dependent variable. Multiple regression. Crude regression. Variable. β. Age (yr) Smoking (yr) Coughing (yr) Asthma (yr) Religion (yes = 0) FEV1 (% predicted) Physical health Psychological health Social relationship Environmental health *p < 0.05, **p < 0.01, ***p < 0.001.. β. 0.01 0.02 * 0.02 0.004 0.03 0.004 0.55 ** 0.86 *** 0.72 *** 0.95 ***. 0.04 0.03 0.12 0.06 0.2 0.003 0.53 0.85 * 0.23 0.35. Table 6. Importance ranking of domains in the COPD and control groups. Percentage of rank COPD group (n = 62) Most important (%) Second (%) Third (%) Least important (%) Total (%) Control group (n = 84) Most important (%) Second (%) Third (%) Least important (%) Total (%). Physical health. Psychological health. Social relationship. Environmental health. 90.3 9.7 0.0 0.0 100. 9.7 66.1 24.2 0.0 100. 0.0 12.9 40.3 46.8 100. 0.0 11.3 35.5 53.2 100. 57.1 27.3 10.4 5.2 100. 23.4 54.5 11.7 10.4 100. 5.2 7.8 33.8 53.2 100. 14.3 10.4 44.2 31.2 100. thought physical capacity was the most important domain, while only fifty-seven percent shared the same view in the control group. DISCUSSION. Our results showed that the Taiwan version of the WHOQOL-BREF provides good internal reliability, test-retest reliability, content validity, discriminant validity and construct validity. Our findings from the discriminant validity analysis showed that mean scores in the COPD group were lower than in the control group for physical, psychological and social relationship domains. However, it was not initially predicted that the mean scores of the environmental domain in the COPD group would be higher than in the control group. Bonomi et al [20] compared the QOL of three groups (healthy, childbearing, chronically ill) and found that there was a significant. difference in the environmental domain score between the three groups. Chronically ill patients scored lowest, possibly because those patients had a diminished sense of control in their lives (including living arrangement), which may have adversely affected their attitude toward their environment. However, the results of our study were inconsistent with theirs. This may have been due to cultural differences and the characteristics of our samples. For example, in our COPD group, most patients were elderly, retired and undereducated. Furthermore, most elderly Chinese have different cultural values and expectations about life than westerners, which may explain why they had an indifferent attitude toward their environment but still cared about physical, psychological and social issues. Factor analysis of the four models showed that the factor constructs were comparable with.
(8) 110. the four domains of the WHOQOL-BREF: psychological well-being, environment, physical capacity and social relationship. Except for a few facets, moderate to high factor loadings were found between each facet in the WHOQOL domain and its corresponding factor extracted from the data. In the COPD group, two facets, "physical safety and security" in the WHOQOL environmental domain and "dependence on medication or treatment" in the WHOQOL physical domain did not conform to the originally assigned domains. The facet "physical safety and security" had a slight negative correlation (factor loading = 0.02) with the corresponding environmental factor from our data, which may have been due to different cultural perceptions of personal safety and security and the physical environment in Taiwan. However, this facet highly correlated with the social relationship domain. This may also have been due to a different perception of "physical safety and security" among Taiwanese. In Taiwan, social relationships may be considered more important than the physical environment for this facet. The facet "dependence on medication or treatment" had a weak negative correlation (factor loading = 0.09) with the corresponding physical factor from our data, perhaps because most chronically ill patients are dependent on medication. The score of this facet was low and did not fluctuate. It not only weakly correlated with its assigned physical domain but also did not correlate significantly with the other three domains. Task performance may be less important than the ability to enjoy life for COPD patients because COPD often affects older people. There is a growing awareness that health status is better characterized by QOL than standard physiologic outcomes [21-23]. However, there is little data in the literature about the impact of factor constructs of different health profiles (physical, psychological, social and environmental) on overall QOL. Multiple regression analysis showed a significant association between overall QOL and the psychological domain of COPD patients. The reason for this may have been because the psychological domain exerted an. Factor Construct and Health Profile of QOL. influence on the other domains, although the physical domain was the most important concern for most people. There were some limitations in this study. First, the COPD and control groups were not well-matched in age, education level, and health status. However, the main purpose of this study was not to compare the COPD patients with controls to demonstrate a clinical effect; rather it was to investigate characteristics of the COPD group with regard to factor constructs and health profile of QOL. In the regression analysis, overall QOL was based on only one item in the 28-item questionnaire; therefore, the reliability needs to be considered. Furthermore, it was not possible to perform confirmatory factor analysis (CFA) because the sample size was relatively small. The results from the exploratory factor analysis were therefore more subjective than those from the CFA. To a large extent, assessment of QOL is based on subjects' personal perception. Therefore, it was difficult to obtain a clear correspondence between our data and the theoretical domains, which made labeling of the four-factor construct challenging. Although some facets did not correspond with the original conceptual model, most facets showed good consistency. The noncorresponding facets likely reflect some special characteristics of the COPD group. Assessment of QOL in COPD patients clearly yields different results from those in the general population. In conclusion, the four-factor model evaluated by exploratory factor analysis can be applied to the factor construct of QOL in COPD patients and was comparable to the WHOQOL conceptual model. Ranking of importance revealed that the physical domain was the most important factor for QOL among individuals in both groups. Multiple linear regression analysis showed that psychological factors dominated the results. It is vitally essential therefore to not only evaluate patients' physical needs but also to assess psychological health to improve their QOL. ACKNOWLEDGMENT. This work was supported by a grant (NHRIEX92-9204PP) from the National Health Research Institute, Taiwan..
(9) Jian-Jung Chen, et al.. REFERENCES. 1. Stavem K, Boe J, Erikssen J. Health status, dyspnea, lung function and exercise capacity in patients with chronic obstructive pulmonary disease. Int J Tuberc Lung Dis 1999;3:920-6. 2. Janssens JP, de Muralt B, Titelion V. Management of dyspnea in severe chronic obstructive pulmonary disease. [Review] J Pain Symptom Manage 2000; 19:378-92. 3. Traver GA, Cline MG, Burrows B. Predictors of mortality in chronic obstructive pulmonary disease. A 15-year follow-up study. Am Rev Respir Dis 1979; 119:895-902. 4. Ferguson GT, Cherniack RM. Management of chronic obstructive pulmonary disease. [Review] N Engl J Med 1993;328:1017-22. 5. Siafakas NM, Vermeire P, Pride NB, et al. Optimal assessment and management of chronic obstructive pulmonary disease (COPD). The European Respiratory Society Task Force. Eur Respir J 1995;8:1398-420. 6. Murray CJ, Lopez AD. Alternative projections of mortality and disability by cause 1990-2020: Global Burden of Disease Study. Lancet 1997;349:1498-504. 7. The WHOQOL Group. Development of the WHOQOL: rationale and current status. Intern J Mental Health 1994;23:24-56. 8. The WHOQOL Group. The World Health Organization Quality of Life assessment (WHOQOL): position paper from the World Health Organization. Soc Sci Med 1995;41:1403-9. 9. The WHOQOL Group. The World Health Organization Quality of Life Assessment (WHOQOL): development and general psychometric properties. Soc Sci Med 1998;46:1569-85. 10. Schunemann HJ, Guyatt GH, Griffith L, et al. A randomized controlled trial to evaluate the effect of informing patients about their pretreatment responses to two respiratory questionnaires. Chest 2002;122: 1701-8. 11. The WHOQOL Group. Development of the World Health Organization WHOQOL- BREF quality of life assessment. Psychol Med 1998;28:551-8.. 111. 12. World Health Organization. WHOQOL-BREF: Introduction, administration, scoring and generic version of the assessment - Field trial version. Geneva: WHO, 1996. 13. Lin MR, Yao KP, Hwang JS, et al. Scale descriptor selection for Taiwan-version of questionnaire of World Health Organization quality of life. Chin J Pub Health (Taipei) 1999;18:262-70. (In Chinese; English abstract) 14. Muennig PA, Gold MR. Using the years-of-healthylife measure to calculate QALYs. Am J Prev Med 2001;20:35-9. 15. Tijhuis GJ, Jansen SJ, Stiggelbout AM, et al. Value of the time trade off method for measuring utilities in patients with rheumatoid arthritis. Ann Rheum Dis 2000;59:892-7. 16. Nunnally JC, Bernstein IH. Psychometric Theory. 3rd ed. NY: McGraw-Hill; 1994. 17. Landis JR, Koch GG. The measurement of observer agreement for categorical data. Biometrics 1977;33: 159-74. 18. Hatcher L. A step-by-step approach to using the SAS system for factor analysis and structural equation modeling. Cary, NC: SAS Institute Inc., 1994. 19. Stevens J. Applied multivariate statistics for the social science. Hillsdale, NJ Lawrence Erlbaum Associates, 1986. 20. Bonomi AE, Patrick DL, Bushnell DM, et al. Validation of the United States' version of the World Health Organization Quality of Life (WHOQOL) instrument. J Clin Epidemiol 2000;53:1-12. 21. Pearlman RA, Uhlmann RF. Quality of life in chronic diseases: perceptions of elderly patients. J Gerontol 1988;43:25-30. 22. Mahler DA. How should health-related quality of life be assessed in patients with COPD? [Review] Chest 2000;117(2 Suppl):54-7. 23. Yohannes AM, Roomi J, Waters K, et al. Quality of life in elderly patients with COPD: measurement and predictive factors. Respir Med 1998;92:1231-6..
(10) 112. 1. 2. 2. 1. 62. 2. 2. 45. 84. 45. -. 70.3% 42.4%. 7.2%. 11.6%. ). (9.1% 90% 57%. 2004;9:103-12. -. 404. 91. 2003. 12. 2004. 3. 10 9. 2004. 3. 5.
(11)
數據
相關文件
依獎懲及 法定程序 予以書面 懲處 暫時讓學 生與其他 同學保持 距離..
第二級失能 生活補助金 滿第一年 15萬元 11.25萬元 滿第二年 20萬元 15.00萬元 滿第三年 25萬元 18.75萬元 滿第四年 30萬元
A Phase 2/3 Multicenter, Open-label, 3-arm, 2-stage Randomized Study of ASP2215 (Gilteritinib), Combination of ASP2215 Plus Azacitidine and Azacitidine Alone in the Treatment
In order to facilitate the schools using integrated or mixed mode of curriculum organization to adopt the modules of Life and Society (S1-3) for improving their
- To provide career and life planning education at the junior secondary level to develop students’ understanding of themselves in the context of whole-person development.
Stage 6 Special Program of Study – Personal Development, Health and Physical Education Life
Stage 6 Special Program of Study – Personal development, health and physical education life
[r]
