台灣消費者的偏好:以巴拉圭共和國 Hecodulc 產品案例
51
0
0
全文
(2)
(3) Acknowledgement. I would like to express my sincere gratitude to my advisor Prof. James Wu for the continuous support and guidance of my research as well as for sharing his knowledge and expertise to complete this thesis successfully. My thank and appreciations also go to all my professors, the stuff of the IMBA program and the International Office Affairs for their support and help during my studies, to my parents for their love and encouragement throughout my whole life, and to the Ministry of Science and Technology (MOST) of Taiwan for allowing me to come to this beautiful country and complete the IMBA program.. Jorge David Torres Brizuela July 2020. I.
(4) Consumers’ Preferences in Taiwan: The Case of Hecodulc Products from Republic of Paraguay Advisors: Prof. Chien-Hsing Wu Department of Information Management, National University of Kaohsiung Prof. Po-Chih Lee Department of International Business and Administration, National University of Kaohsiung. Graduate Student: Jorge David Torres Brizuela International Master of Business Administration, National University of Kaohsiung. Abstract This research thesis explores the determinants associated with the purchase willingness of Taiwanese consumers for the Hecodulc products from Paraguay. The Perceived Health, Packaging Attraction, Trust of product Ad, Perceived Brand Loyalty, Perceived Quality are considered linking to purchase attitude toward product and buying willingness. The research hypotheses and research model are developed and examined by using a linear and multiple regression model with data collected from a survey conducted to Taiwanese people. Based on the analysis results, this study shows that the dynamic interaction among Taiwanese consumers is focused on perceived brand loyalty and perceived quality whereas perceived health, and packaging and advertisement do not have a significant impact. Finally, the attitude toward this product (Hecodulc) is not significantly associated with buying willingness. As a new product in Taiwan, there are many unknowns around its quality, benefits, brand, etc. which need an in-depth analysis. In this regard, to allow the success of Heducolc launched in Taiwan, the manufacturers of Hecodulc products should enhance some promotional activities, such as offering free samples or testing at the sales point to provide consumers with an opportunity to try the product, familiarizing themselves with it and evaluate the quality of the brand. The company should also establish a partnership with a recognized brand in Taiwan to help effectively enter the Taiwan’s market. Managerial implications are also addressed in this research thesis. Keywords: Consumer preference, Hecodulc product, Buying willingness, Paraguay. II.
(5) Table of Contents Table of Contents ...................................................................................................................... III List of Tables ........................................................................................................................... IV List of Figures ............................................................................................................................ V Chapter 1 Introduction ................................................................................................................ 1 1.1 Background ....................................................................................................................... 1 1.2 Motivation and Objectives .................................................................................................3 1.3 Research Procedure ...........................................................................................................4 1.4 Thesis Overview ................................................................................................................ 5 Chapter 2 Literature Review .......................................................................................................6 2.1 Global Marketing ...............................................................................................................6 2.2 Consumption Behavior .................................................................................................... 11 2.3 Consumer Preferences ..................................................................................................... 15 2.4 Hecodulc Products in Republic of Paraguay ..................................................................... 18 Chapter 3 Research Method ...................................................................................................... 21 3.1 Research Framework ....................................................................................................... 21 3.2 Sample (subjects to be interviewed) ................................................................................. 22 3.3 Measure (interview questionnaire outline interview plan) ................................................ 23 Chapter 4 Results and Discussion .............................................................................................. 24 4.1 Descriptive Statistics........................................................................................................ 24 4.1.1 Part 1-A: ................................................................................................................... 24 4.1.2 Part 1-B:.................................................................................................................... 25 4.2 Hypothesis Test ............................................................................................................... 27 Significance level: 0.1 ........................................................................................................... 31 4.3 Discussion and Implications ............................................................................................ 31 Chapter 5 Conclusion ................................................................................................................ 35 5.1 Research Contribution ..................................................................................................... 35 5.2 Research Suggestions ...................................................................................................... 35 5.3 Limitations and Future Studies......................................................................................... 36 References ................................................................................................................................ 37. III.
(6) Appendix: Interview Questionnaire ........................................................................................... 42. List of Tables Table 2. 1 Distance dimensions in international Marketing ..........................................................8 Table 4. 1 Hypothesis and Survey Questionnaire relationship. ................................................... 28 Table 4. 2 R square & Significance F of H2 to H5 ..................................................................... 29 Table 4. 3 T-statistics and P--value of H2 to H6 ........................................................................ 29 Table 4. 4 R square & Significance F of H1 .............................................................................. 29 Table 4. 5 T-statistics and P-value of H1 ................................................................................... 29 Table 4. 6 A summary of hypothesis testing .............................................................................. 31. IV.
(7) List of Figures Figure 1. 1 Research process .......................................................................................................5 Figure 2. 1 Main differences between domestic marketing and international marketing ...............7 Figure 2. 2 Global marketing strategy’s approaches................................................................... 10 Figure 2. 3 Hierarchical model of consumer goals ..................................................................... 12 Figure 2. 4 A framework of Cross-Cultural Consumer Behavior................................................ 14 Figure 2. 5 The consumers’ decision-making process. ............................................................... 16 Figure 2. 6 Hecodulc Stevia Liquid and Tabletop Hecodulc Stevia Powder ............................... 19 Figure 3. 1 Research Model....................................................................................................... 22 Figure 4. 1 Interviwees Gender & Figure 4. 2 Interviewees Age ................................................ 24 Figure 4. 3 Interviwees education level & Figure 4. 4Interviwees Marital Status ....................... 25 Figure 4. 5 Consumer budget & Figure 4. 6 Place to buy ............................................................ 25 Figure 4. 7 Package’s impression & Figure 4. 8 Way to sweet their beverage, etc ..................... 26 Figure 4. 9 Differentiation between samples & Figure 4. 10 Is it sweet? .................................... 26 Figure 4. 11 Differentiation between samples & Figure 4. 12 Is it sweet? ................................. 27 Figure 4. 13 Differentiation between samples ............................................................................ 27 Figure 4. 14 Hypothesis testing results ..................................................................................... 32. V.
(8) Chapter 1 Introduction 1.1 Background Global relationships among countries have created many strong ties in several aspects; one of the most fruitful is the one between Paraguay and Taiwan, which since 1957 Taiwan helped the South American country to develop wealth in many aspects. Since 1992, Taiwan’s economy has been growing and growing through the years, being recognized as an Economic success. Its GDP growth has an average of 4.5 % and the real per capita escalated from 9,116 $ in 1992 to 25,004 in 2018, with the outcome of Taiwan being 28th in the list of wealthiest countries globally, and 6th richest country in Asia, although in 2019 has dropped to the 34th position of the wealthiest countries, the country has shown great potential. Taiwan’s expansion in international trades haven been expanded since then, and its numbers talk by themselves, like in 1992 when the ascent started the total trade was over 180 $ billions and represented 82 % of the GDP, and in 2018 Taiwan’s trade represented 126 % of GDP with a value over 745 $ billions, making of Taiwan the 17th largest trader (Government Portal of the Republic of China, 2020) In 2016 president became president of Taiwan and with the New Southbound Policy she promoted greater economic integration with South and South-East Asia, bilateral trades with the US, and also wanted to join the Trans-Pacific partnership. These goods movements played a role in increasing Taiwan’s exports, around 11 % during the first semester of 2017 (Meltzer, 2017). On the other hand, Taiwan imports are mostly agricultural goods and raw material, because of the lack of arable land and indigenous natural resources, following in the second place are capital goods and the third largest import is consumer goods. It has been seen that Taiwan growth rely on international trades, and its economy focuses in producing parts and components for final products, and its customers are usually from Japan, the United States and European Union, which over 70 % of Taiwan’s exports, compromise intermediate goods. Taiwan also produce 94 % of world’s motherboard and notebooks PCs, and most of the computer chips used by the Americans comes from Taiwan. Since the diplomatic relationship establishment between Paraguay and Taiwan, these two countries have been supporting internationally to each other and joining a strong and close exchange and cooperation ties in the field of commerce, agriculture, culture, education and so on.. 1.
(9) From 1961, the diplomatic relationship between Paraguay and Taiwan has been increasing and strengthening, with official visits of each President to each other countries, and other high officers, as well as the subscription of more than fifty bilateral instruments that comprehend a wide range of matters, culture, commerce and economic cooperation, technical cooperation, tourism, investments, financing, mutual investment guaranty, extradition, loans contracts, financing cooperation, public works constructions, air transportation, diplomatic and officers passports suppressing. Taiwan, through the Cooperation and International Economic Development funding, was and keep being important partner of Paraguay in the area of technical cooperation with several projects implemented in diverse areas, such as pisciculture, pig-farming, floriculture, agriculture, among others, canalized in Paraguay through a Technical mission of Taiwan. Many donations from Taiwan to Paraguay have been effectuated all over these years of diplomatic relationships, pointing out the ones to the National Congress, the Minister of International affairs and the constructions of common housings. Moreover, there is a big number of youth who annually participate in different university programs, and technical and professional training, given from the Taiwan Government. Regarding to the bilateral trading, it is important to express that thanks to the close relationship among these two countries, Paraguay is strengthening more and more its trade balance with Taiwan, due to the efforts of privates sectors of both parties. (Embassy of Paraguay in Republic of China – Taiwan, 2020) The way Taiwanese people consume aliments have changed in the last two decades, mostly due the government’s actions. In 1996 obesity among Taiwanese adults has increased from 33 % to 44 % by 2008, among female 36 % and male 51 %. So because of the concern that obesity’s disease can increment and the alarming results; from the National and Health Survey in Taiwan, an institute that is planning nutrition surveys since 1980, and to support and empower to people to choose healthiest options, the Health Promotion Administration (HPA) in Taiwan, started an initiative in 2011, that consisted in targeting to recruit six hundred thousand citizens to collectively lose six hundred thousand kilograms of overweight every year. This initiative was well received all around the country and at the end of 2013 more than two millions of participants have lost about three million kilograms. Due to the welcomed and effective initiative that was effective in weight management at population level, brought positive support to develop new policies about health care and healthier environments. Considering these past events and the consciousness of Taiwanese people for consuming healthy foods and products, it is a good opportunity to offer a. 2.
(10) new natural product from a friendly nation; which by the way is rarely found in Asia unless recurring to online shops, to keep the line of healthiness among the citizens. However, to insert a new product in a market, it is important to study how people decide to spend their money based on their individual preferences and budget constraints. Studying how people operate makes easier for vendors to predict which of their products will sell more. The Consumer Theory advocates that consumers decide how to assign their money in buying goods, with the aim to get the maximum satisfaction. In such manner, consumer theory include interaction of consumer preferences, combinations of good preferences that report the same satisfaction and the total quantity of goods that is possible to consume with a certain wage.. 1.2 Motivation and Objectives Twentieth century has been the witness of most technological agricultural changes leaving remarks on rural landscape population. Its impact showed sustainable food production became more and more vital after facing with social, ecological and economic impacts of industrialized agriculture. Societies are demanding healthy consumption as a critically important consumer driving, currently, it is generally accepted that consumers care about what they eat, how their food is produced and the impact that food production and consumption have on the environment and society. Consumers’ concerns about the methods of food production, the conditions under which food is grown, and its healthy value have increased in the developed world in the last two decades, a trend that will have considerable influence over food company strategies in coming years. This is a key fact to remarking that in the framework of the international business, the global food market involves more than US$ 3.4 Trillion in 2018 and is expected to reach a value of US$ 4.2 Trillion by 2024, registering a Compound Annual Growth Rate of 3.6% during 2019-2024 (Global Food Service Market, 2019). For example, the annual study, Euromonitor International (2016) finds that respondents globally already rank good health as the most important determinant of happiness and that consumers show interest in dieting. The results of the survey suggest in the 15 leading youth markets, one-third of 16-27 year olds claim to be trying to lose weight, and healthy food was found to be popular worldwide, with 56% of global youth buying healthy products (Lappo Et Al, 2015). It is possible to affirm that the benefits derived from a healthy diet can increase the demand for a specific food and consumers’ willingness to pay. However, the effects on buying behavior 3.
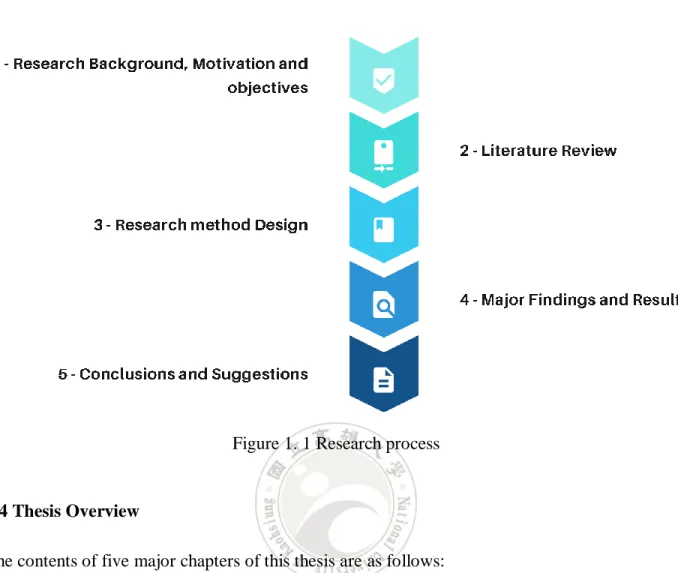
(11) from expected health benefits are not the same across countries and individuals. Consumers’ ability to process information and understand health benefits will affect the adoption and consumption of these healthy foods, Consumer perceptions about food risk and benefits arise from social interaction and cultural framework also affects the willing to buy. Individuals have different levels of qualifications, cognitive skills and personal experiences which may affect the perception of potential risks or health benefits. Other attributes as a taste, cost or safety may dominate the decision to consume the kind of products. Similarly, the effects on buying behavior may be associated with the level of consumer involvement in personal health care, and is related to other habits. Therefore, the purpose of this study is to explore the determinants that are associated with consumption preferences of a healthy product, Hecodulc sweetener from Paraguay in the context of Taiwan’s consumers. Additionally, all the determinants explored under examination could serve as the basis for further related research; and to provide Taiwanese consumption preferences and trends to gain a better market understanding to lead marketing strategies regarding healthy food products in Taiwan. The objectives of this study as summarized as follows: (1) To explore consumption preference of Hecodulc in Taiwan (2) To provide marketing insights for the Hecodulc products in Taiwan. 1.3 Research Procedure This research focuses on the Taiwanese consumption preferences to determinate if the consumers are willing to consume Hecodulc sweetener from Paraguay. The research process is illustrated in Figure 1-1. Based on the research motivation and objectives, reviewing other related literature is conducted in order to achieve a better comprehension on the topic. The research method used is a qualitative study which includes the research model, development of the survey questionnaire and the subjects that are targeted. This research employs primary data and the survey is conducted to potential consumers with a minimum number of 20 consumers. The analysis and evaluation of the collected data is done according with the selected consumption preference model. Finally, the finding and results are presented, followed by implications and conclusions.. 4.
(12) Figure 1. 1 Research process. 1.4 Thesis Overview The contents of five major chapters of this thesis are as follows: Chapter One: Introduction. This chapter includes three main sections: The topic background, followed by the thesis purpose and objectives which guide the thesis statement, and lastly, a schematic outline of the thesis remainder Chapter Two: Literature review. In this chapter a review of the most relevant and significant studies and publications regarding to the topic is provided, including the main contributions and its authors in order to achieve a comprehensive look and conceptual framework about the topic to support the theoretical bases of this study. Chapter Three: Research Method. This Chapter explains the research methods and design that were used to conducted the study, including the data sources, data gathering procedure, data analysis, statistical treatments and research instruments. Chapter Four: Analysis Results and Discussion. This section presented the findings of the study, its analysis and interpretation. 5.
(13) Chapter Five Conclusions: In this last part the summarized of the major research findings, its implications, the contribution and suggestions for future research directions are displayed.. Chapter 2 Literature Review 2.1 Global Marketing To make trades around the globe among countries has never been easier than today, thanks to the globalization any nation is capable to make deals in any side of the world. On the one hand, the gradual decline of trade barriers, increasing regional integration, improved international trade infrastructures, and emergence of new markets around the globe has created a different competitive landscape for organizations. On the other hand, this increasing globalization of markets and production is making things more difficult for practitioners due to growing intensity and complexity of global competition. As global markets become more interconnected and dynamic over time, effective monitoring of the external environment and maximum use of company resources will be imperative to gain competitive advantage (Kaur & Chawla, 2016). Thus, many organizations are increasingly recognizing the essential role of effective international marketing activities in achieving growth and prosperity. The growing availability and spread of transportation and communications technologies, as well the increasing use of internet are making consumers more homogeneous and foreign markets more accessible. According to some theories and authors some global marketing efforts has created market from common needs along with the convergence of many consumers’ wants and desires. (Svensson, 2012). The continuous growth of this cultural universality has brought a major standardization, homogenization and integration of marketing activities across markets. However, the global firm deals with a paradox. On the one hand, global reach involves these general objectives and skills looking for cultural universality. Indeed, the international organizations must also recognize that global consumers differ in their consumption behavior from culture to culture. Cultural elements such as language, clothing, food, customs, beliefs and practices differ from country to country. According to Mooij, 1998 “Markets are about people, no products. There may be global products, but there are not the same global people willing to buy them. There may be global brands but there are not the same global motivations for buying those brands”. 6.
(14) Because firms seek to expand to other geographical boundaries, their global marketing strategies would focus to operate as if the world were one large market, ignoring superficial regional and national differences, but also making sure that marketing activities fit the products and services to the practices and cultural characteristics of different markets. In this way, success means adapting general knowledge to the particular circumstances and characteristics of each country to allow also the competition with local products and brands (Gleason & Wiggenhorn, 2015). Generally, international marketing is different from domestic marketing, as illustrated in Figure 2-1. Explicitly, the aim of global marketing is to reach world-wide coordination, rationalization, and integration of all marketing activities including target market selection, marketing-mix decisions, the development of a global products, brands, communications, and distribution strategies. The economic, legal, social, and cultural differences in global markets make the task of the international marketing manager much more difficult than in a domestic market. Precisely, all of these differences can be grouped in three main aspects: The global marketing is characterized by 1) greater uncertainty in markets and environments, 2) global markets are more diverse and dynamic than domestic and 3) global markets are separated by greater geographical and psychological distance.. Figure 2. 1 Main differences between domestic marketing and international marketing 7.
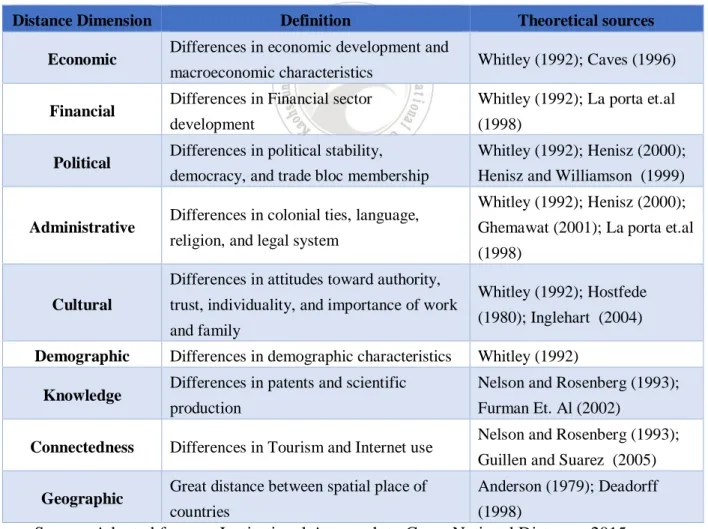
(15) In the International business and global marketing context, distance usually refers to the extent of differences between country pairs. The assumption is that these differences prevent or disturb the flows of information between the business and the market. As such, distance introduces friction and complexity to cross-border activities, increasing the challenges of achieving and sustaining successful in international business (Cuervo & Genc, 2014). The geographic distance refers to the proximity, that means the spatial distance between actors in terms of how remote or separate they are (e.g. country A - country B). However, other factors such as climate, topography, and others regarding to technological environment as transportation or communication links are all important in evaluating differences in term of geographic distance, e.g. a lack of a common border, a lack of sea or river access, a week transportation or communication links could limit the access and extend the distance between countries. Table 2-1 addresses the distance dimensions in international marketing. Table 2. 1 Distance dimensions in international Marketing Distance Dimension Economic Financial Political. Administrative. Definition Differences in economic development and macroeconomic characteristics. Whitley (1992); La porta et.al. development. (1998). Differences in political stability,. Whitley (1992); Henisz (2000);. democracy, and trade bloc membership. Henisz and Williamson (1999). Differences in colonial ties, language, religion, and legal system. Knowledge Connectedness Geographic. Whitley (1992); Henisz (2000); Ghemawat (2001); La porta et.al (1998). trust, individuality, and importance of work and family. Demographic. Whitley (1992); Caves (1996). Differences in Financial sector. Differences in attitudes toward authority, Cultural. Theoretical sources. Whitley (1992); Hostfede (1980); Inglehart (2004). Differences in demographic characteristics. Whitley (1992). Differences in patents and scientific. Nelson and Rosenberg (1993);. production. Furman Et. Al (2002). Differences in Tourism and Internet use. Nelson and Rosenberg (1993); Guillen and Suarez (2005). Great distance between spatial place of. Anderson (1979); Deadorff. countries. (1998). Source: Adapted from an Institutional Approach to Cross-National Distance, 2015. 8.
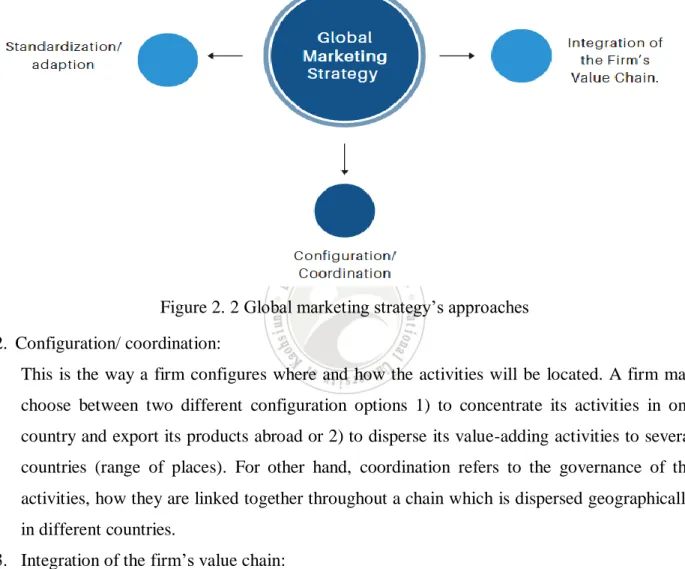
(16) Although in essence this spatial distances have been reduced by the increasing use of IT media, the Internet allows consumers in one area of the world can be in communication with sellers or buyers in another part of the world. Transactions that once took a long time to consummate can now be accomplished immediately over the internet. The internet along with the E-commerce revolutionizes the way to make business, offer services/products or buy them globally. Moreover, the Internet overcomes global time and space barriers removes obstacles created by geography, time zones, and location, thereby creating a “frictionless” business environment. For other side, the psychological/cultural distance also plays a significant role in global markets. Cultural distance could be defined as some measure of the extent to which cultures are similar or different, while, Physic distance, exists in the mind of the individual as a perceived distance between the home country culture and the host country culture. Both cultural and psychic distances affect how management formulates global marketing strategy. Cultural differences influence consumer behavior and preferences for various products. Culture-bound products may therefore have to be adapted to meet differences in consumer needs. Likewise, psychic distance may color managerial beliefs that the greater the distance between two or more countries, the greater the differences in consumer preferences. While psychic distance is perceptual, and may not accurately reflect actual differences, or lack of them, it nevertheless influences managerial decision making. Psychic distance may also affect a multinational firm’s organization during its internationalization process, especially entry mode choices and the way it governs its operations abroad (Shaoming & Tamer, 2014). In order for firms to successfully compete globally, they must overcome all of those distances and achieve a significant competitive advantage over their competitors. To do so, a firm must develop a global marketing strategy. There are three approaches to global marketing strategy, as illustrated in Figure 2-2. Details are addressed below. 1. Standardization/Adaption: This refers to the use of basically the same (standardization) or different (adaptation) product or service, distribution channels, advertising, price, promotion, and others across countries. A firm following a standardizations consider that world markets can be homogenized by advances in communications, transportation and technologies. Finally, customers located in different places around the world tend to exhibit similar preferences and demand the same products and services. Some benefits of this strategy include economies of scale in production. 9.
(17) and marketing (low-cost position) but is often related with its cultural insensitivity, because does not consider the widely carried cultural backgrounds in different countries, opposite to the adaptation strategy where the firms prefer to adapt their marketing programs to fit consumer desires and expectations in each country.. Figure 2. 2 Global marketing strategy’s approaches 2. Configuration/ coordination: This is the way a firm configures where and how the activities will be located. A firm may choose between two different configuration options 1) to concentrate its activities in one country and export its products abroad or 2) to disperse its value-adding activities to several countries (range of places). For other hand, coordination refers to the governance of the activities, how they are linked together throughout a chain which is dispersed geographically in different countries. 3. Integration of the firm’s value chain: A key tool for developing and sustaining competitive advantage is configuring and coordinating the firm’s value chain. Briefly, a value chain is the sequence of activities required to make a product or provide a service. A firm’s survival depends upon its ability to create value which is demanded by customers. This is about how a firm’s competitive battles are planned and executed across country markets independently or interdependently e.g. some firms fight their competitors ‘one country at time’ in separate contest (Warren et al., 2016). 10.
(18) In general, global players can choose where to compete and how to invest the most resources against competitors —in their home market, in the competitor’s home market, or in third markets. The global marketing strategy influences a firm’s global marketing performance. A global strategy is an organization-wide plan designed to enable the firm to develop a strong global presence, especially in terms of marketing and production and this is not possible if the firm does not consider the distance dimensions such as cultural, geographical among others, since the consumer behaviors and preferences across different countries are various and ill-predictable.. 2.2 Consumption Behavior The American Marketing Association defines consumer behavior as “the dynamic interaction of affect, cognition, behavior, and the environment by which human beings conduct the exchange aspects of their lives” (Bagozzi, 2018). That is to say that consumer behavior involves the thoughts and feelings people experience and the actions during consumption processes. (Constantinos et al., 2019). Consumer behavior is dynamic because the feelings, thinking and actions of each consumer are constantly changing. One of the tools that revolutionize the way people search for information about product and services is the internet by which people with a computer can just have a click for deciding what to buy or not. Therefore, marketers for ongoing consumer research and analysis to keep abreast of important trends have to consider that consumers and their environments are constantly changing. To date, marketers have more challenging tasks to develop marketing strategies. Strategies that work in one market may fail in other markets. To create more value for customers and stay profitable, many companies have to innovate constantly, due product life cycles are shorter than before. This means to create new products, new versions of existing products, new brands, and new strategies from them. The more marketers know about the interaction of what product and brand mean to consumers, what must do to purchase and use them, what influences shopping, and consumption, the better they can satisfy consumer needs and wants and create value for them. For this reason, professionals in marketing place an emphasis on that consumer behavior also involves interactions. An example could be that the middle-income consumers are shrinking and low-and high-income groups are increasing, and the results of these changes affects consumer thoughts, feelings, and actions, and of course have to be considered in a marketing strategy (Kyeongheui and Jongwon, 2019). 11.
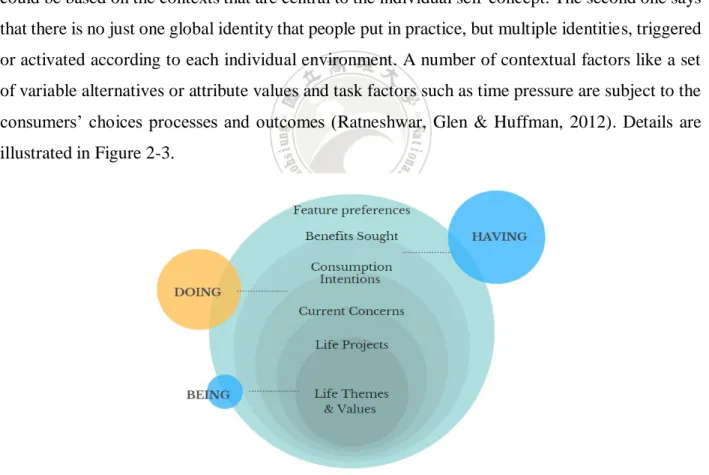
(19) Consumer behavior also involves exchanges. People give up something of value to others and receive something in return; in other words this is how the market of products and services work, exchanging between buyers. Another important factor to understand consumer behavior is the environment, which is everything external to people that influence on what they think, feel and do. It includes social stimuli, such as the actions of other in cultures, subcultures, social classes, reference groups, and families, that influence consumer. It also includes other physical stimuli, such as stores, products, advertisements, and signs that can change consumers’ thoughts, feeling, and actions (Peter & Olson, 2011). Generally, consumer behavior is based in two fundamental ideas according to the identity theory. The first one is that people put forward to consume products and take actions to achieve identities consistent with their optimal self-images. Hence consumers’ relationship with brands could be based on the contexts that are central to the individual self-concept. The second one says that there is no just one global identity that people put in practice, but multiple identities, triggered or activated according to each individual environment. A number of contextual factors like a set of variable alternatives or attribute values and task factors such as time pressure are subject to the consumers’ choices processes and outcomes (Ratneshwar, Glen & Huffman, 2012). Details are illustrated in Figure 2-3.. Figure 2. 3 Hierarchical model of consumer goals Source: Ratneshwar, Glen & Huffman (2012). 12.
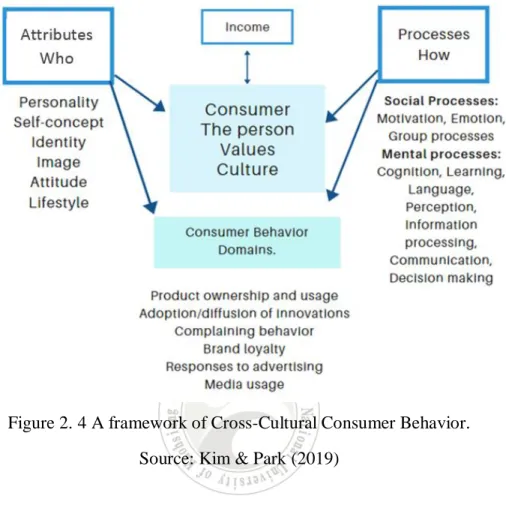
(20) The life themes and values are defined as personal ideas of being, and represents the highest goal level. Life project are defined as the construction and maintenance of key life roles and identities. Current concerns are defined as activities, tasks or quest in which an individual want to be engaged in the short time. Consumption intentions are defined as individuals’ aims and desires to engage in particular product consumption and use behaviors. Benefits sought are defined as the consequences that are desired from ownership, usage, and disposal of a product. Feature preference are defined as preferred product features levels or values as stated in concrete physical or financial terms. Continuing with the dynamic way that consumers mold their preferences at the moment of buying goods and services, the global communication is assuming to create homogeneous and global culture. Consumer behavior around the world is formed by a set of consumption-related symbols such as product categories, brands that are very significant for the people. For example, sports has another big of influence in consumption behaviors, and many nations have their preference sports, like New Zealand is rugby, in the Netherlands, France and Spain cycling is an important sport, in Malaysia badminton is very popular, and maybe football (soccer) can be considered as the most popular sport around the globe, even though it is by no means as popular in the United States, as it is in Europe or Latin America. Football even varies within Europe from 49 % in the United Kingdom to 65 % in Portugal. Belgians are more interested in tennis with 60 % of the population, and so on (Hildebrand et al., 2019). Music is also a big field that influence consumption behavior. Local music has gained market share throughout most of the world. Local films are increasing in many European markets, in Germany 26.6 % of cinema attendance choose nationals films (Zeeshan, 2013). For many countries instead of getting wrap by the globalization or homogenization, they stay more attach to their local culture and try to keep alive their own identities. Human behavior components are summarized as what they (people) are, what people think about what sort of person are, how people feel, think, learn and what they do. According to the elements included in the definition of consumer behavior (affect, cognition and behavior), marketers have to understand the influence of culture on consumer behavior; they have to add culture in many components of human behavior, The components are illustrated in the Figure 2-4, which represents the cultural components of people according to their attributes and processes as consumers, and the cultural elements of behavior in consumer behavior domains. Culture influence. 13.
(21) wealth, but in turn of influencing culture, income is putting in a separate box, which interacts with the culture of consumers.. Figure 2. 4 A framework of Cross-Cultural Consumer Behavior. Source: Kim & Park (2019). Culture is what makes people stick together. It represents human community, its individual and social organization. Without culture, it will be difficult for people to live among one another. The anthropologist Clifford Geertz (Marieke, 2014) views culture as a set of control mechanism of rules, plans, recipes and instructions for the governing behavior. People are conditioned by their sociocultural environment to act in certain manners. Individuals cannot be separated from culture; neither can culture be separated from the historical context. What memory is to individuals is culture to society. It concerns attitudes, norms, shared beliefs, roles, and values found among speakers of a particular language who share the same historical timeline in a specific piece of land. These share components of subjective culture are generally transferred from generation to generation. Moreover, culture can also be described according to specific characteristics or categorized into value categories or dimensions of national culture. The most common dimension used for ordering societies is their degree of economic evolution or modernity, from traditional to. 14.
(22) modern.. 2.3 Consumer Preferences Consumer preferences of products and services generally begin with a combination of many factors that vary according to each individual necessity. Some factors come directly from the products or services features or simply from the consumers themselves. Consumers make decisions according to characteristics or settings where some choices are known and additional alternatives can be disclosed through making some researches for comments, opinions, and suggestions. They have to decide their best choice according to previously discovered alternatives and searching to discover additional alternatives before making a choice. Usually consumers choose a brand they think it will fit to their personality or self-image. In this case they will try to show their identity according to their choices. That is why brand preference is considered as an important factor in consumer’s decision making. While building brand preferences, consumer rank and compare diverse brand by concentrating in their uniqueness. (Abdurrahman & Mehmet, 2015) Researchers have found that consumers generally go through a five-stage decision-making process in any purchase, either are products or services. The decision-making process is basically a cognitive process which is a psychological issue in nature. Usually, this process is not obvious, instead what marketers do to infer in this decision-making process is in place by careful observation. Details are illustrated in Figure 2-5.. 15.
(23) Figure 2. 5 The consumers’ decision-making process. Source: Lake, 2011 For marketers or business owners, it is very important to understand clearly this process. By learning so, customers can enhance not only experience, but be able to walk them through the process and increase chances of gaining business. Having a clear understand of the decisionmaking process can help drive marketing message and marketing decisions towards business goals. Phases in this process are as follows.. Phase 1: Recognizing a need or desire During the first phase consumers recognizes that they have a need to fulfill. So the buyer senses a gap between his actual state and his desire state. Consumers’ actual state is the perception of his feelings and situation at the time. That desired state is the way they want to feel or be at that time.. Phase 2: Seeking and researching possible solution. Consumers start information seeking by conducting an internal search about what they are looking for and what will fulfill their need and desire on a personal level. Then they start an external search for information among friends, family members, salespeople, and advertisements. This phase provides them criteria for assessing products alternatives and results in a set of potential choices. 16.
(24) Phase 3: Evaluating the alternatives In this phase, consumers start to process the information gathered and make a decision. They make so by, identifying and evaluating the value of their alternatives looking at the features they want. The evaluation depends on the individual consumer and the importance attached to the specific buying situation.. Phase 4: Assessing the value of the chosen product or service After a consumer assess and select the best choice, they are ready to purchase. But the consumer is not done with the decision – making process yet. They have to determine if the product has value, because buying value is the perception of the worth the customer is getting by purchasing a product, and it is not just about price, is also about quality and experience.. Phase 5: Evaluating the purchase after the need is done. A marketer who thinks that the job is done after the product is sold, is doomed to failure. The end of the sell is not the end of the buying process. Actually it could be the beginning of another sale if the process through completion and satisfaction is followed correctly. This final phase of the process consists on follow the psychological response of the consumers, is the phase where the buyer will often undergo a degree of reflection about the purchase decision. (Lake, 2011).. In a marketplace flooded with solutions, the particular products and brands that consumers choose will be selected because they satisfy and address a new consumer psychology (Yarrow, 2014). Regarding to food consumption, there has been a big chance among consumer options during the last two decades. Saturation points have reached in many developed countries (in quantitative terms), and consumption options are broader than those in the past. So, marketing activities and food quality in those saturated market, are paying more attention to the nutrition, healthiness and quality of food they eat. Hence, companies have to be more concerned with the demand for quality-differentiate food products, because many consumers look for food that is not only safe, they also like to consume foods that promote good health. In this context, today’s people are more concerned with the way their food is grown and cooked than that 10 years ago. However, these changes did not come alone; thinness, overweight and obesity have caused a. 17.
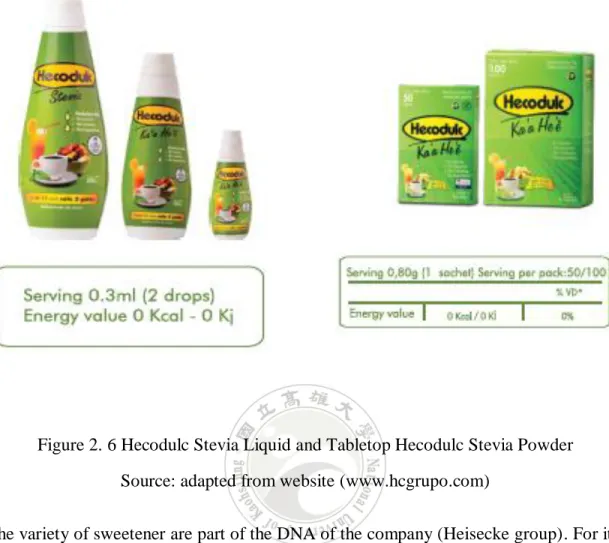
(25) new way of eating, being obesity one of the most common disease in some countries, which is characterized by the excess of body fat. One of the causes of obesity is that people do not control the consumption of sugar and saturate body fat. Because of the concern regarding obesity and sociocultural changes, many researchers are working in experiments to raise awareness to the society about low-fat and sugars (Kuster & Vila, 2017). One of the remarkable products is the Hecoduld Products in Republic of Paraguay.. 2.4 Hecodulc Products in Republic of Paraguay Basically, Hecodulc is a sweetener made of stevia, a brand leader that has been established since 1979, which is the first one in its type in Paraguay. Its high performance, premium quality and a variety family adapted to every needs make this product unique. In particular, Hecodulc is quite suitable for people with celiac and diabetes diseases. The producer of the Hecodulc is the company named Heisecke Group, which was founded 85 years ago as a family company in the pharmaceutical field that has been expanded through the time. The company has been established in Paraguay and Bolivia with the entrepreneur and visionary spirit of its founders and fellows. The company has been invested within research and development, and human capital. The group has more than 250 professionals distributed in the commercial, industrial and logistic activities. The company has different presentations of Hecodulc products, such as Hecodulc Sucralose, Hecodulc Impalpable, Hecodulc Vanilla flavor and Hecodulc kaʼa heʼẽ. In this research thesis, the one that is tested to Taiwanese people is the last one, Hecodulc kaʼa heʼẽ. The products are illustrated in Figures 7 and 8, respectively. Hecodulc stevia liquid is a highly concentrated sweetener with a very sweet taste in every drop, powdered tabletop sweetener with kaʼa heʼẽ high sweetening power. Each sachet sweetens to the equivalent of 2 teaspoons of sugar. They are ideal to sweeten all kinds of drinks, fruits and cereal. It can also be used for baking.. 18.
(26) Figure 2. 6 Hecodulc Stevia Liquid and Tabletop Hecodulc Stevia Powder Source: adapted from website (www.hcgrupo.com) The variety of sweetener are part of the DNA of the company (Heisecke group). For its long career that have been developed by specific formulas, concentrate and high quality, this DNA makes the company an absolute leader in market of sweeteners in Paraguay. Moreover, the hecodulc brand, property of Heisecke group, is the most well know brand of sweeteners in the Paraguayan market, which a leader product in its category and one of the first to include in the market the famous kaʼa heʼẽ or stevia in its formula. Its innovative liquid bottle packaging has achieved a good position in every store, making this product even more attractive to the markets abroad. Hecoduldc is made from stevia leaf. The demand of stevia production have been grown from the past decade due the fast growing of people who choose for healthier lifestyle around the world. This herb is also known as sweet herb (kaʼa heʼẽ in Paraguay), honey leaf or honey yerba. Stevia have been used for a long time for ancients who lived in the places where the leaf is originated from, to cure chronic and non-chronic diseases. It has been proved that it is nontoxic. The main herbal sweeter presented in the leaf is the stevioside and it is 100-350 times sweeter than sucrose. 19.
(27) It tastes pleasant with a good solubility and for the body is easy to metabolize without any toxic effect. More importantly, what it makes superior to other sugar substitutes is its high nutritional profile. Besides, the stevia leaf is compounded by many nutrients, like 80 to 85 % water, fiber, amino acids, proteins, free sugars, essential oils, organic acids and vitamins. It is also considered a good source of potassium, sulphur, calcium, sodium, magnesium, phosphorus, iron and more. Many products have been isolated from stevia species, like more than 100. The responsibility for the sweetening of the leaf is the compound of steviol glycosides (Amin et al., 2017). Moreover, this leaf has been used from ancient time because of its efficient therapeutic and pharmacological compounds that owns antimicrobial, antioxidant, antitumor, antifungal, anti-inflammatory and anticarcinogenic activities. Stevia is recommended to fight against the diabetes, cardiovascular disease, hypertension, renal disease, cancer, inflammatory bowel disease, obesity, dental caries and diarrhea. Steviol also regulates blood glucose levels by enhancing the insulin secretion and its utilization.. 20.
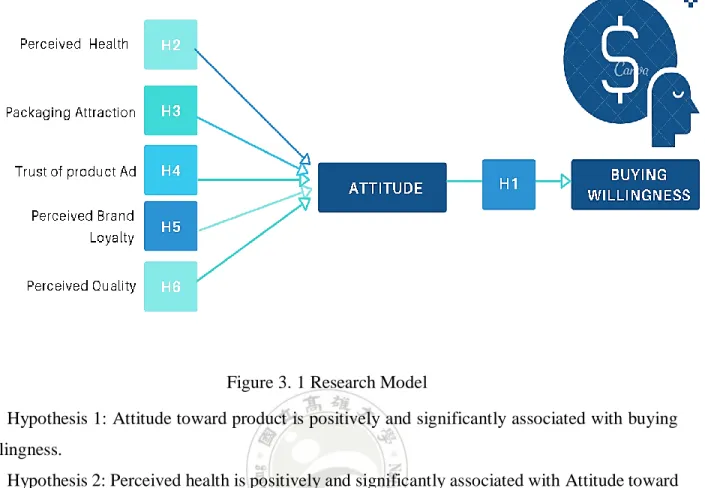
(28) Chapter 3 Research Method 3.1 Research Framework The research framework is illustrated in Figure 3-1. It contains five independent variables including Perceived Health, Packaging Attraction, Trust of product Ad, Perceived Brand Loyalty, Perceived Quality and two dependent variables Attitude toward product and Buying willingness. The operational definition of variables are defined in table 3-1. For example, Perceived health is defined as “The subjects’ perception of health on Hecoduldc product”, Packaging attraction as “The packaging attraction of Hecoduldc product”, and Trust of product Ad as “The trustful subject has toward Advertisement”. These attributes or five independent variables that subjects response to the Hecoduldc product are regarded as the main determinants linking to their attitude defined as a feeling of favorableness or unfavorableness that an individual has towards an object, in this case Hecoduldc product. Finally the model seek to determine the buying willingness depending on the attitude toward product. Accordingly, the responding seven hypotheses are defined as below. For example, the first hypothesis H1 is developed as attitude toward product is positively and significantly associated with buying willingness which is tested to confirm whether attitude influences the buying willingness, thus, H2 is developed as Perceived health is positively and significantly associated with attitude toward product, which is tested to confirm whether perceived health influences the attitude toward product of customer and so on.. 21.
(29) Figure 3. 1 Research Model Hypothesis 1: Attitude toward product is positively and significantly associated with buying willingness. Hypothesis 2: Perceived health is positively and significantly associated with Attitude toward product. Hypothesis 3: Packaging attraction is positively and significantly associated with Attitude toward product. Hypothesis 4: Trust of product Ad is positively and significantly associated with Attitude toward product. Hypothesis 5: Perceived brand loyalty is positively and significantly associated with Attitude toward product. Hypothesis 6: Perceived quality is positively and significantly associated with Attitude toward product.. 3.2 Sample (subjects to be interviewed) This study is focus on the model describe on the previous figure 3-1, on which the study tries to find the consumption preference of Hecodulc and to provide some insights for the Hecodulc. 22.
(30) product in Taiwan. So that, the main purpose is to find out if Taiwan can be a good market for the mentioned product, and the results of the research pretend to provide the knowledge to the headquarter in Paraguay. Therefore, the subjects in this research questionnaire are any Taiwanese citizens over 16 years old who are willing to consume sweetener as a replacement of sugar. The background of the subject is diverse, trying to embrace different scenarios and obtain results from different perspectives, thus each subject that have been interview are considered qualify. To collect the research data, this research printed out personnel questionnaires for each subject to interview them and making them try the product, and answer the questions related to the sweetener. In the step where the subject tastes the sweetener, one cup without the sweetener and one cup of tea with two drops of the product is given to them to see if they can notice the difference, and take notes about their perceptions.. 3.3 Measure (interview questionnaire outline interview plan) The interview questionnaire is present in Appendix. It contains two main parts (part One and Two). The part one is subdivided in parts A and B, where part A is used to collect interviewee’s background, including gender, age, level of education, marital status, how much money do you spend in healthy food and how do you buy it, and part B is related to the subjects’ impression about the sweetener after trying it. The data from part 1-A is analyzed to present the descriptive statistics for subjects. The part 1-B is summarized to display the overall feelings from all aspects about the product whereas part 2 is used to test the hypotheses aforementioned. In this regard twenty-five people were designated as a sample for this exploratory study.. 23.
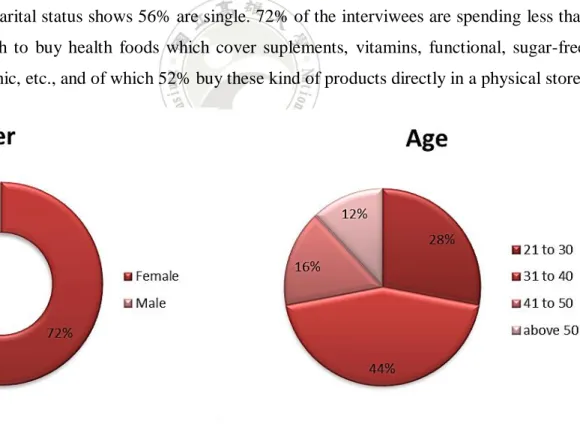
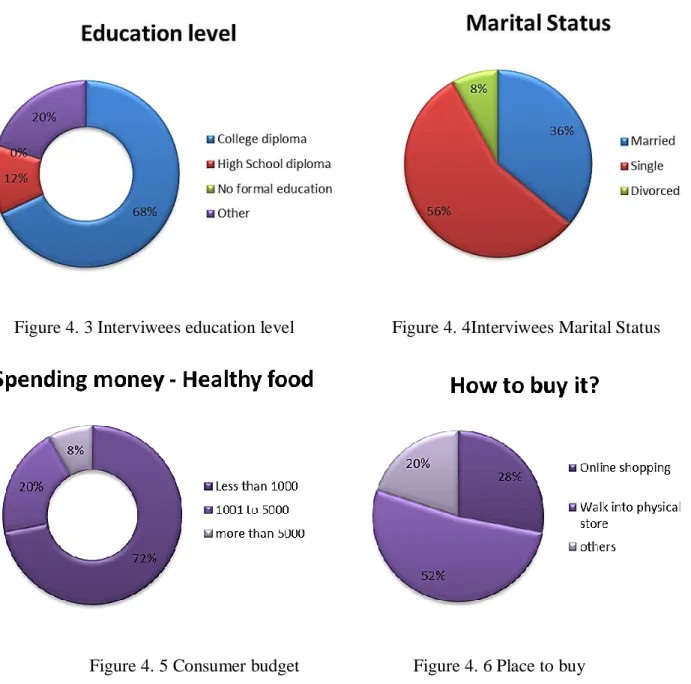
(31) Chapter 4 Results and Discussion 4.1 Descriptive Statistics To analyze the part A and B of the questionnaire a table is made to find out its descriptive statistics searching for the more influenced variables in terms of frequency. Is important to remind that Part A of the questionnaire is used to collect interviewee’s background and Part B is related to the subjects’ impression about the sweetener after trying the product. In this way the major findings are described below.. 4.1.1 Part 1-A: The findings are summarized and shown from Figures 4-1 to 4-6. The majority in 72% of the interviwees is female and 44% are between 41 to 50 years old. Most subjects (68%) have college diploma.The marital status shows 56% are single. 72% of the interviwees are spending less than 1000 per month to buy health foods which cover suplements, vitamins, functional, sugar-free, probiotic, organic, etc., and of which 52% buy these kind of products directly in a physical store.. Figure 4. 1 Interviwees Gender. Figure 4. 2 Interviewees Age. 24.
(32) Figure 4. 3 Interviwees education level. Figure 4. 4Interviwees Marital Status. Figure 4. 5 Consumer budget. Figure 4. 6 Place to buy. 4.1.2 Part 1-B: With respect to the “Feelings from all aspects about Hecodulc products”, the findings are summarized and presented from Figure 4.7 to Figure 4.12. Majority in all aspects is revealed. It was found that 48 % of the interviewee has no idea about what the product looks like, and 60 % use sugar to sweet their beverage, food, etc (Figure 4-8). This indicates that the Hecodulc Products is quite new to Taiwan’s consumers. 92 % of the interviewees can find a difference between the sample with hecodulc drops and the sample without hecodulc drops, and for 84 % of the. 25.
(33) interviewees says that the sample with hecodulc drops is sweet. 76 % of the interviewee do not think the product has a metallic flavor, and 40 % cares more about the benefits and quality rather than price and taste for these kind of products. Finally, 88 % of the interviewee find that the package is convenient, as shown in Figure 4-13.. Figure 4. 7 Package’s impression. Figure 4. 8 Way to sweet their beverage, etc. Figure 4. 9 Differentiation between samples. 26. Figure 4. 10 Is it sweet?.
(34) Figure 4. 11 Differentiation between samples. Figure 4. 12 Is it sweet?. Figure 4. 13 Differentiation between samples 4.2 Hypothesis Test To conduct the data analysis for part C of the interview data, the research thesis employs multiple and linear regression to modeling the relationship between a scalar response and its explanatory variables, which is made up of the relationships between the independent and dependent variables. The data pre-processing contains (1) sorting the interview questions with. 27.
(35) each hypothesis, (2) converting all data from the linguistic data to numerical values, (3) tabulating data, and (4) calculating the average if there is more than one question per hypothesis. The relationship between each hypothesis and questions are described in the Table 3.1.. Table 4. 1 Hypothesis and Survey Questionnaire relationship. Hypothesis. Interview Questions. H1: Attitude toward product is positively and Q9 I think nature-made-products are worthy to buy significantly associated with buying willingness. Q10 I am willing to buy the Hecodulc products H2. Perceived health is positively and Q1 I like to do exercises to maintain health significantly associated with Attitude Q2 I like to eat healthy to maintain an average toward product. weight. H3 Packaging attraction is positively and Q3 I like to buy the product that has attractive significantly associated with Attitude packaging toward product. H4 Trust of product Ad is positively and Q4 My decision to purchase is influenced by significantly associated with Attitude advertisement. toward product. Q5 I trust on the message given by the advertisement H5 Perceived brand loyalty is positively and Q6 I think brand image is important when I buy significantly associated with Attitude food products toward product. H6. Perceived quality is positively and Q7 I think quality is an important criteria when I significantly associated with Attitude buy food products toward product. Q8 It is important for me to buy high-quality food products. As aforementioned in previous Chapters, the path model of this study has two main parts. On the one hand, the first part is constituted by five independent variables, they are: Perceived Health, Packaging Attraction, Trust of product Ad, Perceived Brand Loyalty, and Perceived Quality, which are associated with the attitude. On the other hand, the second part measure the relationship between the attitude toward buying willingness of Hecodulc products. Thus, one multiple and one linear regression has been applied on this research study. The multiple regression to test the hypothesis H2, H3, H4, H5 and H6, and the linear regression to test the hypothesis H1. As in any other empirical study it is important to determine the reliability and validity of the variables related to the factors in order to analyze the structural model, in this case which is an exploratory study a significant level of 10 % is using to test how strong is the 28.
(36) relationship, if there is any, which is equivalent to p<0.1 significant. The outcomes of the regression models are shown as follow. Table 4. 2 R square & Significance F of H2 to H5 Regression Statistic R Square. 0.58175662 ANOVA. Significance F. 0.003292753. Table 4. 3 T-statistics and P-value of H2 to H6 T-Statistics. P-value. Perceive Health. -0.303016205. 0.765170228. Packaging Attraction. -1.25060557. 0.226261104. Trust of product Ad. 0.401554643. 0.69249251. Perceived Brand Loyalty. 1.844825662. 0.080710311. Perceived Quality. 2.770922712. 0.012169626. Table 4. 4 R square & Significance F of H1 Regression Statistic R Square. 0.006248715 ANOVA. Significance F. 0.707216023. Table 4. 5 T-statistics and P-value of H1. Attitude toward Buying Willingness. 29. T-Statistics. P-value. 0.38029482. 0.707216023.
(37) The coefficient of determination R Square indicates how much of the variation in the dependent variables are explained by the independent variable, meaning that it tells how well the model fits the data. When coefficient of determination are greater than 0.1 means that the dependent latent variables are significant (Falk and Nancy, 1992). Therefore, from Table 4-2 the R Square value for the multiple regression is greater than 0.1 which means that the 5 independent variables Perceived Health, Packaging Attraction, Trust of product Ad, Perceived Brand Loyalty, and Perceived Quality substantially explain the variation in the dependent variable (attitude toward products). However, the R Square value for the linear regression is lower than 0.1 which means that the independent variable (attitude toward products) does not explain the variation in dependent variable (buying willingness). The significance F (or p-value) is the probability that the null hypothesis in the regression cannot be rejected. In other words, it is the probability that our regression model is wrong and needs to be discarded. According to the Table 4-2 the significance F value for the multiple regression is much smaller than 0.1, which means that this model is right. Opposite, the linear regression, where the significance F value is greater than 0.1, indicating that the probability of null hypothesis in the regression model cannot be rejected, that means that variance produced by the model is not high enough to the error. The p-value is the probability of obtaining a result as or more extreme than the one gotten in a random distribution. In view of this it is better the p-value be as small as possible in reference to the significance level. Note that the p-value is similar in interpretation to the significance F, and the key difference is that the p-value applies to each corresponding coefficient and the significance F applies to the entire model as a whole (Rodas, 2020). The p-value is given in the Table 4-3, which indicates that the hypothesis H1, H2, H3, and H4 are not significant due to their values are greater than the significance level 0.1, while the hypothesis H5 and H6 are significant due to their values are lower than the significance value 0.1.. 30.
(38) Table 4. 6 A summary of hypothesis testing p-value. Result (*p<0.1). Significant / Not Significant. 0.707216023. 0.70 > 0.1. Not significant. 0.765170228. 0.76 > 0.1. Not significant. 0.226261104. 0.22 > 0.1. Not significant. 0.69249251. 0.69 > 0.1. Not significant. 0.080710311. 0.080 < 0.1. Significant. 0.012169626. 0.012 < 0.1. Significant. Hypothesis H1: Attitude toward product is positively and significantly associated with buying willingness. H2: Perceived health is positively and significantly associated with Attitude toward product. H3: Packaging attraction is positively and significantly associated with Attitude toward product. H4: Trust of product Ad is positively and significantly associated with Attitude toward product. H5: Perceived brand loyalty is positively and significantly associated with Attitude toward product. H6 Perceived quality is positively and significantly associated with Attitude toward product.. Significance level: 0.1 4.3 Discussion and Implications Overall, from the previous regression analysis it can be concluded that the measurement model shows that the latent variables Perceived Brand Loyalty and Quality are significant, explaining or supporting the Attitude Taiwanese have toward Hecodulc. However, the linear regression also shows the attitude does not support or is not significant to explain the buying willingness. The overall testing results are illustrated in Figure 4-14.. 31.
(39) Figure 4. 14 Hypothesis testing results In the linear regression model, the independent factor (attitude) is not a significant predictor of buying willingness. This implies that the Hypothesis H1 is rejected because its p-value is higher than 0.1. This could be explained as follows. First, new products usually remain many unknowns, although quite positive attitude (mean=6.16), but still needs more confidence to lead to buying willingness. As the findings from the multiple regression, brand loyalty and perceived quality are critical for Taiwanese consumer preferences, The Hecodulc is an unknown brand and people do not have buying willingness because they do not have ideas about its quality and brand as in Paraguay. Second, most Taiwanese do not cook, so for them it is not a necessity to buy one of these products, and if they want to keep a diet, they just buy healthy food. Finally, when the respondents tried the samples with Hecodulc drops, they claimed it was too sweet. Some people just prefer to avoid the consumption of sugar than use sweeteners like Hecodulc. For the multiple regression, two out of five independent factors are significant (brand and quality). In the case of perceived health, packaging attraction and trust of product ad do not present significant predictors of the attitude due to its p-value is higher than 0.1. This implies that the hypothesis H2, H3 and H4 are rejected. This could be explained because Taiwanese mostly associate healthy food with trying to avoid fried and processed food, eat more vegetables and watch the portion size instead of thinking in including a sweetener in their diet. Taiwanese consumers prefer to avoid sugar instead of trying to replace it. In this way, despite the fact that Taiwanese care about healthy life style (mean=4.36),. 32.
(40) they do not associate sweetener as a main product for this purpose. For healthy food market, Taiwanese appreciate most about other attributes, like benefits and quality, taste, and easy to get and use. For other side, the packaging seems not attractive to them because they see no relationship between the Hecodulc package and sweetener. Most of them have no idea what kind of product it is by looking at it and they think it is a juice or some sweet beverage. Literature reports reveal that the key variables measuring consumer characteristics are perceived quality, perceived risk and familiarity, price consciousness that influence attitude and purchase intention in Taiwan (Lin, 2010). This might explain why packaging attraction is not significant to explain the attitude for this case. Brand loyalty refers to an experience in which a consumer uses a product from a brand that previously provided consumer satisfaction, thereby generating repeat purchasing behavior. In summary, it is the combination of a consumers’ behavioral loyalty and attitudinal loyalty toward a brand. Generally, Taiwanese consumers pay more attention to the brand recognition and reputation, as well to the feedbacks and recommendation than advertisements. The evidence that the decision to purchase is lightly influenced by advertisement and they do not trust much on the message given by the advertisement. They become immune and even annoyed, with the numerous ads that fill online display space (Chen Et. Al, 2015). Prior studies have identified various consumer perceptual variables like perceived quality, price, value, familiarity or brand recognition, smart-shopper self-perception and perceived risk associated with purchase behaviors (Hoch and Banerji 1993, Richardson 1996, Burton 1998, Sinha 1999, Garretson Fitcher 2002, Erdem et al 2004, Jin and Suh 2005 among others). This signifies that consumer perception toward brand, price, risk and quality are the most important reasons for purchasing in Taiwan. Brand recognition or familiarity enhance confidence in one’s ability to have specific skills in judging the criteria needed to evaluate product quality and to avoid those products that may fail to meet specific consumption requirements. Studies confirmed that familiarity with a brand has an influence in consumer confidence toward a brand, which in return, affect the attitude toward the brand (Rao & Monroe 1998). This indicates that as Taiwanese buyers familiarity with the product increase their beliefs about price-quality relationship increases (i.e. recognize brand are associated unconsciously with good quality). Moreover, when a consumer is familiar with a brand their 33.
(41) concern for the safety will reduce and they will be more focusing on price benefits; in other words brand recognition likely leads to higher perceived quality, lower perceived risk and higher prices consciousness. The research finding has confirmed that consumer brand loyalty and recognition affect the attitude toward products. According to the Nielsen’s’ survey of loyalty (Ching Et Al. 2015), Taiwan’s consumers claimed to be completed loyal or more loyal to financial institution 77 %, mobile service provider 75 % and cable or internet service providers 74%. In the other hand alcoholic beverage 45%, carbonate beverage 48 % and cereal brands 53 % were the categories Taiwanese consumers reported feeling the least loyal to. Nielsen report also shows that better price 37 % and better quality 35 % are the key attributes that will encourage Taiwanese consumers to switch brands. The previous information support that Taiwanese people have a high level of brand loyalty. The research survey conducted in this study also confirms that brand recognition is important when Taiwanese consumers buy food products. Quality perception is one of the critical elements in a purchase decision. When consumers perceive a brand to be of better quality they may have higher purchase intention toward the brand. Previous literature consistently represented a positive relation between perceived quality and purchase behavior. The improvement in perceived quality resulted in more positive attitude toward purchase behavior and increased the likelihood of purchase (Well Et. Al, 2007). Baltas and Argouslidis (2007) implied that the quality improvement of purchase behavior is particularly effective in creating consumer demand. The primary determinant of purchase behavior success is the ability to deliver an acceptable level of perceived quality. Nowadays the quality of purchase behavior can be very close to brand leader and some costumers have found them as good as the manufacturer brands. The current study supports the previous information showing that for the Taiwanese respondents the quality is an important determinant when they buy food product, then it is important for them to buy high quality food products. With part B question 12 of the questionnaire the respondents appreciate the most benefit and quality (40 %) for these kind of products (sweetener).. 34.
(42) Chapter 5 Conclusion In previous chapters, this study utilizes an empirical analysis to explore the factors associated with buying willingness of Taiwanese consumers with Hecodulc. The used data was collected by a survey applied to Taiwanese people to get their opinions to determinate the influence of the defined factors. The research contributions, suggestions, and future research are addressed below:. 5.1 Research Contribution First, as defined in previous chapter consumer behavior as “the dynamic interaction of affect, cognition, behavior, and the environment by which human beings conduct the exchange aspects of their lives”. Precisely, consumer behavior involves the thoughts and feelings people experience and the actions during consumption processes. As the research model suggests, the dynamic interaction among Taiwanese consumers focuses mainly on perceived brand loyalty and perceived quality. These are key factors for Taiwanese consumer’s attitude toward the Hecodulc product. They trust in a solid and well recognized brand or perceived quality when shopping. Second, perceived health, and packaging and advertisement do not have a significant impact on Taiwanese consumer attitude toward the Hecodulc product, due to mainly they regard healthy products as sweeteners. Price, quality and brand are the main influences when choosing what to buy. Finally, the attitude toward this product (Hecodulc) is not significantly associated with buying willingness. Despite Taiwanese consumers are aware of the importance of healthy habits, as diet, exercise, etc., Hecodulc sweetener is a new product, thus, remains many unknowns around its quality, benefits, brand, etc. Therefore, potential customers still need more confidence to lead to buying the product.. 5.2 Research Suggestions This research concludes that lack of familiarity of brand recognition as well as perceived quality are the main reasons the attitude toward new products does not lead their buying willingness. Unlike Paraguayan people, Taiwanese consumers have limited or any experience with 35.
(43) this product, Hecodulc. In this regard, to allow the success of Hecodulc launched in Taiwan, the company should enhance some promotional activities, such as offering free samples or testing at the sales point to provide consumers with an opportunity to try the product, familiarize themselves with it and evaluate the quality of the brand. Another interesting marketing strategy is that they could create a partnership with a recognized brand on Taiwan in this industry, healthy food, to sell Hecodulc.. 5.3 Limitations and Future Studies This study provides insights into the relationship between seven key variables including perceived health, packaging attraction, trust of product advertisement, perceived brand loyalty and perceived quality, the attitude toward the product and the buying willingness. However, the natural complexity of consumer’s decision process makes difficult to construct a theory which can exactly explain or predict consumer’s choices. This study, for example, does not consider the effects from uncontrollable factors (e.g. economic and cultural factors). Moreover, this study finds that brand loyalty and perceived quality as the key factors that influence the attitude and buying willingness of Taiwanese consumers. This finding has important managerial implications and future research should also attempt to apply the model in other Asian countries to determinate if there is any correlation to Asian consumers’ willingness to buy this kind of product (sweetener). Finally, the concept of the consumer’s preference of Taiwanese market could be applied on any industry. This research has restricted itself to healthy food category, more exactly sweeteners, as well as including a specific brand and product, due to the interest that Heisecke as a Paraguayan industry which is launched Hecodulc in Taiwan. However, it would be useful and interesting to apply this research model to other products with different characteristics (e.g. clothing) and focus on the different performance among the same factors influence. .. 36.
(44) References Abdurrahman I., & YASAR M. (2015). Effects of Brand on Consumer Preferences: A study in Turkmenistan.. Eurasian. Journal. of. Business. and. Economics.. 8.. 139-150.. 10.17015/ejbe.2015.016.08.. Amin Et. Al (2017). Stevia Rebaudiana: A Potential Boon for Human Health. Department of Medical Biology, Ömer Halisdemir University, Turkey. Bagozzi R. (2018) On the Concept of Intentional Social Action in Consumer Behavior, Journal of Consumer Research, Volume 27, Issue 3, Pages 388–396.. Burton, S., Lichtenstein, D. R., Netemeyer, R. G. and Garretson, J. A. (1998), A Scale for Measuring Attitude Toward Private Label Products and an Examination of Its Psychological and Behavioural Correlates, Journal of the Academy of Marketing Science, Vol. 26, No.4, pp. 293306.. Chen, L., Wang, M, Cheng, J. and Kuntjara, H. (2015). Consumer involvement and brand loyalty in services: Evidence from the commercial airline industry in Taiwan. IJSS. 4. 437-452. 10.1504/IJSS.2008.020058.. Ching-Hsien S., Yao-Tsung K, and Shue-Tien J. (2015) A Study on the Relationship between Brand Trust and the Customer Loyalty based on the Consumer Aspects. Department of Business Management, Mei--Ho Institute of Technology, Taiwan. Constantinos Et. Al, (2019). Global marketing in business-to-business contexts: Challenges, developments, and opportunities. Industrial Marketing Management, Volume 78, Pages 102-107. Cuervo-Cazurra, A. and Genc, M.E. (2014). Obligating, pressuring, and supporting dimensions of the environment and the non-market advantages of developing-country multinational companies. Journal of Management Studies, 48, pp. 441–455.. 37.
數據

+7
相關文件
中國春秋時期 (The period of Spring and Autumn in China) (770-476BC).. I am from the state of Lu in the Zhou dynasty. I am an official and over 60 years old. Her name is Yan
Had I the heaven’s embroidered cloths, Enwrought with golden and silver light, The blue and the dim and the dark cloths Of night and light and the half-light,. I would spread the
• If the cursor scans the jth position at time i when M is at state q and the symbol is σ, then the (i, j)th entry is a new symbol σ
• If the same monthly prepayment speed s is maintained since the issuance of the pool, the remaining principal balance at month i will be RB i × (1 − s/100) i. • It goes without
• If the same monthly prepayment speed s is maintained since the issuance of the pool, the remaining principal balance at month i will be RB i × (1 − s/100) i.. • It goes
and Kasper, H.D.P., “The impact of Satisfaction on Brand Loyalty: Urging on Classifying Satisfaction and Brand Loyalty,” Journal of Consumer Satisfaction, Dissatisfaction
This shows that service quality, perceived value, DM advertising, customer satisfaction and loyalty have become important issues on business management.. Therefore, the
The analytic results show that image has positive effect on customer expectation and customer loyalty; customer expectation has positive effect on perceived quality; perceived
