顧客滿意度─以智慧型手機使用者為研究 - 政大學術集成
122
0
0
全文
(2) 顧客滿意度─以智慧型手機使用者為研究 Customer Satisfaction- The Case Study of Smartphone Users. 研究生:李婉如. Student: Wan-Ju Li (Judy Li). 指導教授:吳文傑. Advisor: Jack Wu. 國立政治大學. 學. ‧ 國. 立. 政 治 大. ‧. 商學院國際經營管理英語碩士學位學程 碩士論文. er. io. sit. y. Nat. A Thesis. n. a to International MBA Program Submitted iv l C n U NationalhChengchi University engchi. in partial fulfillment of the Requirements for the degree of Master in Business Administration. 中華民國一○二年六月 June 2013.
(3) ACKNOWLEDGEMENT. First, I would like to thank my entire family for supporting my education and research at National ChengChi University. Second, I deeply appreciate my advisor, Professor Jack Wu, who consistently provided insightful guidance and willingness to coach me to complete this research project.. 政 治 大 Erasmus University; and ESCP 立 Europe in Paris for providing me with the skills and education. In addition, thanks to National ChengChi University, Rotterdam School of Management,. ‧ 國. 學. knowledge to complete this document.. ‧. I was fortunate enough to have the support from the individual respondents who gave their time and input to this study. My deepest gratitude to my MBA classmate, Jan Jaap Braam,. y. Nat. io. sit. who assisted me in the statistical analysis. Finally, I would like to thank you to my good. n. al. er. Dutch friend, Hugo Van Der Helm, who gave me strong faith and support while I was studying in Rotterdam.. Ch. engchi. i. i n U. v.
(4) ABSTRACT Customer Satisfaction- The Case Study of Smartphone Users By Wan-Ju Li (Judy Li) Today, smartphone has defined as an important tool in our daily lives; the market has been growing every year and the future global smartphone shipment is predicted to be nearly 1. 政 治 大 family only, but also productivities, 立 entertainments and multimedia functions (e.g. music, billion in 2015. The function of smartphone is no longer limited to make calls to friends and. ‧ 國. 學. ringtones, games, web browsing, text messages and camera) provided by smartphone itself.. ‧. With the increasing competitions in the smartphone market, smartphone companies find it difficult to retain the existing customers and increase the market share. In that context, the. y. Nat. io. sit. objective of this research explanatory study aims to identify the main factors that determine. er. the customer satisfaction of smartphone users.. al. n. v i n C hby 285 smartphone completed e n g c h i U users. The study survey was. who helped evaluating their. smartphone satisfaction; the data was analyzed by IBM SPSS Statistics 20 and the results revealed the main findings are (1) image has high correlations with customer expectation, customer satisfaction and customer loyalty; (2) customer expectation has high correlations with perceive quality, perceived value and customer satisfaction; (3) perceived quality has high correlations with perceived value and customer satisfaction; (4) perceived value has a high correlation with customer satisfaction; (5) Customer satisfaction has a high correlation with customer loyalty; (6) the proposed model TCSI is proven with the effectiveness in explaining the relationships among image, customer expectation, perceived quality, perceived ii.
(5) value, customer satisfaction and customer loyalty for smartphone users. The conclusion of this study provides valuable information for smartphone producers, especially Taiwanese brand HTC, to develop the smartphones meet with customers’ expectations and satisfactions.. 立. 政 治 大. ‧. ‧ 國. 學. n. er. io. sit. y. Nat. al. Ch. engchi. iii. i n U. v.
(6) TABLE OF CONTENTS. 1.1.. Problem Background .............................................................................................. 3. 1.2.. The Importance of Research ................................................................................... 4. 1.3.. Purpose ................................................................................................................... 5. Overview of Customer Satisfaction Indexes (CSIs) ........................................................... 7 2.1.. 2.4.. European Customer Satisfaction Index (ECSI) .................................................... 13. 2.5.. Taiwan Customer Satisfaction Index (TCSI) ........................................................ 14. 學. 2.3.. 治 政 Swedish Customer Satisfaction Barometer (SCSB) 大 ............................................... 8 立 American Customer Satisfaction Index (ACSI) ................................................... 10. 2.2.. ‧. Literature Review ............................................................................................................. 16. y. Nat. Brand Image ......................................................................................................... 16. 3.2.. Customer Expectation .......................................................................................... 17. 3.3.. Customer Perceived Quality ................................................................................. 19. 3.4.. Perceived Value .................................................................................................... 20. 3.5.. Customer Satisfaction ........................................................................................... 22. 3.6.. Customer Loyalty ................................................................................................. 24. io. 3.1.. sit. 3.. Customer Satisfaction Index (CSI) ......................................................................... 7. n. al. er. 2.. Introduction ........................................................................................................................ 1. ‧ 國. 1.. 4.. Ch. engchi. i n U. v. Research Method & Hypotheses ...................................................................................... 26 4.1.. Image Effects ........................................................................................................ 26. 4.2.. Customer Expectation Effects .............................................................................. 27. 4.3.. Perceived Quality Effect ....................................................................................... 29. 4.4.. Perceived Value Effects ........................................................................................ 29. iv.
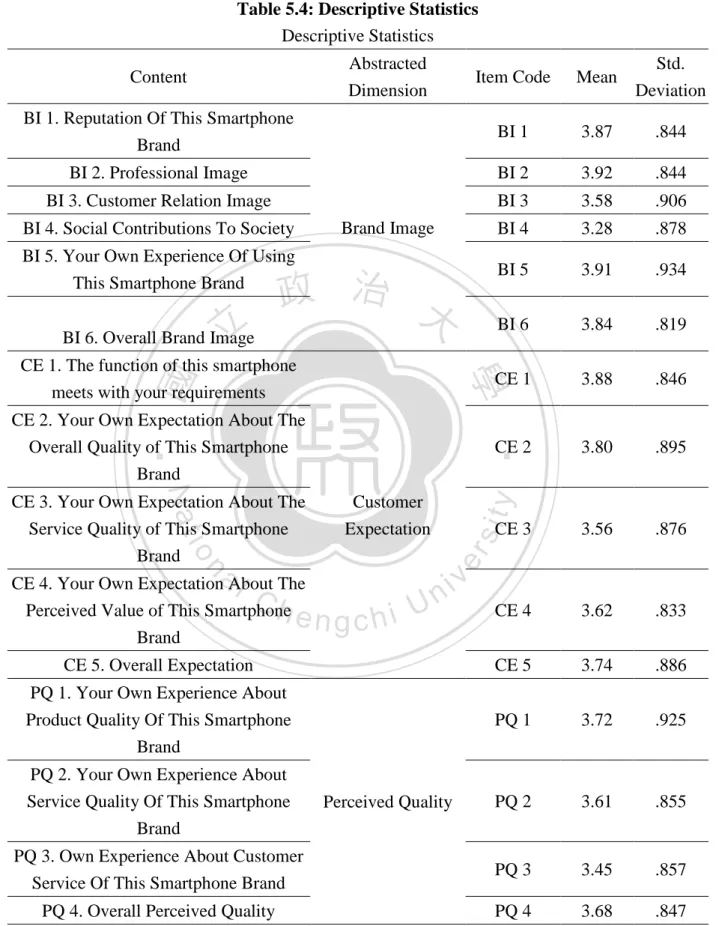
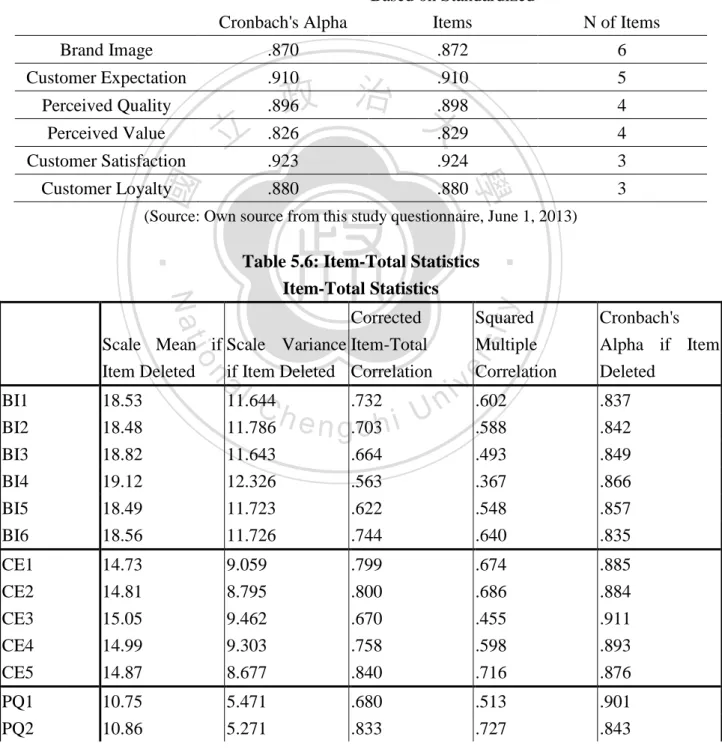
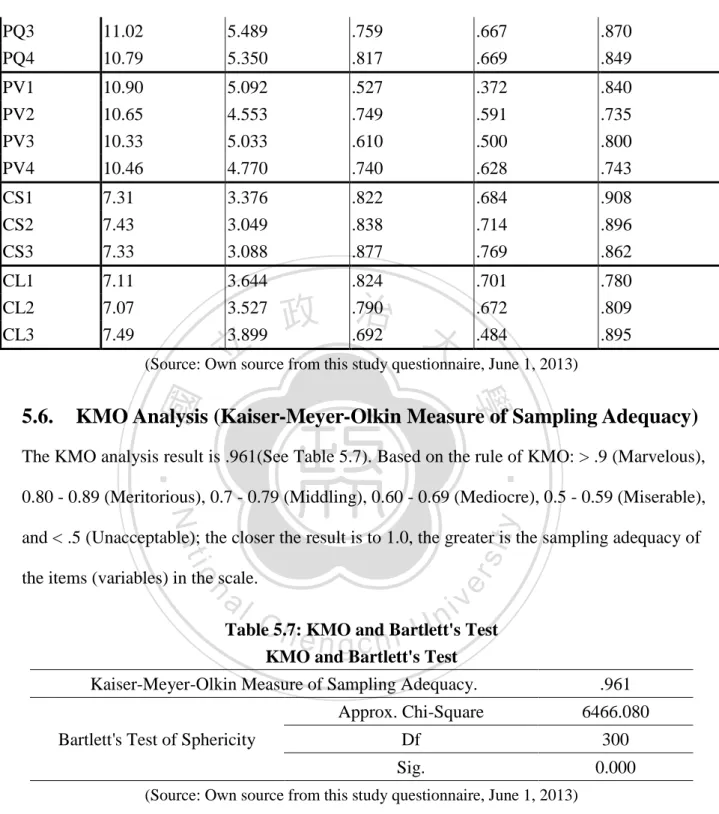
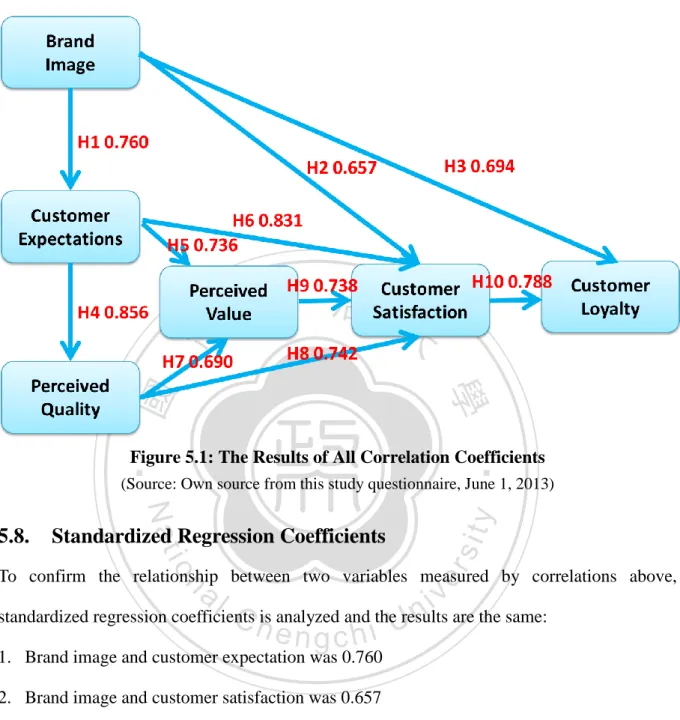
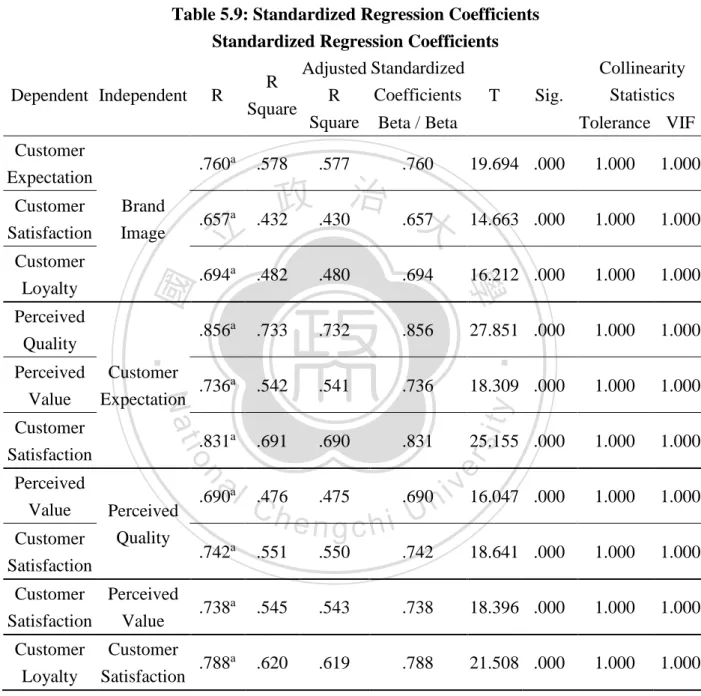
(7) 4.5.. 5.1.. Questionnaire Design ........................................................................................... 31. 5.2.. Sample & Data Collection .................................................................................... 32. 5.3.. Statistical Analysis ................................................................................................ 33. 5.4.. Descriptive Statistics ............................................................................................ 39. 5.5.. Reliability Analysis .............................................................................................. 41. 5.6.. KMO Analysis (Kaiser-Meyer-Olkin Measure of Sampling Adequacy) ............. 43. 5.7.. Pearson Correlations ............................................................................................. 43. 5.8.. Standardized Regression Coefficients .................................................................. 46. 5.9.. Further Analyses ................................................................................................... 48. 立. 政 治 大. 學. ‧. 6.. Measurement & Limitations of the Study ........................................................................ 31. ‧ 國. 5.. Customer Satisfaction Effects .............................................................................. 30. Discussion & Conclusion ................................................................................................. 53. y. Nat. sit. WORKS CITED LIST ............................................................................................................. 56. n. al. er. io. REFERENCE ........................................................................................................................... 59. i n U. v. APPENDIX .............................................................................................................................. 76. Ch. engchi. v.
(8) LIST OF TABLES Table 5.1: The Cost of Respondent’s Current Smartphone ...................................................... 34 Table 5.2: Respondents’ Ideal Smartphone Cost ...................................................................... 35 Table 5.3: Respondents Who Do Not Know HTC is a Mobile Brand from Taiwan ................ 37 Table 5.4: Descriptive Statistics ............................................................................................... 40 Table 5.5: Reliability Statistics ................................................................................................. 42 Table 5.6: Item-Total Statistics ................................................................................................. 42 Table 5.7: KMO and Bartlett's Test .......................................................................................... 43. 治 政 Table 5.9: Standardized Regression Coefficients ..................................................................... 47 大 立 Brand & Consider HTC on Next Buy Cross Tabulation ...... 48 Table 5.10: Current Smartphone Table 5.8: Pearson Correlations ................................................................................................ 44. ‧ 國. 學. Table 5.11: Nationality & the Opinions about HTC Smartphones Cross Tabulation ............... 50 Table 5.12: Nationality & Current Smartphone Brand Cross Tabulation ................................. 51. ‧. Table 5.13: Nationality & Consider HTC on the Next Smartphone Purchase Cross Tabulation .................................................................................................................................................. 52. Nat. sit. y. Table 1.1: The Ownership of Smartphone in Asia Pacific........................................................ 57. io. er. Table 1.2: Top Five Converged Mobile Device Vendors, Shipments and Market Share, 2009 57 Table 1.3: Top Five Smartphone Vendors, Shipments and Market Share, 2012 Q3 ................ 58. n. al. Ch. engchi. i n U. v. LIST OF THE FIGURE Figure 2.1: Swedish Customer Satisfaction Barometer (SCSB) ................................................ 9 Figure 2.2: American Customer Satisfaction Index (ACSI) ..................................................... 12 Figure 2.3: European Customer Satisfaction Index (ECSI) ..................................................... 14 Figure 2.4: Taiwan Customer Satisfaction Index (TCSI) ......................................................... 15 Figure 5.1: The Results of All Correlation Coefficients ........................................................... 46. vi.
(9) 1. Introduction In April 1973, the first handheld mobile phone was created by Dr. Martin Cooper, a Motorola research and executive; this first handheld mobile phone weighed 2.5 pounds, 9 inches long, 5 inches deep and 1.75 inches wide; talking time was 30 minutes and needed 10 hours to be re-charged. Through the development in the past 40 years, innovative technology has improved the way. 政 治 大 part of our lives. According立 to comScore, Inc., the most popular function among U.S. mobile we communicate with our family and friends. Today, mobile phones have become an integral. ‧ 國. 學. subscribers is making text messages at 68.6 percent; followed by web browsing at 38.6 percent, application downloading at 37.3 percent, social networking at 27.3 percent, playing. Nat. y. ‧. games at 25.7 percent, and listening to music at 17.9 percent [1].. io. sit. In 1993, the first smartphone IBM Simon was introduced, and then the first Nokia’s. n. al. er. smartphone was released in 1996 [2 & 3]. Ever since that, the innovations of smartphone. Ch. i n U. v. continue to be developed; and the increasing smartphone growth has led the mobile phone. engchi. market into a whole new competition. Kevin Restivo, senior research analyst with IDC's Worldwide Quarterly Mobile Phone Tracker, stated on his twitter account that “mobile phone users around the world are turning in their 'talk-and-text' devices for smartphones as these devices allow users to perform daily tasks like shopping and banking from anywhere. The growth trend is particularly pronounced in emerging markets where adoption is still in its early days. As a result, the growth in regions such as Asia/Pacific and Latin America will be dramatic over the coming years” [4]. Indeed, smartphone companies have tried adding more functions to the smartphone for 1.
(10) encouraging users to shift from mobile phones to smartphones. Marketing researchers Pitt et al. (2011) stated that smartphone is not just a simple mobile phone; rather it has an extensive data storage capacity and processing power. Today, new smartphone models weigh around 140-250 grams which can be fitted into our pocket easily and very light to be carried around. Smartphone is our personal digital assistant (PDA); a mini version of our personal computer which allows us to operate data storage, memo program, e-mails and web browsing easily. Smartphone has moved the data processing power to in the hands of mobile users, who can. 政 治 大. use the mobile device irrespective of time and space (Pitt et al., 2011). A recent Google study. 立. on the mobile movement indicates that the most common of smartphone usage is browsing. ‧ 國. 學. the internet at 81 percent, researching at 77 percent, and watching videos at 48 percent. On this study, it also finds that 72 percent of smartphone users consume other media through their. ‧. smartphones; and 93 percent owners use their smartphones at home [5].. sit. y. Nat. io. er. Taiwan has been booming in the smartphone market over the last few years, this increasing growth has generated more smartphone demands and more competitions. According to the. al. n. v i n International Data Corporation (IDC), in Taiwan’s overall mobile phone C h smartphone usage engchi U. market was only 3% in 2004; but the rapid growth has jumped to 9% in 2008, 12% in 2009,. and 25% in 2010 [6]. In 2012, Nielsen research in Taiwan conducted a smartphone study and the result indicates the ownership of smartphone in Asia Pacific has reached to another high level; 67% of mobile phone users in Korea own smartphones, 66% in China, 65% in Australia, 58% in Hong Kong and 50% in Taiwan (Table 1.1). This rapid growth has resulted in more smartphone choices offered by smartphone companies as they are trying to attract more customers and increase their market share; more phone functionalities will be added, data plan cost will be reduced and more competitive selling prices to be offered. The smartphone. 2.
(11) ownership number will only grow up a lot of more in the coming future, and the International Data Corporation (IDC) forecasts smartphone vendors will ship nearly 1 billion by the end of 2015 [7].. 1.1.. Problem Background. Thanks to the fast growth of the mobile communication market and innovative technology, the smartphone demand is increasing every year; and the future global smartphone shipment. 政 治 大 large, only the companies provide the products meet with consumers’ satisfactions would 立. is predicted to be nearly 1 billion in 2015 [5]. In spite of the potential growth in the future is. become the leading brands in the industry.. ‧ 國. 學. According to the press release of International Data Corporation (IDC), Nokia is eliminated. ‧. from the list of top 5 leading smartphone vendors in 2012; the first time Nokia does not make. sit. y. Nat. it to the list since the inception of IDC’s Mobile Phone Tracker in 2004 [8]. American. n. al. er. io. business magnate Mr. Warren Buffett once said “Your premium brand had better be delivering. v. something special, or it’s not going to get the business”. The competition of smartphone. Ch. engchi. i n U. market has changed dramatically since Apple introduced the first iPhone at the Macworld Conference & Expo in 2007; Apple iPhone created many new innovations for other smartphone manufacturers to follow; for example, iPhone was the first smartphone introduced true touch-focused function [9]. Today, the smartphone market has dominated by Apple and Samsung; however, Samsung’s global market share was only 3.3 percent which was behind HTC and listed as the fifth place based on the survey of the International Data Corporation (IDC) in 2009 [10] (Table 1.2). The recent IDC press release states that Samsung has become the new leading smartphone vendor. 3.
(12) contributing 22.7 percent global smartphone shipments; and this market share percentage is almost 10 percent more than Apple’s 13.8 percent and double more than HTC’s 10.3 percent [8] (Table 1.3). Based on these IDC reports, the biggest challenge for smartphone companies nowadays is to find out the key factors that effect on customer satisfaction; because customer satisfaction can decrease complaints and increase loyalty (Gronholdt et al., 2000; Johnson et al., 2001); and. 政 治 大 (Anderson and Sullivan, 1993). Furthermore, Aaker (1997) proved that loyal customers can 立 customer satisfaction can have an important impact on customer’s repurchasing behavior. help companies to have higher market share and reduce the operating cost.. ‧ 國. 學. 1.2.. The Importance of Research. ‧. Globalization has changed the way how smartphone companies operate their business today;. Nat. sit. y. it allows consumers have more smartphone choices from all over the world easily. For. n. al. er. io. smartphone producers, globalization also means more competitions to compete with; and. i n U. v. more difficulties to keep customers retention. With technology improving at a fast pace,. Ch. engchi. smartphone producers are facing the challenges to keep up with customer needs and distinguish themselves from the competitors. Bendapudi and Berry (1997) argued that if a company offers differentiated services that are difficult for a competitor to match or to provide with equivalents, or if few alternative competitors exist in the market, customers tend to remain with the existing company. In addition, Marchand (2003) claimed that companies that do not offer services in keeping with the technological trend ultimately end up losing the client to a competitor that does offer the service. In today’s challenging economy and competitive business world, every successful company. 4.
(13) knows the importance of customer retention. Loyalty is often interpreted as actual retention (Gustafsson et al, 2005), and many empirical studies have pointed out that two factors impact on customer loyalty are to delight customers (Lee, Lee, and Feick, 2001; Oliver, 1999) and to deliver superior value derived from excellent services and quality products (Parasuraman and Grewal, 2000). Keeping your customer happy is more cost effective than finding new customers because it costs five times more to acquire a customer than to retain a customer (Keiningham T., Vavra T., Aksoy L. and Wallard H., 2005). In addition, Emmett and Mark. 政 治 大. (2002) found out that a 2% increase in customer retention has the same effect on profits as. 立. cutting costs by 10%; and a 5% reduction in customer defection can increase profits by 25–. ‧ 國. 學. 85% (Frederick and Sasser, 1980).. ‧. Reichheld (2001) believes the longer customers stay in relationship with the company, the. sit. y. Nat. more value the company generates. Therefore, the most important task and challenge for the. io. er. smartphone producers now is finding the factors that meet with customer satisfaction and increase the customer loyalty. In addition, many marketing researches have pointed out that. al. n. v i n expectations, and C h perceived quality engchi U. brand image, customer. perceived value have strong. influences on customer satisfaction (Aaker, 1991; Rory, 2000; Anderson et al., 1994; Clemes et al., 2008; Cronin et al., 2000). These factors are all the antecedents in Taiwan Customer Satisfaction Index (TCSI); therefore, Taiwan Customer Satisfaction Index (TCSI) will be present as the measurement to evaluate the relations.. 1.3.. Purpose. The purpose of this study is to use Taiwan Customer Satisfaction Index (TCSI) to find out the key factors that affect the customer satisfaction of smartphone users; and analyze how to improve the current smartphone products and services to fulfill the customer satisfaction. 5.
(14) Another purpose of this research is to provide Taiwanese smartphone brands and companies with a reference to make improvements based on the result of this study.. 立. 政 治 大. ‧. ‧ 國. 學. n. er. io. sit. y. Nat. al. Ch. engchi. 6. i n U. v.
(15) 2. Overview of Customer Satisfaction Indexes (CSIs) This chapter, the basic framework of Customer Satisfaction Index (CSI) will be presented first and followed by the general information of 3 important Customer Satisfaction indexes (CSIs) in the history which are Swedish Customer Satisfaction Barometer (SCSB), American customer satisfaction index (ACSI), and European Customer Satisfaction Index (ECSI). The final section, our own national index - Taiwan Customer Satisfaction Index (TCSI) will be discussed.. 2.1.. 政 治 大 Customer Satisfaction 立 Index (CSI). ‧ 國. 學. Cardozo (1965) was the first scholar pointing out the concept of customer satisfaction; and he believed that customer satisfaction may result in more repeated purchase from customers. In. ‧. 1989, the first nation-level measurement system of customer satisfaction - Swedish Customer. sit. y. Nat. Satisfaction Barometer (SCSB) was established; it soon became a great tool for companies to. n. al. er. io. evaluate their performance and measure the customer satisfaction. The success of SCSB. v. model has encouraged more countries to create their own Customer Satisfaction Index (CSI);. Ch. engchi. i n U. the American customer satisfaction index (ACSI) was introduced in 1994; and the European Customer Satisfaction Index (ECSI) was created in 2000. Since the establishment of SCSB, Customer Satisfaction Index (CSI) has attracted a great attention of marketing researchers; more and more empirical researches have focused on customer satisfaction (e.g. Anderson, 1996; Oliver, 1997; Hennig-Thurau and Klee, 1997); and some researchers have defined Customer Satisfaction Index (CSI) as good predictors for companies’ market value (e.g. Eklof et al., 1999) and profitability (Fornell, 1992; Anderson et al., 1994, 1997; Eklof et al., 1999; Reichheld and Sasser, 1990).. 7.
(16) Till today, many countries have developed their own National Customer Satisfaction Index (NCSI) according to their own national situations; some examples are German Barometer, Norwegian Customer Satisfaction Barometer (NCSB), Swiss Index of Customer satisfaction (SWICS), Korean Customer Satisfaction Index (KCSI), Malaysian Customer Satisfaction Index (MCSI), and Chinese Customer Satisfaction Index (CCSI). The CSI model is a cause-and-effect relation between the antecedents and consequences; and. 政 治 大 quality, perceived value, and image) to measure overall customer satisfaction which is 立. each CSI model consists of different latent variables (e.g. customer expectation, perceived. demonstrated as the main core of the CSI framework. More details of Customer Satisfaction. ‧ 國. 學. Barometer (SCSB), American customer satisfaction index (ACSI), European Customer. ‧. Satisfaction Index (ECSI) and Taiwan Customer Satisfaction Index (TCSI) are presented in. y. sit. n. al. er. Swedish Customer Satisfaction Barometer (SCSB). io. 2.2.. Nat. the following context.. i n U. v. Sweden was the first country in the world to have a national measurement instrument of. Ch. engchi. customer satisfaction and evaluations of quality of products and services. (Martensen, Gronholdt, Eskildsen, and Kristensen, 2000). In 1989, Fornell and his colleagues in Michigan University helped Sweden build the first nation-level measurement system of customer satisfaction - Swedish Customer Satisfaction Barometer (SCSB); it was the first national customer satisfaction index for domestically purchased and consumed products and services (Fornell, 1992). Since then, SCSB has been adopted and adapted for using in the United States, known as American Customer Satisfaction Index (ACSI) (Fornell, Johnson, Anderson, Cha, and Bryant, 1996).. 8.
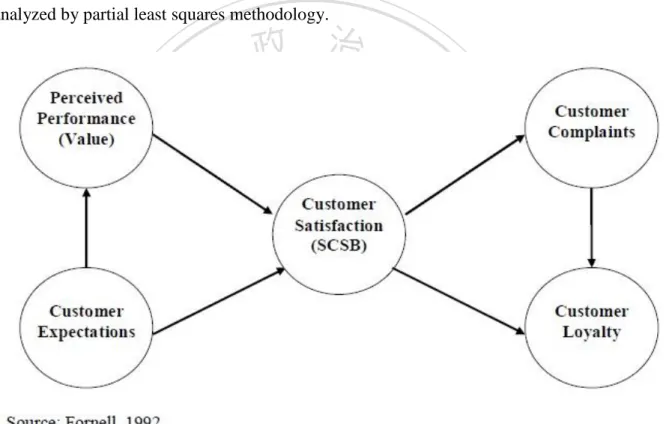
(17) Swedish Customer Satisfaction Barometer (SCSB) enables to make comparisons of satisfaction measurement result between companies and industries; approximately 130 companies from 32 of Sweden’s largest industries are involved and data is collected annually. Each year, around 25,000 customers from 32 leading industries are contacted via telephone interview during an eight-minute survey questionnaire; customers evaluated their satisfactions with organizations offerings on the brand level by 10 point scale and the survey results are analyzed by partial least squares methodology.. 立. 政 治 大. ‧. ‧ 國. 學. n. er. io. sit. y. Nat. al. Ch. engchi. i n U. v. Figure 2.1: Swedish Customer Satisfaction Barometer (SCSB) According to Fornell (1992), the original SCSB model contains two primary antecedents of satisfaction: 1) perceptions of a customer’s recent performance experience with a product or service; and 2) customer expectations about the performance. The perceived performance related to price and quality; and the customer expectation can be defined as customer predicts. The first driver “perceived performance (value)” is described by two measures: a) Quality Given Price; and b) Price Given Quality; perceived performance is evaluated by comparing 9.
(18) the product quality versus price paid; and price paid versus the product quality. Fonell (1992) believed that perceived performance is expected to positively impact on customers’ satisfactions; when the perceived performance increases, the satisfaction levels will be also increased. The other antecedent of satisfaction is “expectations”, which defined as what customers expect from the product performance. Expectations play an important role in SCSB model. 政 治 大 (Johnson, Gustafsson, Andreessen, Lervik & Cha, 2001) argued that expectations shall have 立 because expectations forecast a company’s ability to provide future performance. Researchers. positive influences on satisfaction; also expectations should be positively related to perceived. ‧ 國. 學. performance (value).. ‧. The consequences of satisfaction in the original SCSB model are derived from Hirschman’s. Nat. sit. y. (1970) exit-voice theory. In his book Exit, Voice and Loyalty (1970), Hirschman argued that. n. al. er. io. when a consumer is dissatisfied with the products or services that an organization provides, he. i n U. v. can have three basic reactions: 1) He could remain loyal and hope the organization to provide. Ch. engchi. some reward in exchange or hope the situation will be improved in the future, 2) He could demand a better product by raising voice, 3) He could exit and look for better products or services from the competitors. Based on this exit-voice theory, the authors of the SCSB model suggest that, if the company develops proper complaint handling system, the company may be turning complaining customers into loyal customers successful; or complaining customers will choose to exit.. 2.3.. American Customer Satisfaction Index (ACSI). In 1994, the American customer satisfaction index (ACSI) was established; the model was. 10.
(19) based on the original SCSB model specification; and produced through a partnership of the University of Michigan Business School, CFI Group, and the American Society for Quality. The National Quality Research Center (NQRC) at Michigan’s Ross School of Business is the research and production center, also data analyzing and report writing for index. CFI Group provides software design and marketing consulting; published reports and news releases are handled by American Society for Quality (ASQ).. 政 治 大 government service - the U.S. Postal Service and the Internal Revenue Service; and more than 立 Today, the overall ACSI score factors from more than 230 companies in 47 industries; 2 local. 100 services, program, and websites of federal government agencies. Each company or. ‧ 國. 學. government service, industry, and sector is measured annually; over 200 organizations and a. ‧. random sample of approximately 250 of the organization’s customers are involved in the. sit. y. Nat. survey. Respondents are asked by a total of 15 survey questions which rated on 1 to. io. n. al. er. 100-points scales point scales (Johnson et al, 2001).. Ch. engchi. 11. i n U. v.
(20) 立. 政 治 大. ‧. ‧ 國. 學 sit. y. Nat. io. n. al. er. Figure 2.2: American Customer Satisfaction Index (ACSI). v. ASCI is a benchmark for companies to compare with other companies in their own or other. Ch. engchi. i n U. industries. Fornell (2001) stated that ACSI is predictive of corporate performance, growth in the Gross Domestic Product (GDP), and changes in consumer spending. ACSI measures ten economic sectors in the North American Industry Classification System (NAICS) that produce products and services sold directly to household customers. These sectors are: (1) Utilities, (2) Manufacturing/Nondurable Goods, (3) Manufacturing/Durable Goods, (4) Retail Trade, (5) Transportation and Warehousing, (6) Information,(7) Finance and Insurance, (8) Health Care and Social Assistance, (9) Accommodation and Food Services, and (10) Public Administration; the sectors included in ACSI produce 66% of the GDP.. 12.
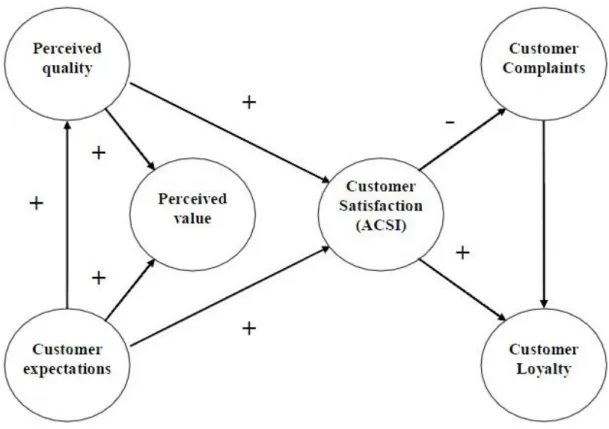
(21) The ACSI model is a cause-and-effect model which has 3 antecedents for overall customer satisfaction: perceived quality, perceived value, customer expectations; and customer loyalty and customer complaint as consequences. The major difference in between ACSI and SCSB models is that perceived performance (value) construct used in SCSB model is replaced by two separate constructs perceived quality and perceived value in ACSI model. Perceived quality is evaluated by the product quality; and perceived value is measured by the product price which impact on customers’ satisfaction.. 2.4.. 政 治 大 European Customer Satisfaction Index (ECSI) 立. Since 1998, the success of Swedish Customer Satisfaction Barometer (SCSB) has inspired the. ‧ 國. 學. European Union to develop a comparative system of national satisfaction index which allows. ‧. companies, industries and countries within Europe to make comparisons.. Nat. sit. y. The first survey of ECSI model was created and tested in 1999; more than 50,000 customers. n. al. er. io. from 11 European countries anticipated in the survey study. The survey only included. i n U. v. telecommunications (both fixed line and mobile telephone), retail banking and supermarkets. Ch. engchi. as the industry sectors; but only telecommunication was included in all participating markets (Juhl, Kristensen and Ø stergaard, 2002). In 2000, the European Customer Satisfaction Index (ECSI) was developed by the European Organization for Quality (EOQ) and the European Foundation for Quality Management (EFQM); the establishment of ESCI model allows European companies to evaluate their performance on national, European, and global levels.. 13.
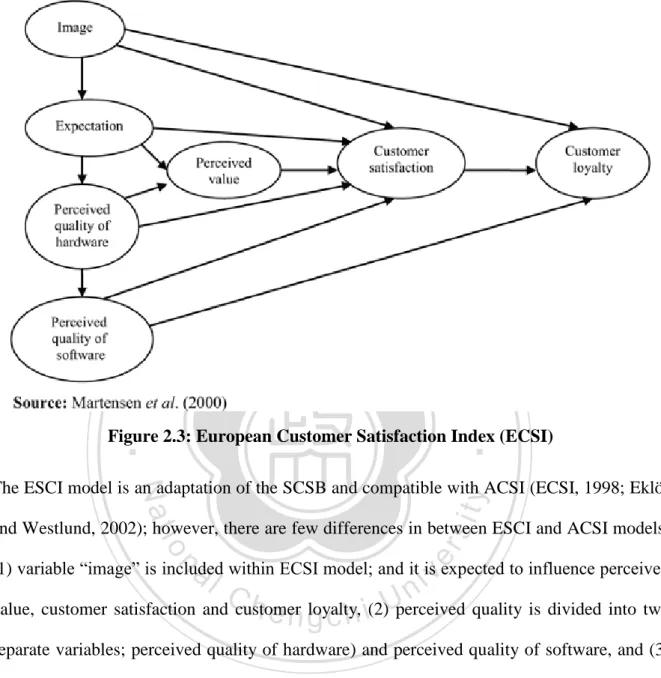
(22) 立. 政 治 大. ‧ 國. 學 ‧. Figure 2.3: European Customer Satisfaction Index (ECSI). sit. y. Nat. The ESCI model is an adaptation of the SCSB and compatible with ACSI (ECSI, 1998; Eklöf. al. er. io. and Westlund, 2002); however, there are few differences in between ESCI and ACSI models:. v. n. (1) variable “image” is included within ECSI model; and it is expected to influence perceived. Ch. engchi. i n U. value, customer satisfaction and customer loyalty, (2) perceived quality is divided into two separate variables; perceived quality of hardware) and perceived quality of software, and (3) Customer complaint is not included within ECSI model.. 2.5.. Taiwan Customer Satisfaction Index (TCSI). Taiwan Customer Satisfaction Index (TCSI) is developed by Taiwan Customer Satisfaction Index Research Center of Chung Hua University and Taiwan Customer Satisfaction Research Committee (TCSRC) of Chinese Society for Quality (CSQ). The concept of TCSI is based on the framework of American Customer Satisfaction Index (ACSI) and European Customer. 14.
(23) Satisfaction Index (ECSI) (Lee et al., 2005); the TCSI model provides the objective quality index in Taiwan, allow the national companies to follow up the standard reference. National Quality Research Center (2005) stated that the customer expectation and perceived quality of TCSI are using the same principle of customer expectation and perceived quality at ACSI model. However, the perceived value, customer satisfaction and customer loyalty of TCSI model are following based on the constructs at ECSI model (Kristensen et al., 2000).. 立. 政 治 大. ‧. ‧ 國. 學. n. er. io. sit. y. Nat. al. Ch. engchi. i n U. v. Figure 2.4: Taiwan Customer Satisfaction Index (TCSI) In this study, Taiwan Customer Satisfaction Index (TCSI) is selected as the indicator to measure customer satisfaction of smartphone users.. 15.
(24) 3. Literature Review Over the past decades, many marketing researchers have proposed numerous empirical studies which explain what motivates customer satisfaction. There are many factors can help organization to increase customer satisfaction, however, this review will only focus on four major variables which are presented at Taiwan Customer Satisfaction Index (TCSI); these variables are brand image, customer expectations, perceived quality and perceived value. After these antecedents, customer satisfaction and customer loyalty will be presented.. 3.1.. 立. Brand Image. 政 治 大. ‧ 國. 學. In the service marketing literatures, brand image has been defined as an important factor in the overall evaluation of the service and company (Grönroos 1984; Gummesson and Grönroos. ‧. 1988; Bitner 1991; Andreassen and Lindestad 1997); the construct of brand image was first. sit. y. Nat. introduced in the Norwegian Customer Satisfaction Barometer (NCSB) model (Andreassen &. n. al. er. io. Lindestad, 1998a; Andreassen & Lindestad, 1998b). Keller (1993) stated that brand image is. v. the perceptions of an organization reflected in the associations held in consumer memory; and. Ch. engchi. i n U. Assael (1998) proposed that brand images are developed when customers have experienced the quality of products or services companies provide, or based on friends’ opinions. Brand image is an important component of customer satisfaction model (Martensen et al., 2000); and some market researches proved that brand image has a direct effect on value (e.g., Kristensen et al., 1999; Martensen et al., 2000). According to Porter and Claycomb (1997), a positive brand image can encourage customers to re-purchase from the companies; and other researchers Lee et al (2005) proposed the similar theory that brand image has a strong impact on customers’ buying behaviors. Ahmend (1991) found out that a strong and clear brand. 16.
(25) image can increase consumer confidence and convince consumers to purchase, and Simon (2011) claimed that the stronger the brand’s position is in the consumers’ mind, the more essential source of differentiation it becomes, and this is a fundamental competitive advantage. In addition, Martenson (2007) stated that customers to a favorable brand image might affect perception of store brand. For smartphone users, Knapman (2012) believes consumers are strongly influenced by brand. 政 治 大 are familiar with, it can be a brand has high exposure and widely recognized among the target 立. when it comes to choosing Smartphone; because consumers usually go for a brand which they. audiences, it can be a brand has special features than other competitors, or it can be a brand is. ‧ 國. 學. well-known for its competitive pricing.. ‧. 3.2.. Customer Expectation. sit. y. Nat. Globalization has changed today’s business environment; the market competitions has. n. al. er. io. become intensively and increasingly from both domestic and foreign smartphone producers. v. which result in higher expectations from the customers. Customers’ expectation is what the. Ch. engchi. i n U. customers wish to receive from the service; understanding and accommodating customers’ high expectation requires constant progress in service quality from smartphone producers to attract their customers to stay loyal. Marketing researchers Zeithaml et al. (2006) proposed customer expectations are beliefs about a service delivery that serve as standard against which performance is done; customer expectation is the results of prior experience with the company’s products (Türkyilmaz et al 2007), it involves many factors and complex considerations, including their own pre-purchase beliefs, previous experience with other companies, and learning from advertisement,. 17.
(26) customers’ psychological condition at the time of service delivery, customer background and values, the images of the purchased product, and other people’s opinions. Different customers have different expectation about the same product; and the different expectations can be influenced by pre-purchase beliefs, individual needs, customers’ own experiences, word of mouth communications and other personal attitudes. Customers’ expectations are important driver in the service quality formation process; and. 政 治 大 economic psychology (Oliver, 1997), consumer economics (Muth, 1961; Lovell, 1986), 立 consumers’ expectations have been an important topic of study in many other fields such as. retailing (Swan and Trawick, 1980), pricing (Della and Monroe, 1974), and satisfaction. ‧ 國. 學. (Fornell et al, 1996). The fulfillment of a consumer’s expectation is a key factor in the. ‧. consumer’s satisfaction, and may indirectly influence the consumer’s intention to repurchase. sit. y. Nat. from the same seller (Kim, Ferrin and Rao, 2003).. n. al. er. io. Lin and Wu (2011) found out that customers who are not satisfied with the received services. i n U. v. would not be expected to have long run relationships with the company. For developing. Ch. engchi. customer satisfaction, reliability in the providing of services and commitment to service relationships a company must attempt to increase customers’ future expectations. Organizations that listen and exceed customers’ expectations will succeed and maximize sales and market share; ultimately, it will be rewarded with customer loyalty and profitability. To stay competitive in the smartphone industry, producers must constantly strive to improve their products and quality to meet with customers’ expectations. Researchers (Hines, Silvi and Bartolini, 2002) suggested that companies should integrate customer expectations into their supply chain designs. In other words, management should be able to understand how their. 18.
(27) customers perceive them and whether their performance meets these expectations (Hill, Brierley and MacDougall, 2003).. 3.3.. Customer Perceived Quality. In recent years, perceived quality has been the subject of considerable interest by both practitioners and researchers, mainly in services marketing (Cronin and Taylor, 1992; Parasuraman, Zeithaml and Berry 1996). Marketing researchers Aaker (1991) and Zeithaml. 政 治 大 rather, it is the consumers’ judgment about an entity’s or a service’s overall excellence or 立. (1988) proposed that perceived quality is not the actual quality of the brands or products;. superiority; and perception of brand quality is determined by individual customers (Cole,. ‧ 國. 學. Robert and Flynn, 2009).. ‧. Aaker (1991) pointed out that perceived quality has direct impacts on the consumers’. Nat. sit. y. purchase decision and brand loyalty, specifically when a consumer is not able to research the. n. al. er. io. specific product in depth. High estimation of perceived quality does not only justify to the. i n U. v. consumers a premium price for the brand, but it can also be used for brand extension, as the. Ch. engchi. high quality the brand is known for in one market can be extended to a different marketplace. Nowadays, the concept of perceived product quality has become an important marketing tool for companies to differentiate themselves from competitors; more and more academic scholars and marketing practitioner have already emphasized the importance of perceived product quality because it is the consumers’ perception of overall components of products and good perceived product quality may result in customers’ satisfactions. According to Zeithaml (1988), the perceived quality is (1) different from objective or actual quality, (2) a higher level abstraction rather that a specific attribute of a product, (3) a global assessment that in some. 19.
(28) cases resembles attitude, and (4) a judgment usually made within a consumer’s evoked set. Perceived quality can affect a willingness to buy; and the price that customers will pay (Cole, Robert and Flynn, 2009). Some researchers stated the concept of perceived product quality not only affects the purchase intention of the consumer but also affects the market share, brand profitability, brand power, and brand equity (Garvin, 1984; Jacobson and Aaker, 1987; Aaker and Jacobson, 1994; Stobart, 1994). Chaudhuri (2002) claimed the perceived quality. 政 治 大 expectation. To understand the customers’ perception about the quality of their service, 立 may lead to consumer satisfaction, which is determined by perceived performance and. companies must measure customers’ satisfaction with their products and services; and deliver. ‧ 國. 學. quality service is considered an essential strategy for success and survival in today's. ‧. competitive environment (Zeithaml, and Berry 1985; Dawkins and Reichheld 1990;. y. sit. n. al. er. Perceived Value. io. 3.4.. Nat. Parasuraman, Reichheld and Sasser 1990; Zeithaml, Parasuraman, and Berry 1990).. i n U. v. One of the most cited definitions of perceived value is presented by Zeithaml (1988); he. Ch. engchi. defined perceived value as “the consumer’s overall assessment of the utility of a product based on what is received and what is given”; the concept of perceived value has gained its importance in the recent year because perceived value not only effects on consumer purchasing behavior but also provide important strategic marketing plans for the success of companies. More and more industrial marketing researchers had studied perceived value because it is the essential result of marketing activities (Metcalf, Frear and Krishman, 1992; Anderson, Jain and Chintagunta, 1993; Parasuraman, 1997; Ravald and Grönross, 1996; Lapierre, 2000;. 20.
(29) Walter, Ritter and Germünden, 2001; Ulaga and Chacour, 2001, Eggert and Ulaga, 2002; Flint, Woodruff and Gardial, 2002; Ulaga and Eggert, 2003; Woodall, 2003; Anderson and Narus, 2004; Leonidou, 2004; Lindgreen and Wynstra, 2005; Ulaga and Eggert, 2006; Eggert, Ulaga and Schultz, 2006). Researchers (Dodds, Monroe, and Grewal, 1991; Cronin, Brady, Brand, Hightower, and Shemwell, 1997; Grewal, Monroe, and Krishnan, 1998; Cronin, Brady, & Hulf, 2000; Oh, 2003) argued that perceived value is the price paid which related to the level of product quality; and it is identified as a construct configured by two major approaches; one. 政 治 大. is benefits received (economic, social and relationship) and the other is sacrifices made (price,. 立. time, effort, risk and convenience) by the customers.. ‧ 國. 學. Recently, a new approach based on the conception of perceived value as a multidimensional. ‧. construct is supported by some marketing researchers (De Ruyter, Wetzels, Lemmink, and. sit. y. Nat. Mattson, 1997; Woodruff, 1997; DeRuyter, Wetzels, and Bloemer, 1998; Sinha and DeSarbo,. io. er. 1998; Rust, Zeithaml, and Lemmon, 2000; Sweeney and Soutar, 2001); this new approach enables us to overcome some issues from the traditional approach to perceived value,. al. n. v i n particularly its excessive concentration Also, this new approach echoes C h on economic utility. engchi U. the new theoretical developments in the area of consumer behavior, referring to the role played by feelings in buying and consumption habits. Holbrook (1994) stated that customer value is the fundamental basis for all marketing activity; perceived value is a major tool to help the service provider to gain a better competitive position in the market (Naumann 1995; Woodruff 1997; Parasuraman 1997; Stahl, Barnes, Gardial, Parr and Woodruff 1999; Huber, Herrmann and Morgan 2001); and Fonell et al. (1996) pointed out that as the impact of value increased relation to quality, price is a more important determinant of satisfaction. To sum up, customer perceived value is an important 21.
(30) factor used to predict customers’ behavioral intentions and preferences; and perceived value is considered to be a source of gaining competitive advantages.. 3.5.. Customer Satisfaction. In the past decades, many countries had already developed their national indicators for examining consumers’ satisfaction such as The Swedish Customer Satisfaction Barometer (SCSB) in 1989, the American Customer Satisfaction Index (ACSI) in 1994, the Norwegian. 政 治 大 (SWICS) in 1998, the ECSI in 2000; and later the KCSI, CCSI, TCSI, etc. These national 立. Customer Satisfaction Barometer (NCSB) in 1996, the Swiss Customer Satisfaction Index. indicators allow companies to understand customers’ evaluations and satisfactions about the. ‧ 國. 學. quality of the products and services they supply. Customer satisfaction plays an important role. ‧. and is often discussed in marketing literatures; customer satisfaction is crucial for all business. y. Nat. organizations in today’s competitive business environment, because it can have a positive. er. io. sit. impact on customer’s retention, loyalty and intention to repurchase. Customer satisfaction is defined as an evaluation of the perceived discrepancy between prior expectations and the. al. n. v i n actual performance of the product Wilton, 1988, Oliver 1999); satisfaction can also C(Tse h eand ngchi U be described as a fulfillment response of service and an attitude change as a result of the consumption. In previous studies, marketing researchers Anderson, Fornell and Mazvancheryl (2004) stated that it is costly to generate satisfied and loyal customers but that would prove profitable in a long run for a firm. The similar study was done by Eshghi, Haughton and Topi (2007); and they found out that satisfied customers can help the brands to build long and profitable relationships with their customers. In addition, some marketing scholars proved that satisfied customers are more likely to remain their loyalty by committing to an organization which 22.
(31) eventually leads to profits (Reichheld and Sasser, 1990; Heskett, Jones, Loveman, Saaser and Schlesinger, 1994; Heskett, Sasser and Schlesiner, 1997). According to Deng et al. (2009), the ability of a service provider to create high degree of satisfaction is crucial for product differentiation and developing strong relationship with customers. Customers’ satisfaction with products and services of a company is considered as most important factor leading toward competitiveness and success (Hennig-Thurau and Klee,. 政 治 大 customers from complaining, but more importantly it meets and even exceeds customers’ 立 1997). Kotler & Keller (2006) proposed that customer satisfaction does not only prevent. expectation. In addition, many empirical studies have shown that customer satisfaction helps. ‧ 國. 學. companies to increase future revenues (Bolton, 1998; Fornell, 1992), reduces future costs. (Reichheld. and. Sasser,. 1990). and. decreases. ‧. transactions. price. elasticity. y. Nat. (Anderson,1996). Therefore, it is important for organizations to understand the key factors. n. al. er. io. service.. sit. drive customers’ satisfaction and increase the customer loyalty of company product or. Ch. engchi. i n U. v. Oliver (1997) stated customer satisfaction can be described as a judgment that a product or service provides pleasurable consumption; therefore, smartphone producers shall measure customers’ satisfaction with their products and services if they would like to understand the customers’ perception about the quality of their products and service. Another great motivation for smartphone producers to focus on customers’ satisfaction is that higher customer satisfaction can lead to a stronger competitive position resulting in higher market share and profit (Fornell, 1992). In this study, customer satisfaction is defined as “the process of customer overall subjective evaluation of smartphone products and service delivered by smartphone producers against his/her expectation or desires over a time period”. 23.
(32) 3.6.. Customer Loyalty. Customer loyalty is defined as a behavioral measure; it is customers’ willingness to maintain their relations with a particular organization, service or product. (Kim and Yoon, 2004). In the consumer marketing community, customer loyalty has been considered as an important goal for companies (Reichheld and Schefter, 2000). Service organizations strive to maintain a superior quality of service in an effort to gain customer loyalty (Parasuraman, Zeithaml and Berry, 1996) because customer loyalty is one of the key drivers of customer retention process. 政 治 大. which will help a company sustains its long-term success. Therefore, building and. 立. maintaining customer loyalty has been an important marketing theory and practice because. ‧ 國. 學. the competitive advantages can be offered to the companies (Gommans et al., 2001).. ‧. Today, companies are seeking solutions to increase customer loyalty of their organization. sit. y. Nat. because loyal customers make more purchase than non-loyal customers and they tend to have. io. er. higher customer retention (Reichheld and Sasser, 1990). In addition to higher customer retention and higher spending, Zeithmal (2000) argued that loyal customers are more likely to. al. n. v i n help organizations to gain newC customers by strong word-of-mouth and business referral. hengchi U Aaker (1997) also pointed out that loyal customers can help companies to have higher market. share and reduce the operating cost; and loyal customers are less price sensitive which brings more sales for the company compared to non-loyal customers because loyal customers are willing to purchase frequently, try different products or services, and bring new customers to the companies (Reichheld and Sasser, 1990). In 1990, Reichheld and Sasser found that a 5% increase in customer retention increases a firm's profits at a range between 25% and 85%; and Raphel and Raphel (1995) pointed out that the cost of creating a new customer is 5-9 times greater than the cost of maintaining an 24.
(33) old customer. The similar study was examined by Frederick (2001) and he proved that the longer customers stay in relationship with the company, the more value the company generates; the customer profitability rate over the life of a retained customer tends to increase annually by up to 20 %. Researchers Gupta et al. (2004) claimed that a 1% improvement in the customer retention rate improves firm value by 5%. Many other researchers had emphasized the benefits of customer retention (Bendapudi and. 政 治 大 (2006) proposed that excellence in service quality is a key to achieve customer loyalty, which 立. Berry, 1997; Johnson et al., 2001; Libai et al., 2002; Johnson and Selnes, 2004); and Ehigie. is the primary goal of business organizations, due to the advantages of customer retention.. ‧ 國. 學. Berger and Nasr (1998) stated that the period of time a relationship maintained is one of. ‧. fundamental factors determining the value that the customers provide to the firm. To reach. sit. y. Nat. customer retention, companies should manage satisfaction and consequences of customer. io. er. loyalty (Naranyandas, 1998). Therefore, the most important task and challenge for all the smartphone producers now is customer retention and loyalty.. n. al. Ch. engchi. 25. i n U. v.
(34) 4. Research Method & Hypotheses In this study, Taiwan Customer Satisfaction Index (TCSI) is the main model to measure customer satisfaction; TCSI consists of different variables that analyze the cause-and-effect relations between the antecedents and consequences of customer satisfaction. To measure the case-and-effect relations of TCSI model, IBM SPSS Statistics 20 will be selected for the further understanding of analyzing statistical data.. 政 治 大 are developed in order. Based on the previous sections, objectives of this study and theoretical basis of the TCSI. 立. model, 10 different hypotheses. to have an understanding of. ‧. 4.1.. ‧ 國. effects.. 學. smartphone users’ satisfaction and the hypotheses are developed based on the following. Image Effects. y. Nat. io. sit. Brand image is considered as important factor in establishing and maintaining loyalty among. n. al. er. customers; several studies had shown the important effects of brand reputation and brand. i n U. v. image in the customer’s buying behavior (Zeithaml, 1981). Wu (2011) stated brand image has. Ch. engchi. been assessed as an important antecedent of customer satisfaction and loyalty; a positive corporate brand image not only helps companies to increase competition but also encourages consumers to re-purchases (Porter and Claycomb, 1997). Aaker (1991) and Rory (2000) both pointed out customers would likely to increase the satisfaction of usage and recommend the good corporate image brands to others; similar theory was reported by De Chertanony and Harris (2000) that the positive corporate brands help companies achieving higher performance, such as sales. Gensch (1978) stated brand image has big impacts on the purchase intention and the customer 26.
(35) satisfaction; the more customers consider a brand valuable, the more sales can be expected to be achieved. Davies et al. (2003) conducted a research study on the relationship between corporate brand image and customer satisfaction; and the result was positive; other searchers Johnson et al. (2001) also found that consumers more favorable the image has higher perceived in quality, value, satisfaction and loyalty. Bloemer & Ruyter (1998) reported that brand image acts as a mediator of satisfaction; and. 政 治 大 loyalty is related to customer satisfaction directly. Their study proved that the brand image has 立 customer satisfaction is the result from different attributes of a brand’s image, also customer. the direct impacts on its customer’s satisfaction and loyalty. Aydin and Zer (2005) claimed the. ‧ 國. 學. major antecedents of customer loyalty are brand image, perceived service quality, trust and. ‧. customer switching costs; and loyal customers may buy more, accept higher prices and have a. sit. y. Nat. positive word-of-mouth effect. In addition, Johnson et al. (2001) stated brand image affect. io. er. customer behavioral intentions such as customer loyalty. Other researchers (Loughlin and Coenders 2002; Kristensen, Martensen and Gronholdt 2000; Bloemer and Schroder 2002). al. n. v i n also support the same theory thatCcorporate image is predictor of loyalty. In line with existing hengchi U researches, three hypothesizes related image are created:. H1: Image has a high correlation with customer expectation H2: Image has a high correlation with customer satisfaction H3: Image has a high correlation with customer loyalty. 4.2.. Customer Expectation Effects. Service quality is a measurement of the level of how well the service matches the customer expectation (Lewis & Booms, 1983). More and more marketing researchers have been. 27.
(36) emphasized on perceived service quality; Zeithaml (1998) claimed that perceived service quality is defined as the customer’s assessment of overall performance of service. Parasuraman et al. (1985, 1988) considered the customer’s assessment of overall service quality depends on the gap between customer expectation and perception of actual performance of service. Chaudhuri (2002) argued the perceived quality may lead to consumer satisfaction, which is determined by perceived performance and expectation.. 政 治 大 lures away a customer from a competitor; perceived value not only influences customers at 立. Rust and Oliver (1994) claimed that ultimately it is perceived value that attracts a customer or. the pre-purchase stage but also affects customers’ satisfactions, intention to recommend and. ‧ 國. 學. return behavior at the post purchase phase (Dodds, Monroe and Grewal 1991; Parasuraman. ‧. and Grewal 2000; Petrick 2001).. sit. y. Nat. Customer expectations are consequences of pervious experiences with company’s products or. n. al. er. io. services; customer expectations play as an important performance indicator for companies to. v. understand whether their company products or service has met or exceeded customers’. Ch. engchi. i n U. expectations. Anderson et al. (1994) stated that customer expectations’ construct is anticipated to have a direct and positive relationship with customer satisfaction. In addition, other marketing researchers Farris et al. (2010) claimed that expectations are a key factor behind customers’ satisfactions. Based on the statements by previous researchers, this study would like to know whether customer expectation would have positive effects towards perceived quality, perceived value and customer satisfaction. Thus, the following hypothesizes would be: H4: Customer expectation has a high correlation with perceived quality. 28.
(37) H5: Customer expectation has a high correlation with perceived values H6: Customer expectation has a high correlation with customer satisfaction. 4.3.. Perceived Quality Effect. Perceived quality is the consumer judgment over the general excellence or over product superiority (Zeithaml 1988); and perceived value is defined from the perspectives of money, quality, benefit, and social psychology. In previous studies, many researchers had pointed out. 政 治 大 Teas and Agarwal, 2000), and the relationship between both concepts is positive. Other 立 that higher perceived quality typically leads to higher perceived value (Sweeney et al., 1999;. empirical studies also reported that service quality will positively influence perceived value. ‧ 國. 學. (Cronin et al., 1997; Cronin et al., 2000; Brady et al., 2001; Bauer et al., 2006).. ‧. According to Anderson et al. (1994), customer satisfaction is more influenced by the. Nat. sit. y. perceived quality than perceived price. A similar research conducted by Clemes et al. (2008). n. al. er. io. also indicated that perceived service quality affects customer satisfaction more than the. i n U. v. perceived price. Taken together, the above discussion indicates that perceived quality is likely. Ch. engchi. to have significant effects on perceived value and customer satisfaction. Therefore, the following hypotheses are established: H7: Perceived quality has a high correlation with perceived value H8: Perceived quality has a high correlation with customer satisfaction. 4.4.. Perceived Value Effects. According to Cronin et al. (2000), perceived value has effects on satisfaction and customer loyalty; also Eggert and Ulaga (2002) discovered that perceived value positively influences customer satisfaction in most cases of conventional retailers. In addition, marketing 29.
(38) researchers Schiffman and Kanuk (2004) reported that the overall objective of providing value to customers continuously and more effectively than competitors is to have and to retain highly satisfied customers. In telecommunication sector, Lin and Wang (2006) and Tung (2004) found positive relationship among perceived value and customer satisfaction. Therefore, based on the evidences given above, the next hypothesis is developed: H9: Perceived value has a high correlation with customer satisfaction. 4.5.. 政 治 大. Customer Satisfaction Effects. 立. Oliver (1997) reported customer satisfaction is an important driver to customer loyalty and the. ‧ 國. 學. success of businesses; and customer satisfaction has been widely studied as a predictor of customer loyalty (Fornell et al., 1996: Cronin et al., 2000; Yang and Peterson, 2004). Many. ‧. marketing researchers (Anderson and Sullivan 1993: Gronholdt, Martensen and Kristensen,. Nat. sit. y. 2000; Anderson and Mittal, 2000; Rust, Zahorik and Keiningham 1995; Gustafsson and. n. al. er. io. Johnson 2002) had studied the relationship between satisfaction and loyalty; and the results. i n U. v. supported that customer satisfaction had strong and positive effects on customer loyalty. Also,. Ch. engchi. many empirical studies have pointed out that two of the more effective means of generating customer loyalty are to delight customers (Lee, Lee, and Feick, 2001; Oliver, 1999) and to deliver superior value derived from excellent services and quality products (Parasuraman and Grewal, 2000).These empirical results show that customer satisfaction has a positive association with customers’ loyalty. Hence, the next hypothesis is proposed: H10: Customer satisfaction has a high correlation with customer loyalty. 30.
(39) 5. Measurement & Limitations of the Study The questionnaire of this paper study is designed based on the TCSI; and the samples of this study cannot be generalized nor presented as all the smartphone users because the samples are not randomly selected. The data in this study is collected conveniently; the reliability and validity may be questioned. Also, majority of respondents are living in Taiwan, the analyzing result may not be presented all the smartphone users in the world; however, the results of this study provide good indications for smartphone producers. In addition, the questionnaire is. 治 政 developed based on Taiwan Customer Satisfaction Index 大 (TCSI); which involves with 6 立 different variables (brand image, customer expectation, perceived quality and perceived value, ‧ 國. 學. customer satisfaction and customer royalty); however, the actual customer satisfaction of. ‧. smartphone users may be effected by other variables which may be more complicated than the Taiwan Customer Satisfaction Index (TCSI) proposed by this study; a number of potential. y. Nat. er. io. sit. variables may be included, such as special pricing package with local telecommunication provider, personal preference for local brands which are not included in this study.. n. al. 5.1.. Ch. Questionnaire Design. engchi. i n U. v. The contents of the questionnaire consist of three major parts; the first part is user information which includes the questions to confirm the respondents are smartphone users; also the smartphone brands. These questions are used to get a perspective of consideration set for participants. In this part, respondent’s basic information is also included, such as gender, nationality, residence country location, city location, age, education background, career industry, monthly income, smartphone cost, reasonable smartphone price, frequency of changing smartphone, smartphone brand, and others questions about how respondents perceive their smartphone, HTC brand smartphone, iPhone brand smartphone and Samsung 31.
(40) brand smartphone. The second part is customer satisfaction investigation, this part consist of seven different factors which are “personal preference:, “image”, “expectation”, “perceived quality”, “perceived value”, “customer satisfaction” and “customer loyalty”; however, “personal preference” is not discussed in TCSI model, the questionnaire of this factor aims to understand more about smartphone users’ preference. The questionnaire of this second part. 政 治 大 expectation items, 4 perceived quality items, 4 perceived value items, 3 customer satisfaction 立. consists of 30 items, including 5 personal preference items, 6 brand image items, 5 customer. items, and 3 customer loyalty items; the questionnaire aims to understand smartphone users’. ‧ 國. 學. satisfaction of the overall smartphone usage experience. All the items related to personal. ‧. preference are measured by a 5-point Likert scale;1=“strongly disagree” to 5 =”strongly. y. Nat. agree”; all the items related to brand image are measured by a 5-point Likert scale; 1=“very. er. io. sit. negative” to 5 =”very positive”; and all the items related to customer expectation, perceived quality, perceived value, customer satisfaction and customer loyalty are measured by a. al. n. v i n 5-point Likert scale;1=“very dissatisfied” C h to 5 =”very satisfied”. engchi U. The final part is the open-question asking respondents about how can smartphone producers improve their smartphones to meet with customers’ expectations.. 5.2.. Sample & Data Collection. Originally, this study survey aims for Taiwanese smartphone users only. However, this criterion might lead the survey result a bit bias due to HTC is an international brand from Taiwan. To understand how non-Taiwanese and other nationalities perceive HTC brand from different perspective, also, to reach the smartphone users with different backgrounds; the. 32.
(41) questionnaire was posted on Facebook and also sent by e-mailing for collecting respondents’ answers from different countries and nationalities. A Facebook survey event was created and posted out at various Facebook groups; e.g. Taiwanese live in the Netherlands, Taiwanese live in Germany, expats live in France, Expats live in UK and others. Before respondents start the survey, the purpose of this survey was explained. All the respondents were voluntarily participated in this study survey including world-wide. 政 治 大 this survey, 6 of them is invalid because the respondents who do not own/use a smartphone; 立. population; not limited to Taiwan population only. A total of 291 respondents anticipated in. therefore, 285 valid questionnaire was collected.. ‧ 國. 學. 5.3.. Statistical Analysis. ‧. After removing 6 non-smartphone users’ invalid survey data, 285 respondents’ answers and. Nat. sit. y. data were collected and analyzed with IBM SPSS Statistics 20 software. The total number of. n. al. er. io. samples was 285; 130 male respondents (45%) and 161 female respondents (55%). The. i n U. v. majority of the nationality is Taiwanese which are 165 respondents contributing 58% of the. Ch. engchi. completed nationality; the next is 5% from 15 Canadians and the other 5% from 13 Americans. Among all the anticipated nationalities, 154 people (54%) currently live in Taiwan; 33 people (12%) live in the Netherlands, and 20 people (7%) live in Germany now. Age levels between 24-30 years accounted for the most; constituted 30%; followed by 31-35 years accounted for 28%. Education background with college or university contribute the most, 138 people for total 48%; the next one is graduate school and above which include 127 people constituting 45%. Most of respondents are students which accounted for 30%; and 33 sales people contributed 12%.. 33.
(42) Due to students contribute a big portion of all the respondents, it also reflects on the monthly income which below NT 25,000/Below EUR625 (US835) accounted for the most, 95 people constituting 33%; and the second large portion is 19% for salary among NT 25,000 – NT 39,999/EUR625~EUR1000 (US835~US1350). As for purchasing locations, phone shops can be found easily nowadays, 141 out of total 285 smartphone users bought their smartphones from phone shops which account for 49%; and the second choice is telecommunication bureau which account for 25%. For the smartphone. price,. 立. 政 治 大 22% users paid NT 5,000~10,000/EUR125~EUR250. NT. 15,000~20,000/. EUR375~EUR500. (US500~US665);. (US665~US830);. 11%. paid. ‧. 20,000~25,000/EUR500~EUR625. 學. paid. ‧ 國. (US170~US335); 14% paid NT 10,000~15,000/EUR250~EUR375 (US335~US500); 21% 24%. NT. paid. NT. 25,000~30,000/. sit. y. Nat. EUR625~EUR750 (US830~ US1000) and 8% paid above NT 30,000/ Above EUR750. io. al. er. (US1000) (See Table 5.1).. v. n. Table 5.1: The Cost of Respondent’s Current Smartphone 11. How much did you pay for your current smartphone?. Ch. engchi. i n U. NT 5,000~10,000 / EUR125~EUR250 (US170~ US335). 63. 22%. NT 10,000~15,000 / EUR250~EUR375 (US335~ US500). 39. 14%. NT 15,000~20,000 / EUR375~EUR500 (US500~ US665). 59. 21%. NT 20,000~25,000 / EUR500~EUR625 (US665~ US830). 69. 24%. NT 25,000~30,000 / EUR625~EUR750 (US830~ US1000). 32. 11%. Above NT 30,000 / Above EUR750 (US1000). 23. 8%. (Source: Own source from this study questionnaire, June 1, 2013). Although. 24%. of. smartphone. users. paid. NT. 20,000~25,000/EUR500~EUR625. (US665~US830) for their smartphones, only 6% of respondents consider this price range NT 20,000~25,000/EUR500~EUR625 (US665~US830) is reasonable for smartphones. 32% of. 34.
(43) smartphone users consider NT 5,000~10,000/EUR125~EUR250 (US170~US335) is reasonable pricing for smartphones; 30% agrees on NT 10,000~15,000/EUR250~EUR375 (US335~US500);. and. 29%. approves. on. NT. 15,000~20,000/. EUR375~EUR500. (US500~US665) (See Table 5.2). Table 5.2: Respondents’ Ideal Smartphone Cost 12. In your opinion, what price range is considered reasonable for a smartphone? NT 5,000~10,000 / EUR125~EUR250 (US170~ US335). 90. 32%. NT 10,000~15,000 / EUR250~EUR375 (US335~ US500). 85. 30%. 82. 29%. 17. 6%. 7. 2%. 4. 1%. 政 治 NT 15,000~20,000 / EUR375~EUR500 (US500~ US665) 大 NT 20,000~25,000 / EUR500~EUR625 (US665~ US830) 立 NT 25,000~30,000 / EUR625~EUR750 (US830~ US1000). ‧ 國. 學. Above NT 30,000 / Above EUR750 (US1000). (Source: Own source from this study questionnaire, June 1, 2013). ‧. As the real smartphone prices are much higher than what customers hope for, only 13 people. y. Nat. sit. out of total 285 smartphone users change their smartphone less than 1 year which account for. n. al. er. io. only 5%. Most of people change their smartphone among 1-3 years; 35% of users change. i n U. v. every 1-2 years; and 39% of users change every 2-3 years. And 42% of users are currently. Ch. engchi. using iPhone, 20% of users are using Samsung; and 18% of users are using HTC. Being not well-recognized/well-known by consumers is a critical factor for smartphone producers because 148 respondents (52%) agree that brand is one of the main factors when they select a smartphone. Question# 14 approves that brand is an key factor for the success of Apple iPhone because 256 smartphone users (90%) agree brand is one of the reasons many users like Apple iPhone; even though the pricing is not really attractive, only 8% of users consider Apple iPhone pricing is one of the main reasons users select iPhone. Beside of the brand, respondents also believe in operation system and interface (187 respondents), phone. 35.
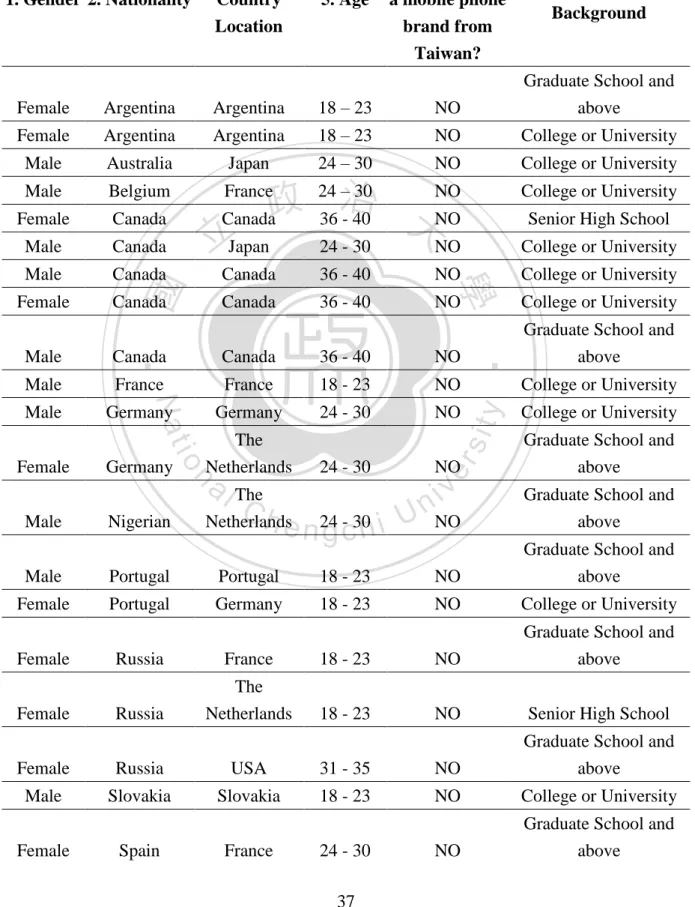
(44) design & look (161 respondents), available software (140 respondents), and touch screen capabilities, high pixel cameras / video Function (131 respondents) are other winning factors for Apple iPhone. At present, the market leader of smartphones is Samsung. On this study research, the questionnaire also asks the respondents what are the key factors that users like Samsung smartphones and the answers are big screen (186 respondents), pricing (161 respondents),. 政 治 大 brand (91 respondents), and high pixel cameras / video Function (80 respondents). If we 立 operating system and interface (101 respondents), phone design & look (95 respondents),. combine the top 5 of selecting Apple iPhone and Samsung factors, the results are brand,. ‧ 國. 學. operating system and interface, big screen, phone design & look, pricing, available software,. ‧. touch screen capabilities, and high pixel cameras / video function. These criterions match with. sit. y. Nat. the answers of question# 16; respondents select pricing, operating system and interface, brand,. io. er. phone design & look, high pixel cameras / video function as the top 5 main factors when it comes to select a smartphone.. n. al. Ch. engchi. i n U. v. Question# 17 indicates the smartphone brand our respondents currently use; HTC is on the 3rd place. Though HTC is an international brand from Taiwan, 33 people out of these 285 smartphone users are not aware of HTC is from Taiwan which account for 12%. Among these 33 people, 6 of them are from Taiwan and 22 people are from other nationalities and under age 35. This information shows HTC is not well-recognized in many countries including homeland Taiwan; also indicates HTC hasn’t campaigned the brand well in the world (See Table 5.3).. 36.
(45) Table 5.3: Respondents Who Do Not Know HTC is a Mobile Brand from Taiwan 3. Residence 1. Gender 2. Nationality Country Location. 5. Age. 20. Do you know “HTC”is a mobile phone brand from Taiwan?. 6. Education Background. Graduate School and Female. Argentina. Argentina. 18 – 23. NO. above. Female. Argentina. Argentina. 18 – 23. NO. College or University. Male. Australia. Japan. 24 – 30. NO. College or University. Male. Belgium. Female. Canada. Male. Canada. Male. Canada. Canada. 36 - 40. NO. College or University. Female. Canada. Canada. 36 - 40. NO. College or University Graduate School and above. 24 治 – 30 NO 政 Canada 36 - 40 大NO 立Japan 24 - 30 NO. NO. Male. France. France. 18 - 23. NO. Male. Germany. Germany. 24 - 30. NO NO. a l The v i n C h 24 - 30 U NO Netherlands engchi. n. Nigerian. er. io. Male. 24 - 30. y. 36 - 40. Germany. College or University. sit. Canada. Female. Senior High School. ‧. Canada. Nat. Male. The Netherlands. College or University. 學. ‧ 國. France. College or University College or University Graduate School and above Graduate School and above. Male. Portugal. Portugal. 18 - 23. NO. Graduate School and above. Female. Portugal. Germany. 18 - 23. NO. College or University. Female Female. Russia. France. 18 - 23. NO. Graduate School and above. Russia. The Netherlands. 18 - 23. NO. Senior High School. Female. Russia. USA. 31 - 35. NO. Graduate School and above. Male. Slovakia. Slovakia. 18 - 23. NO. College or University. NO. Graduate School and above. Female. Spain. France. 24 - 30 37.
數據

+7
相關文件
HyView Reader 目前僅接受 Microsoft Windows 作業系統之電腦,PDA 智慧 型手機(ex.IPhone) 及其他載具目前無法閱讀電子書,未來改版會陸續擴充 建 議:MAC 電腦使用者可利用
主辦單位:建國科技大學工程學院 (教學卓越計畫子計畫
SPCE061A 的開發是通過線上調試器 PROBE 實現的。它既
智者大師根據《大品般若經》 、 《大智度論》 、 《成論》 、 《毘曇》等較早期的大乘經 論對禪法的演繹及修行,使我們聯想起近代西方學者 Paul Harrison
此計劃主要包含一個以「智慧城市」為主題的專題研習展覽,再附以一系列的活動,其中包
為了解民眾對本機關各項 為民措施及服務人員的評 價,委外辦理「整體服務 品質滿意度調查」 ,針對洽 公民眾、受訓學員、轄區
不過以上所提的內容幾乎都會被現在的智慧型手機取 代,因此我們覺得這些功能能夠運用在一個沒有網路
Location Context Interpreter block (LeZi-PDA, etc.).. Foreground
