國 立 交 通 大 學
管理學院碩士在職專班管理科學組
碩 士 論 文
半導體設備產業之企業評價與經營績效分析
- 以 Lam Research Corporation 為例
Business Valuation and Performance Review
Of Semiconductor Equipment Industry
- An Example on Lam Research Corporation
研 究 生:黃 國 強
指導教授:王 淑 芬 博士
半導體設備產業之企業評價與經營績效分析
- 以 Lam Research Corporation 為例
Business Valuation and Performance Review
Of Semiconductor Equipment Industry
- An Example on Lam Research Corporation
研 究 生:黃 國 強 Student: Kuo-chiang Huang
指導教授:王 淑 芬 Advisor:Sue-fuen Wang, Ph. D
國 立 交 通 大 學
管理學院碩士在職專班管理科學組
碩 士 論 文
A Thesis
Submitted to Master Program of Management Science College of Management
National Chiao Tung University in partial Fulfillment of the Requirements
for the Degree of
Master of Business Administration in
Management Science June 2007
Hsinchu, Taiwan, Republic of China
半導體設備產業之企業評價與經營績效分析-以 Lam Research Corporation 為例
學生:黃 國 強 指導教授:王 淑 芬 博士 國立交通大學管理學院碩士在職專班管理科學組
摘要
本研究主要是以經濟附加價值( Economic Value Added )理論對美國的兩家 半導體設備供應商作經營績效分析,並求得其企業價值。 其中 Lam Research 為一專攻於蝕刻設備之供應商。市場佔有率近年來大有 提昇,並且於整體半導體設備銷售額排名中,也由2004, 2005的第七名,上升至 第五名。而 Applied Materials 則是一跨足半導體設備各領域之全球最大供應 商,其在本產業中的龍頭地位幾乎不容挑戰。 由於兩家公司皆為美國上市公司,故可藉由公開之財務資訊,進行各項經 營績效指標分析。整個研究分析過程以 Lam Research 為主要個案公司,並輔以 Applied Materials 作為標竿比較之企業。就各項營運績效之指標分析,探討Lam Research營運績效改進之原因。
研究結果發現Lam Research在ROIC-WACC差值及Invested Capital Turnover 等衡量經營績效的參數上,均較Applied Materials為優。評價結果顯示市場似乎 有低估Lam Research股價的現象。Lam Research經營績效之好轉,則與其產品市 佔率提升、良好之裝機及保固服務管理、稅務策略之最佳化、非核心業務之外包 等有直接關係。本研究對於Lam Research之未來發展策略,則提出鄰近市場開 拓、積極併購以提昇綜效、強化知識管理及保留人才和資本結構的最佳化等建言。
Business Valuation and Performance Review
Of Semiconductor Equipment Industry
- An Example on Lam Research Corporation
Student: Kuo-chiang Huang Advisor:Sue-fuen Wang, Ph. D
Institute of Master Program of Management Science
National Chiao Tung University
Abstract
This thesis is to do business valuation for two American semiconductor equipment suppliers by using the method of EVA (Economic Value Added).
Lam Research Corporation, a company mainly focusing on etch tools, has been gaining market shares for the past years. While Applied Materials, the biggest player in this industry since 1992, has been maintaining dominant positions in most of the segments.
Operation efficiency analysis and business valuation is conducted through the publicized information. We consider Lam Research as our main case while use Applied Materials for benchmarking purpose. Various operation efficiency parameters are compared to find out the cause of Lam Research’s performance improvement.
The study finds that both ROIC-WACC spread and Invested Capital Turnover of Lam Research are better than those of Applied Material. It is also found that the market price of Lam Research stock seems to be undervalued. The causes of how Lam Research improved its operation include the market share gain, sound installation and warranty management, optimization of its tax strategy, outsourcing of
non-core activities. We also provides our recommendations for Lam Research’s future strategies which include adjacent market engagement, aggressive merge and acquisition, improve knowledge management and people retention and optimization of its capital structure.
Keywords: Economic Value Added, Semiconductor equipment supplier, Operation Efficiency, Business Valuation, Strategy
Acknowledgements
Finally I am writing this, after these long years. MBA degree is always my dream. I was always hoping that it can open me the door to the exciting new world that probably can satisfy me more than what I am currently in. Although it takes me 5 years, this is really my own choice. I went through all these different concentrations from finance to entrepreneurship to organizational studies and then back to finance again. Throughout this journey, it did open my eyes, in a big way.
Thanks to Dr. Wang, my advisor, who is so excellent at transforming an engineering background student into one who can possibly complete this study.
Thanks to YR, my boss, who give me so much guidance and encouragement for my job. I would not be able to bring back my confidence and do what I am doing. Thanks to Joe, who is so considerate all the time and adamant to support me getting this last step, this thesis, done.
Thanks to Dad, who set an example for me to follow so that I won’t be afraid to be lost in life. Thanks to Mom’s loving, caring and believing, and her being an example of enduring and non-stop learning.
Thanks to Winnie, my wife, who is always there for me and give me the greatest comfort, encouragement and love. Without her and her wisdom, I am constantly puzzled by the world.
I appreciate it so much that I have you. I will not be able to get this dream come true if it were not you. Thank you.
Best regards, Kuo-chiang Huang June, 2007
Contents
Page number Abstract in Chinese.……….………...i Abstract in English…..……….………..ii Acknowledgements………...iv Contents …….…….………...v Figure Summary………...vii Table Summary………...ixChapter One: Introduction……..………..……..1
1.1 Research motivation and goals……….…....1
1.2 Research method……….. ...3
1.3 Research structure………..………..4
Chapter Two: EVA theories and literature review...…...6
2.1 Introduction to EVA theory………..6
2.2 Review of EVA related literatures..……….8
2.3 EVA calculation and standardization ………12
2.3.1 EVA calculation……….……….12
2.3.2 EVA standardization……….…………..13
2.4 EVA constituents and their calculation……….…….……14
2.4.1 The calculation of NOPAT and Invested Capital……...…………..………...14
2.4.2 The calculation of WACC……….………..17
2.5 Introduction of MVA……….19
2.6 Calculation of company value via EVA………..………..20
Chapter Three: Industry Analysis and Companies introduction…….……….22
3.1 Introduction to wafer fabrication equipment industry………22
3.1.1 Current Status of WFE and its trend……….22
3.1.2 Targeted Market………28
3.1.3 WFE segments………..30
3.2 Introduction to Lam Research………32
3.2.1 Basic data of Lam Research Co………32
3.2.2 Core competency of Lam Research Co………34
3.2.3 Competitive Strategy……….35
3.3 Introduction to Applied Materials………..37
3.3.1 Basic data of Applied Materials………37
3.3.2 Core competency of Applied Materials……….38
3.3.3 Revenues and Operation………39
Chapter Four: Operation Effectiveness and Efficiency Analysis……….41
Page number
4.2 Profitability Analysis………..42
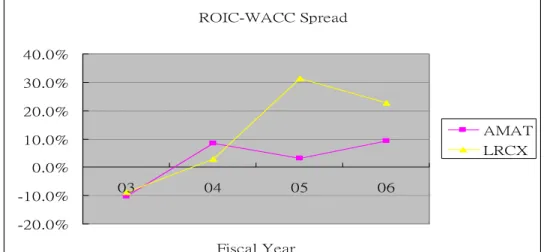
4.2.1 ROIC-WACC Spread analysis………..43
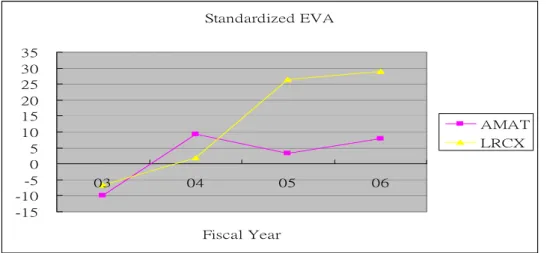
4.2.2 Standardized EVA Analysis………..44
4.3 Dupont Analysis……….………45
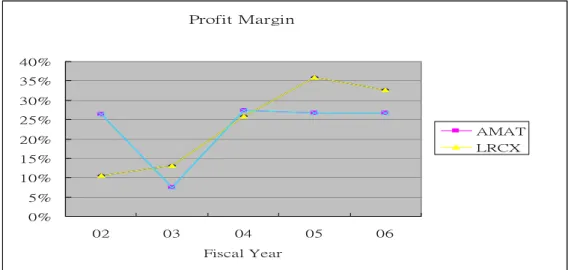
4.3.1 Profit Margin Analysis………..47
4.3.2 Invested Capital Turnover Analysis……….………….52
4.3.3 Operation Efficiency Indexes Analysis……….……53
4.4 Growth Rate Analysis……….……...56
4.4.1 Growth Theory of VA………...56
4.4.2 Analysis of the companies……….57
4.5 Summary of this chapter…...……….………60
Chapter Five: Business Valuation………62
5.1 Introduction to regression………..62
5.2 Some commonly used methods for business valuation……….62
5.3 Model of business valuation………..63
5.4 Computation of Lam’s value……….64
5.4.1 NOPAT forecasting………..64
5.4.2 Invested Capital forecasting………..64
5.4.3 Forecasting of WACC and stock price………..64
5.5 Computation of Applied’s value………66
5.5.1 NOPAT forecasting………...66
5.5.2 Invested Capital forecasting………..66
5.5.3 Forecasting of WACC and stock price………..66
5.6 Simple PE ratio multiple method………...68
5.7 Summary of this chapter………68
Chapter Six: Conclusion and Recommendations…...………..70
6.1 Conclusions and recommendations to the companies….………...70
6.2 Limitations of this research………..……… .75
6.3 Recommendations for further study………...75
Figure Summary
Page numberFigure 1-1: Flow Chart of this study……….5
Figure 2-1: Comparing the Regular Balance Sheet and EVA Balance Sheet…….17
Figure 3-1: Semiconductor Equipment Companies Net Income……….26
Figure 3-2: WFE expenditure forecast and the linear fitting curve……….27
Figure 3-3: Worldwide Fab Equipment Trend………28
Figure 3-4: WFE market segmentation………...30
Figure 3-5: Bookings –Semi Equipment Billings………...31
Figure 3-6: Fab Equipment segmentation by percentage………32
Figure 4-1: ROIC-WACC spread comparison between Lam and Applied……….44
Figure 4-2: Standardized EVA comparison between Lam and Applied………….45
Figure 4-3: Profit Margin comparison between Lam and Applied……….48
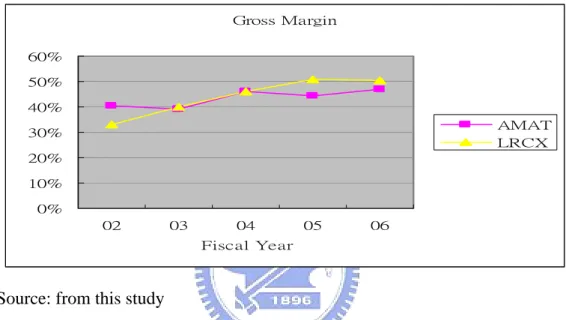
Figure 4-4: Gross Margin comparison between Lam and Applied……….49
Figure 4-5: Net Income as a percentage of Revenue comparison between Lam and Applied……….50
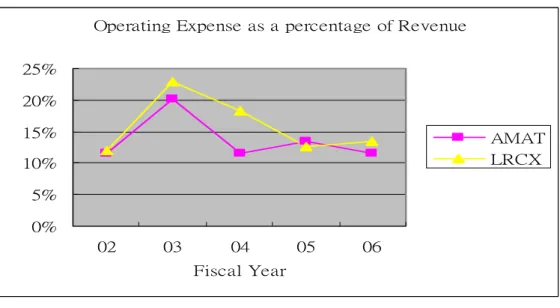
Figure 4-5A: Operating Expense as a percentage of Revenue comparison between Lam and Applied………..50
Figure 4-6: Net Non-operation Income as a percentage of Revenue comparison between Lam and Applied………51
Figure 4-7: Cash Operating Tax as a percentage of Revenue comparison between Lam and Applied………..52
Figure 4-8: Net Non-operation Income as a percentage of Revenue comparison between Lam and Applied………52 Figure 4-9: Total Asset Turnover Day comparison between Lam and Applied….54 Figure 4-10: Fixed Asset Turnover Day comparison between Lam and Applied….54
Page number Figure 4-11: Average Collection Period comparison between Lam and Applied…55 Figure 4-12: Average Inventory Period comparison between Lam and Applied….55 Figure 4-13: Growth Rate of NOPAT comparison between Lam and Applied……58 Figure 4-14: Return on Incremental Invested Capital comparison between Lam and
Applied……….59 Figure 4-15: Investment Rate comparison between Lam and Applied……….59
Table Summary
Page number Table 2-1: NOPAT and Invested Capital (from Financing Approach)………...…15 Table 2-2: NOPAT (from Operating Approach)………...16 Table 3-1: Semiconductor Capital Spending Forecast………26 Table 3-2: Weighting of WFE expenditure as compared to total semiconductorcapital Spending and Equipment Spending………27 Table 3-3: 2005-2006 Semiconductor Capital Equipment Market by Region……30 Table 4-1: EVA & Standardized EVA of Lam Research Corporation…………...43 Table 4-2: EVA & Standardized EVA of Applied Materials……….43 Table 4-3: Profit Margin and Invested Capital Turnover of Lam Research……...47 Table 4-4: Profit Margin and Invested Capital Turnover of Applied Materials….47 Table 4-5: Some common activity ratios………53 Table 4-6: NOPAT growth rate of Lam Research………..57 Table 4-7: NOPAT growth rate of Applied Materials………57 Table 4-8: Performance index comparison between Lam and Applied…………..60 Table 5-1: NOPAT Forecasting for Lam Research……….64 Table 5-2: Invested Capital Forecasting for Lam Research………64 Table 5-3: Assumptions made for stock price calculation for Lam Research…….64 Table 5-4: Computation Process of Lam Research’s stock price………65 Table 5-5: NOPAT Forecasting for Applied Materials………...66 Table 5-6: Invested Capital Forecasting for Applied Materials………..66 Table 5-7: Assumptions made for stock price calculation for Applied Materials...67 Table 5-8: Computation Process of Applied Materials’ stock price………...67 Table 5-9: FY 2007 EPS forecasting by using linear regression method………...68 Table 5-10: Forecasted stock price comparison between PE Ratio and EVA……..68
Chapter One: Introduction
1.1 Research motivation and goals
High technology industry is full of vigor and energies. It helps to drive the advancement of mankind wealth fare and provides constant new excitement to us. Thanks to those numerous scientists, engineers, together with the entrepreneurs, and managers that work together and turn their wisdom and sweat into the sweet fruits that finally benefit all of us.
Certainly among these high tech arenas, semiconductor industry is one big chuck of it. Ever since integrated circuits were invented in 1959, each year so many new devices were invented and commercialized. The speed of growth is so astonishing that we suddenly enter a new era. As cited by Marry Bellis, Jack Kilby, the inventor of Integrated Circuits, puts it “What we didn’t realize then was that the integrated circuit would reduce the cost of electronic functions by a factor of a million to one, nothing had ever done that for anything before” Also from Moore's Law, the empirical observation made in 1965 that the number of transistors on an integrated circuit for minimum component cost doubles every 24 months. Both the capability of shrinking in its size and doing more complex circuitry design get us more and more power electronic appliances and gadgets. The applications are basically everywhere in our daily life. Mobiles phones, notebook computers, car electronics, stereos, TVs, digital cameras, computer servers, even the internet services boom is based on the maturity of IC industry in a way. Also there are some other businesses like thin film heads, MEMS (Micro-Electro-Mechanical System)and 3DIC packaging which are gaining their share of popularity. In 2007, the value of all these sectors totaled $267.3 billions. (Mark LaPedus)
enables the technologies to manufacture these IC chips and make it affordable to the folk people. It works hand in hand with the semiconductor fabs and provides the manufacturing equipments needed. Reviewing the history, it has went through the path from the original 5 inches, 6 inches, 8 inches and finally 12 inches wafers now.
Applied Materials, kept its championship since 1992, is the market share leader in this wafer fab equipment (WFE) industry. This giant is competing in almost every single module of this industry. Although of its glorious history and great success, profitability and operating efficiency were not so impressive in the past several years. Lam Research Corporation on the other hand, which has spent most of its years in etch business, was gaining momentum in the past several years. It seems that the management has been doing the right thing in converting this company from an ordinary to an extraordinary one. It is interesting to have a more in-depth analysis on how things were going on for these two companies and why this was happening.
The goals of this thesis consist of the following:
1. To analyze the operation effectiveness, efficiency and business valuation of these two companies through the EVA method.
2. Come out an analysis on how Lam Research went through the past five years and achieved the changes.
3. Based on the business valuation view point, formulate the recommended strategies of these two companies’ future development.
1.2 Research Method
The research method this study adopts is Problem Resolution Research Method (朱浤源). This method is aiming at finding a solution to a problem raised. The procedure of this method is as the following:
1. Problem development
2. Define the range and boundary of the problem 3. Analyze the problem deeply
4. Search for a solution for the problem
This thesis is an analysis of Lam Research Corporation and Applied Materials based on EVA (Economic Value Added) and MVA (Market Value Added) theories so that the problems raised-the valuation of them, how these two companies changed for the past years and how to move on-could be answered. The data used were from the public financial reports (U.S SEC filings Form 10-K) from Fiscal Year 2002 to 2006. After obtaining the EVA values of these past years, a regression method is then used to forecast future years’ EVA. Discounted cash flow concept is used to get MVA and then the stock price.
Based on the decomposition of EVA, a trend analysis could be conducted for Profit Margin and Invested Capital Turnover. These two indexes could then be further decomposed to get to the bottom and see exactly what items contributed the change of EVA. This helps to answer the question about what has caused the changes for these two companies.
Finally we can then propose our recommendations for the future development of these two companies based on our understanding of how they perform in each area of the operation and also the industry trend.
1.3 Research structure
This thesis is divided into six chapters. Please refer to the following and Figure 1-1 for a brief introduction:
Chapter One: Introduction
This is consisted with the research motivation, goals, research method and structures.
Chapter Two: EVA theories, literature survey and method
Firstly we will have an introduction of EVA theory. This is followed by a literature survey. Detailed definitions of the EVA constituents are given. These will include NOPAT, Invested Capital and WACC. The procedures of calculating MVA and Corporate Value via EVA is also discussed
Chapter Three: Industry Analysis and Introduction to companies discussed A current status review of semiconductor equipment industry is presented together with the trend analysis. We will also give background information of the two companies involved in this study. This will hopefully enhance readers’ understanding of these two companies and better facilitate the discussions going forward.
Chapter Four: Operation Effectiveness and Efficiency Analysis
EVA theory will be used to analyze these two companies. It is then followed by a side by side comparison. Comments on these different indexes will be given at the end.
Chapter Five: Business Valuation Analysis
A brief introduction of regression method will be given first followed by a discussion of some commonly used prediction methods for business valuation. Finally we proceed to do calculation on the business values, stock price, together with the sensitivity analysis on its dependent variables.
A conclusion is made based on this study. The limitation and restrictions of this study is then discussed. Recommendation for future researchers will also be lay out.
The flow chart of this study
Formation of Research Problems and Goals
Research Method and Procedures
Literature review
Industry analysis and economic environment study
Introduced to the companies
EVA Calculation of the companies
Comment on the operation performance
Business Valuation
Conclusion and Recommendation
Source: from this study Figure 1-1: Flow Chart of this study
Chapter Two: EVA theories and literature review
In this chapter, we will have an introduction of the EVA theory, review of literatures, EVA calculation, the concept of MVA and how to calculate company value with EVA via EVA theory.
2.1 Introduction to EVA theory
Economic Value Added (EVA) is used for measuring the excessive return that an investment or a company can generate over the opportunity cost of capital. This is the difference between the net operation profit after tax (NOPAT) and its weighted average cost of capital (WACC). This method has gaining its popularity recently. It is considered as an important index of companies’ internal operation efficiency and a reference of managerial accounting decisions besides traditional accounting profit. It can also be used by the investment community to make investment decisions. Some people even suggest replacing the usage of accounting profit by EVA.
The method of EVA is proposed by a New York based global consulting company Stern Stewart & Co. in 1989 and registered as a trade mark. There are already more than 300 companies which are using it as an index of internal operating efficiency. It is advocated that the performance of these companies is better than that of other companies which did not implement this method. One of the benefits of using EVA is that it provides simple concepts for those who do not have a solid background on finance so that they can still easily utilize it.
The traditional method in measuring companies’ performance is through indexes like Net Income or Earning Per Share (EPS) governed by General Accepted Accounting Principle (GAAP). But Net Income only considers interest cost of debts while neglecting the Cost of Equity which is the cost of shareholders’. On the contrary, EVA does get both considered. At the same time, due to that the accounting
principle has its restrictions on how to get depreciation, R&D expenses, and deferred income tax settled; this may affect the accuracy of deciding how the company is operated, and therefore cause the Principle-Agent Problem. While if EVA is used for the evaluation of company performance, via the adjustment of accounting items, the actual company profit can be calculated, and the value created is correctly reflected. This can be used to objectively manage employees’ compensation package, too.
Actually, EVA is not a new concept. It is similar to what economists’ long time thinking as “economic profit” or “economic surplus”(Stephen Keef). Economists think that company’s net operational profit must exceeds its cost of capitals (including debts and equities), it is then worth the risk of this investment. By only having excessive profit, companies can then accumulate wealth, creating reasonable return to their shareholders. It is just that until recently, there is a way to measure economic value added, and then combine with the employee Incentive Compensation System. Since this concept is easy to understand, if companies can adopt this methodology accurately, it could then link the interests of managers and shareholders. The measurement of operation efficiency will then not get affected by the changes of accounting principles. It also leaves no room for manipulation. And the company performance measurement will then be based on real economic profit generated. This in term is to benefit the shareholders, which is in lined with the goal of the managers whose bonus is depending greatly on the economic values they help to create. Managers will hopefully no longer be interested in manipulating Earnings Per Share (EPS), Return On Net Asset (RONA), or Return On Investment (ROI). When managers are finally aligned with shareholders on their goals, the internal conflict inside companies can thus be greatly reduced, and hence eliminating the so called Principle-Agent Problem. For line managers, since it starts with the familiar operating profits and simply deducts a charge for the capital invested in the company as a whole,
in a business unit, or even in a single plant, office or assembly line. By assessing a charge for using capital, EVA makes managers care about managing assets as well as income, and helps them properly assess the tradeoffs between the two. This broader, more complete view of the economics of a business can make dramatic differences.
Hence, the concept of EVA could be applied to many areas, almost including all items in long term and short term planning and controlling especially the evaluation of long term and short term performance that relates to incentive compensation system.
That is why EVA has become so popular in today’s business and finance community. FORTUNE magazine has called it "today's hottest financial idea," and Peter Drucker observed in the Harvard Business Review that EVA is a measure of "total factor productivity” Financial researches also support that the correlation between EVA and corporate value is higher than the that of other financial efficiency indexes like Earnings Per Share (EPS) or Return On Equity (ROE). )
So this research will target on decoupling the EVA into different items like NOPAT (Net Ooperation Profit After Tax), Invested Capital and WACC (Weighted Average Cost of Capital) Use these items to do analysis over the target companies. And eventually, do the business valuation, comment on the strategies of future company growth.
2.2 Review of EVA related literatures 1. Stern (1993)
Joe Stern from Stern Stewart constructed a system that claimed to correctly evaluate business performance. This system stressed that a business can only create value for its shareholders while it earns higher return than the cost of invested capital. So Economic Value added is a technique to measure whether a business could create
the general accounting measures like Revenue, Cash flow or Dividends.
To avoid the distortion from GAAP rules, consultants from Stern Stewart & Co. have given recommendations to add back change in Equity Equivalents.
2. Tully (1993)
EVA correlates with stock price highly. Also there are three ways for business to increase its EVA:
(1) Increase operation profit while keeping the invested capital fixed. (2) Try to maintain similar level of operation with lower invested capital. (3) Invest capital to those projects that can earn higher returns than its cost. 3. Lehn & Makhija (1996)
A study using the 241 U.S. public companies’ financial data of 1987, 1988, 1992 and 1993 showed that return on stock has higher correlation with EVA than other conventional performance evaluation indexes like ROA (Return on Asset), ROE (Return on Equity) and ROS (Return on Sales).
4. Chen and Dodd (1997)
A study using the 566 public companies’ financial data of 1983 to 1992 showed that return on stock has higher correlation with EVA than other indexes like EPS (Earning per Share) and ROE (Return on Equity). But the R squared value of EVA is 0.202, is about comparable to that of Residual Income (0.194).
5. 張耿豪 (1997)
86 companies listed in the Taiwan Stock Exchange are used as research sample. The studying periods are from 1993 to 1997. The sample is further divided into several subgroups by their sizes and industries. The regular regression analysis is first applied to examine the explanatory power of each of the variables to the concurrent stock returns. Then the Information Coefficient Method is used to examine the information content of each of the variables. Results from the information coefficient analysis
strongly support the view that the EVA indeed carries more information content than that of CFO, Earnings, and RI. For the overall and every subgroup, the EVA outperforms other measures in predicting the performance of stock returns. However, the results from the regression analysis show that it is inferior to that of RI.
6. Robert Ferguson, Joel Rentzler, Susana Yu (2005)
This article uses event study methodology to investigate whether firms adopt EVA system leads to better stock performance (greater profitability). There is some evidence that EVA adopters experience increased profitability relative to their peers following adoption.
7. Chikashi Tsuji (2006)
EVA is compared with several other valuation measures including cash flow, operating income, and profit after tax from the viewpoint of both levels and changes. Also two different forms of EVA are examined by using the Weighted Cost of Capital (WACC) from the Capital Asset Pricing Model (CAPM) and the WACC from the Fama-French (1993) model. The results reveal that corporate market values in both levels and changes have stronger linkages with cash flow and other earnings measures than either form of EVA.
8. Wajeeh Elali (2006)
Two commonly used value-based performance metrics - namely, Total Shareholder Return (TSR) and Tobin's Q - were also considered to highlight the value-relevance of EVA vis-a-vis these measures in predicting shareholder wealth. Using a panel sample of about 1000 American firms over the period 1990-2002, the study found compelling evidence consistent with the notion that EVA outperforms other traditional performance measures in explaining shareholder wealth. Value-relevance tests reveal EVA to be more highly associated with shareholder wealth than TSR and Tobin's Q.
largest explanatory power over TSR and Tobin's Q. These results conclusively support the claims made by EVA proponents and further support the potential usefulness of EVA metric for internal and external performance measurement.
9. Ralph Palliam (2006)
108 companies were analyzed with data ranging from 1998 to 2002. Among them 75 are EVA users and 33 are non-EVA users). EVA corporations do not necessarily have superior stock returns. Simple correlation between accounting earnings provides a reasonable reliable guide to the movement of stock prices. Furthermore, the study found minimal evidence of a difference between the market returns of firms that use EVA compared to firms that do not use EVA.
From the review of these articles, it is found that there are some supporters (Tully (1993), Lehn & Makhija (1996), Chen and Dodd (1997), 張耿豪 (1997), Elali (2006)) asserting that EVA is better than other indexes at predicting stock price movement; but there are also some other researchers (Tsuji (2006), Palliam (2006)) found that this is not the case. Also there is study (Ferguson, Rentzler & Yu (2005)) suggesting that the EVA adopters experience increased profitability relative to their peers following adoption.
So although it is remianed argumentative whether EVA is fully proven to be the best measurement of companies’ capability of creating shareholders’ wealth, but it seems that its advocators are gaining better position.
Here are some comments/questions for Tsuji’s and Palliam’s articles. For Tsuji’s, is it possible that Japan’s investment community is less aware of the concept of EVA so that they follow the old ways of investment, which is looking at the performance of conventional performance metrics? So it may be natural that they the conventional metrics can beat EVA. As far as Palliam’s work is concerned, is it possible that it
contains one big incident which is the dot com bubble so that the stock price has deviates too far from the real value it should be?
So the author concludes EVA to be no worse than other measures and that is the reason why it is chosen as the method for this study.
2.3 EVA calculation and its standardization 2.3.1 EVA Calculation
EVA is the difference between the Net Operation Profit After Tax and Weighted Average Cost of Net Capitals used. The Equation used(Stewart) is:
Among them
NOPATt: It is the abbreviation of Net Operating Profit After Taxes.Net means that various kinds of accounting distortion is deducted.
WACC: It is the abbreviation of Weighted Average Cost of Capital.
Invested Capitalt-1: This is the invested capital at the end of term (t-1) or the beginning of term t.
WACC x Invested Capitalt-1:This is the cost of invested capital at the beginning of term t.
ROICt: This is the abbreviation of Return on Invested Capital.
From the equation of EVAt = (ROICt–WACC) x Invested Capitalt-1, we learnt that business can only increase its value under the situation while ROIC is greater than WACC. That is to say, only under the circumstances of positive EVA can company generates excessive return and brings positive value to its shareholders. On
the contrary, negative EVA means that company can not even earn enough retune greater than the cost of its weighted capital, thus it actually brings negative value to its shareholders. In short, EVA provides information about whether the company is creating excessive return for its shareholders. So it is an explicit form of corporate values creation. The primary goal of the management team is to maximize its EVA to create biggest values for the company.
For line managers, since it starts with the familiar operating profits and simply deducts a charge for the capital invested in the company as a whole, in a business unit, or even in a single plant, office or assembly line. By assessing a charge for using capital, EVA makes managers care about managing assets as well as income, and helps them properly assess the tradeoffs between the two. This broader, more complete view of the economics of a business can make dramatic differences.
2.3.2 EVA Standardization
To eliminate the impact of company sizing on EVA value so that we can do a fair comparison between companies, we need to calculate standardized EVA. The equation is as the following:
Standardized EVAt = (ROICt – WACC) x Standardized Invested Capitalt-1
Standardized Invested Capitalt-1 is the standardized invested capital at the end of term(t-1) or the beginning of term t.
Invested Capital0 is the invested capital at term zero.
Standardized EVAt= (ROICt-WACC) x Standardized Invested Capitalt-1
= (ROICt-WACC) x Invested Capitalt-1/ Invested Capital0 x 100
2.4 EVA constituents and the calculation method 2.4.1 Computation of NOPAT and Invested Capital
From the previous equation derived, EVA could be easily got from the simple equation. But actually NOPAT and Invested Capital are not readily available from the financial reports. From the book “The Quest for Value” by G. Bennett Stewart III, two methods were proposed:
1. Financing Approach
This mainly comes from the Liabilities and Shareholders Equities of the Balance Sheet
2. Operating Approach
This mainly comes from the Assets of the Balance Sheet
The NOPAT and Invested Capital derived from both approaches should be the same. Please refer to Table 2-1 and 2-2 from the details.
Table 2-1: NOPAT and Invested Capital ( from Financing Approach )
NOPAT ( by Financing Approach ) Invested Capiatl ( by Financing Approach ) = GAPP Net Income = Common Equity
+ Change in Equity Equivalents + Equity Equivalents
+ Capitalized R&D Expenses + Net Capitalized R&D Expenses - R&D amortization (Intangible assets)
+Capitalized Marketing expenses +Net Cpaitalized Marketing expenses - Market amortization (Intangible assets)
+Non-Capitalized lease costs +Present Value of Non-capitalized leases + Change in Bad Debt Reserve + Bad Debt Reserve
+Change in LIFO Reserve +LIFO Reserve
+Goodwill Amortization +Cummulative goodwill amortization + Unusual loss (Gain) after tax +Culmulative unusual loss (Gain) after tax +Change in deferred tax liabilities +Deferred tax liabilities
+Dividend on Preferred Stock +Preferred Stock +Minority Interest Provision + Minority Interest -Investment and Interest income + Short-Term Debt +Tax paid on investment and interest income
( effective tax x investment income ) + Current Portion of Long-Term Debt + Interest expense +Long-Term Debt
- Tax shield from interest expense (effective
tax rate x interest expense) - Marketing Securities & Construction in Progress Source: G.Bennett Stewart,III.
Table 2-2: NOPAT (from Operating Approach)
NOPAT (by Operating Approach) Calculation on Cash Operating Tax = Sales Revenue = Income tax provision
- Cost of Goods Sold - Change in deferred tax laibilities - Depreciation +Tax aving from Net Interest Expense
-Sellinng General & Administration ( effective tax rate x net interest expense) + R&D Expenditures
+ Interest Expense on Non-Cpaital Lease +Change in LIFO Reserve
+ Other Income
--- NOPBT (Net Operatin Profit before Tax) - Cash Operating Taxes ---
= NOPAT
Source: G.Bennett Stewart,III.
Comparing the Regular Balance Sheet and EVA Balance Sheet below in Figure 2-1, we can find that the main difference between these two is that in EVA’s Invested capital, NIBL (Non-Interest Bearing Liabilities) is not included. These Non-Interest Bearing Liabilities are accounts such as accounts payable and accrued expenses, that arises as spontaneous sources of financing in the nature course of business and which eliminate the need to raise permanent capital. The rationale for excluding them from capital is that the financing costs associated with paying suppliers and employees with some delay are incorporated in the cost of goods sold, and nothing is to be gained by extracting them from earnings.(G. Bennett Stewart, III)
Source: S. David Young, Stephen F. O’Byrne, EVA and Value-Based Management Figure 2-1: Comparing the Regular Balance Sheet and EVA Balance Sheet
WCR ( Working Capital Requirement ) = Receivables + Inventories + Prepayments- Short-Term NIBL
Where Net Asset = Cash +Working Capital Requirement + Fixed Asstes
And Invested Capital = Short-Term Debt + Long Term Debt + Other Long Term Liabilities + Shareholders Equity
RONAt = NOPATt/ NetAssett-1 ROIC= NOPATt/ Invested Capital t-1
RONA=ROIC since Net Asset= Invested Capital
2.4.2 Computation of WACC
WACC (Weighted Average Cost of Capital) is the weighted average cost of all sorts of capitals that were used for a project (or a business). The importance includes the following:
of its evaluation. For the investors of this corporation including Bondholders and Shareholders, this is a Required Rate of Return that is a compensation for the risk they take for the investment. So naturally, this return rate will be different for different industries, different companies or even different projects within the same companies. So the cost of an investment is really dependent on the risk level of that project, or more specifically, on where the money is spent, in stead of where the money come from. So the overall cost of a company’s capital is a reflection of the required return of its overall asset. So for a company that uses different sources of capitals that required different levels of return, the cost is computed by using their weighted average of all capitals.
2. The source of capitals
Since there are two forms of capital sources: debt and shreholders’ equity, so the cost of capital is a function of the cost of each capital. The weighted averaged cost of capital (WACC) is thus defined:
WACC= D/(D+E) x Kd (1-Tc) + E/ (D+E) x Ke
Where Tc is the tax rate of the company, so debt has its effect of tax saving
D: the market value of interest baring debt. Usually it is estimated by the book value of the interest baring debt
E: the market value of a company’s equity. E= Outstanding shares x Share price Market Value of a company= E+D
Kd= cost of interest baring debt= interest expense / Average interest baring debt = (interest expense x2)/ ( interest baring debt at the beginning of a term + intrest baring debt at the end of a term )
Ke= cost of equity= Rf+β( Rm-Rf) = risk free return rate +β x risk premium of the investment
capitals impact a lot to the magnitude of WACC. So the capital structure of a company (equity to debt ratio) is crucial and needs to be optimized for each specific company.
Each company has its own combination of debt, preferred stock and common stocks to get its WACC reaching the lowest and stock price reaching the highest. This combination is called the target capital structure. So a sensible company which is pursuing the maximum value will try to raise the capitals in a way that it won’t deviate from the optimized capital.
2.5 The computation of MVA
The ultimate goal of a corporate operation is to increase its shareholders’ wealth. This could only be achieved by increase the difference between a corporate’s market value and its cost of capitals. The difference is called Market Value Added (MVA).
MVA= Market Value of a corporate- Total Invested Capital
So the higher the MVA is, the bigger the shareholders’ wealth become. This is all about how to manage the limited resources within a company so that the EVA is optimized.
MVA= Outstanding shares x Stock Price + Market Value of Preferred Stock + Market Value of Debt – Invested Capital
Usually we assume that the market value of Preferred Stock and Debt equal to their book values for the purpose of simplicity. So the above equation becomes:
MVA= Outstanding Shares x Stock Price – Book Value of Equity
MVA per share = Stock Price – Book Value of Equity/ Outstanding Shares
So MVA, Stockholders’ wealth and stock price change at the same direction. When MVA is positive, it means that the company is creating wealth for its shareholders so the stock price will go up. On the contrary, if the MVA is negative, shareholders’ wealth is destroyed and thus the stock price will go down. But since stock price is
investors’ expectation on company’s future performance instead of current performance, so the correlation among these three parameters may not be that trivial in real case.
Stern Stewart & Co. considers EVA as a measure for company’s stock price through empirical study. EVA is for only one term, while MVA is the accumulation of EVA under the assumption of continual operation. So
Expected MVA = Present Value of Future Expected EVAs.
If the EVA of a specific year is positive, it means that the company can continue to create economic profit after the cost of invested capital is deducted. So MVA gets increased also. If the EVA of a specific year is negative, it means that the company destroys economic profit through its operation. So the market value of the company decreases and MVA drops. This is to say that the changes in EVA have a strong correlation with the change of MVA.
2.6 Company Valuation through EVA computation
A company’s value could be calculated by adding the original invested capital to all future EVA together with each term discounted to its present value by a discounted rate of WACC. This could be expressed by the following equation:
Company Value= Invested Capital + Present Value of future Expected EVAs
= Invested Capital +
Under the assumption of continual operation, usually a company can enjoy higher growth rate and profitability at the beginning several years. After this relatively higher speed of growth, the company may enter a more matured stage when the growth rate and the profitability is relatively stable. So we can use this kind of two stage concept for predicting a company’s future EVA which are:
Stage two: After Explicit Forecast Period
Usually the first period lasts for 3 to 5 years, depending on different industry. But of course the duration of this period can also depend on the actual growth rate. For example, a higher growth rate may possibly extend the duration of this period.
Company Value = Invested Capital + Present Value of EVA During Explicit Forecast Period + Present Value after Explicit Forecast Period.
During Explicit Forecast Period
The financial reports like Balance Sheets and Income Statements should be forecasted explicitly and thus EVA of each year could be calculated explicitly. Then WACC could be used as the discounted rate to calculate the present values.
After Explicit Forecast Period
Continuing Value ( CV, or Terminal Value or Residual Value) is firstly computed and then WACC is again used for its present value calculation. From the book Valuation by Copeland (2000), Continuing Value=
(EVAt+1/WACC)+ (NOPATt+1 ( IROIC-WACC) g)/ (( WACC (WACC-g) IROIC))
Where t means the duration of the first stage
EVA t+1 means the EVA of the first term of the 2nd stage.
NOPAT t+1 means the NOPAT of the first term of the 2nd stage.
g: growth rate of NOPAT
IROIC: The expected rate of return on Incremental Invested Capital
So from this we learn that we need the following conditions to have positive EVA in second stage:
1. IROIC-WACC>0 2. IR= g/IROIC>0
Chapter Three: Industry Analysis and Companies introduction
In this chapter, we will first have an introduction to the wafer fabrication equipment industry, and then the basic information, core competency and competitive strategy of the two companies, Lam Research and Applied Materials will be discussed.3.1 Introduction to wafer fabrication equipment industry
Wafer fabrication equipment industry is an industry that builds tools for semiconductor manufacturing. The targeted customers includes INTEL, IBM, Samsung, TSMC or UMC……..etc.
3.1.1 Current Status of WFE industry and its trend.
The semiconductor and semiconductor equipment industry has enjoyed strong growth since its inception (Bob Johnson, Dean Freeman, 2005). From 1972 through the mid-1990s, the industry enjoyed revenue CAGR of 15 to 17 percent. The industry became a Wall Street darling, with very high price-to-earnings ratios as a result of the potential for strong growth. In the mid-1990s, however, there was an inflection in the growth curve. In the 1994-1995 timeframe, the long-term CAGR for semiconductor revenue dropped to a range of 10 to 12 percent. This has also affected the semiconductor equipment industry. It is found that this drop in revenue growth rate is probably related, in part, to the drop of average selling price of semiconductors. Several other issues that could also be contributing to this decline include:
• Consumerism;
Over time, and becoming more prevalent in the 1990s, the business environment for electronic products started to saturate and shifted to a market driven by replacement cycles. The industry has migrated from a supply 'push' to a demand 'pull' market, which is responding to an environment of increasing price sensitivity. Thus, the price premium segment of the market is shrinking on a
relative basis, ASPs are declining, and the long-term revenue growth trend is slowing.
• Increased competition;
In the early 1990s there was a significant increase in the number of fabless companies in the marketplace. The rise of the foundry model, with manufacturing capabilities less than a generation behind that of the IDMs (Integrated Device Manufactures), made it very simple for a company to design and then produce devices for the semiconductor market. This rapid rise of the fabless firms, along with a significant increase in the number of DRAM suppliers, led to increased competition in the marketplace, which in turn led to pricing wars for market-share dominance.
• Capital markets;
Much recent historical growth in the semiconductor market has resulted from new entrants -- mainly memory or foundry companies -- funded by offerings in the public capital markets or government incentives. However, the long down cycle has reduced the attraction of semiconductor ventures to capital markets. Thus, there probably will be few new major entrants into the industry.
• Fewer buying centers
As the industry continues to grow and mature, there are few buying centers that are available for semiconductor equipment manufactures to sell into. Foundries, the move to 300 mm, alliances and research consortiums have all led to fewer locations where semiconductor equipment can be tested out and then sold to
the market. 'Copy exact' or 'copy smartly' policies have created an environment where one toolset is sold not just to one company, but to any company associated with that consortium. Overall, these factors have in some ways made it easier to sell into the industry but have limited the number of opportunities to become a tool of record.
• The shift of semiconductor manufacturing to Asia
Since the 1980s the semiconductor manufacturing centers have been shifting. Cheap capital as a result of government incentives saw the industry move from the Americas and Europe to Japan, then Korea and Taiwan. Asia-Pacific market share based on location of production has increased dramatically, from nearly 5 percent in 1990 to approximately 30 percent in 2003.
• The pace of technology.
The pace of technology change seems to increase every year. The technology cycle moved from a three-year cycle to a two-year cycle. This has increased the pace at which the semiconductor equipment manufacturer must develop products and has extended the time period that a semiconductor equipment manufacturer must support its equipment. The industry now has 45 nm in development, 65 nm in pilot line production, 90 nm ramping, 130 nm ramping, 180 nm still running at full volume, and some capacity is still being added. Thus, an equipment manufacturer may need to support up to five different generations simultaneously with resources once needed to support only three generations of technology. This can be a significant drain on company resources.
Along with the faster-paced roadmap, semiconductor equipment manufactures are dealing with a significant number of material changes. Low-k, hi-k and metal gates along with new substrates are a few of the more significant challenges ahead. This process and product development will take a significant amount of resources to implement into the semiconductor process flow. Equipment firms will need to form alliances with the material suppliers as well as work closely with the semiconductor manufactures to succeed. Firms failing to get in on the leading edge at key semiconductor manufacturers or consortiums will fall farther behind on the technology curve.
Over the past five years the industry has been suffering from an overall lack of profitability, both for chip manufacturers and equipment manufactures. Data about net profit as a percentage of sales for the past 10 years for 32 semi-equipment makers (see Figure 3-1) shows that the industry has run a slight deficit of 1.8 percent. The total dollars picture is a bit brighter, with the industry running a slight profit of 3.3 percent from 1994 to 2003, but the industry has struggled since 1997, with 2000 being the only year with significant profits since 1997. The semiconductor equipment industry also needs to examine how to regain and then maintain profitability in the years to come.
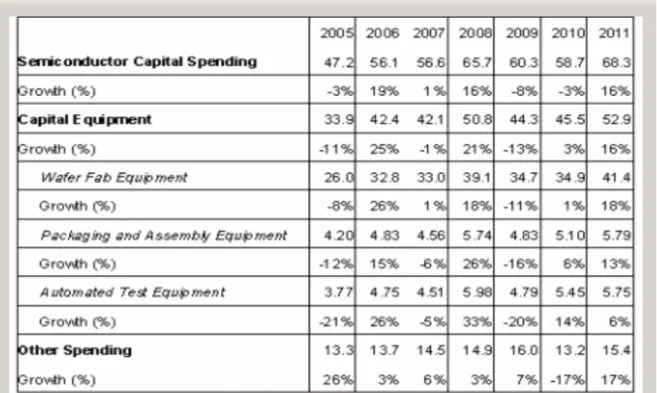
Figure 3-1: Semiconductor Equipment Companies Net Income (Bob Johnson) As far as the revenue trend forecast, Dataquest has reported a study in Dec., 2006 for the worldwide semiconductor capital and equipment spending forecasts (See Table 3-1 below).
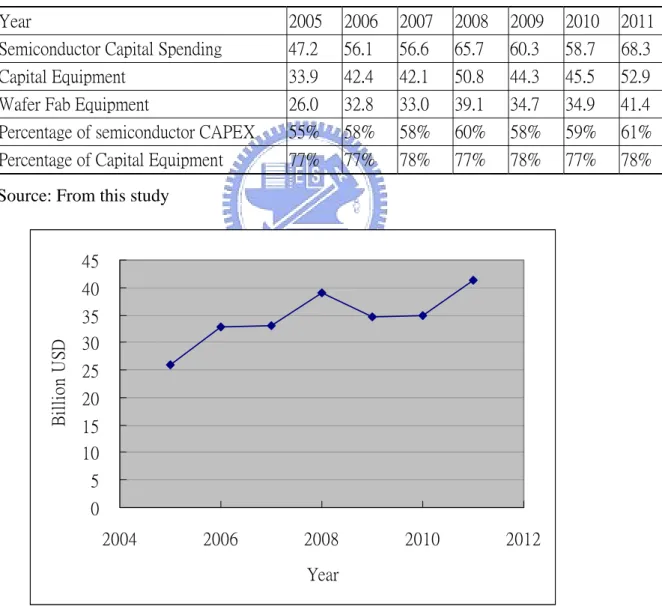
It clearly showed that Wafer Fab Equipment (WFE) is around 60% of the Semiconductor Capital Expense and almost 80% of the Capital Equipment expenditures (See Table 3-2). From this we can derive that the CAGR (compound annual growth rate) of WFE from 2005 to 2011 is 8.1% (see Figure 3-2), this is a further drops from the 10 to 12 percent in the past 10 years.
Table 3-2 Weighting of WFE expenditure as compared to total semiconductor capital Spending and Equipment Spending.
Year 2005 2006 2007 2008 2009 2010 2011 Semiconductor Capital Spending 47.2 56.1 56.6 65.7 60.3 58.7 68.3 Capital Equipment 33.9 42.4 42.1 50.8 44.3 45.5 52.9 Wafer Fab Equipment 26.0 32.8 33.0 39.1 34.7 34.9 41.4 Percentage of semiconductor CAPEX 55% 58% 58% 60% 58% 59% 61% Percentage of Capital Equipment 77% 77% 78% 77% 78% 77% 78% Source: From this study
0 5 10 15 20 25 30 35 40 45 2004 2006 2008 2010 2012 Year B ill ion U SD
Source: From this study
So combining the two trends of decreasing profitability and slower annual growth, unfortunately we need to face the fact that this industry may not be as lucrative as before, which should be about right since this industry is around 35 years old as of today.
One other thing that worth noticing is the cyclical nature of this industry (see Figure 3-3 below). The swing of equipment booking and shipping is way bigger than that of semiconductor shipment and the peak to valley ratio can be as high as 8. So we can still conclude that this industry will continue to be exciting and risky. Proper forecasting must be made to survive this cyclical nature.
Source: Dan Tracy, SEMI Equipment and Materials Outlook, Sept. 2006 Figure 3-3: Worldwide Fab Equipment Trend
3.1.2 Targeted markets, shares and geographical distributions
The semiconductor equipment industry obviously has a global market. Worldwide billings totaled $40.47 billion in 2006(7), compared to $32.88 billion in sales posted
in 2005. "The worldwide semiconductor equipment industry resumed strong growth in 2006 as the robust memory chip market and continued transition to 300mm wafers fueled sales of manufacturing technology," said Stanley T. Myers, president and CEO of SEMI. "With double-digit gains in all market regions, the equipment industry posted annual sales second only to the extraordinary levels in 2000."
For the third year in a row, the Japanese market region spent the most on semiconductor equipment, growing almost 13 percent over 2005 to reach US$9.20 billion. N. America reclaimed the number two spot with $7.32 in equipment sales. Following closely behind N. America were the regions of Taiwan and S. Korea with spending of $7.31 billion and $7.01 billion respectively. After experiencing negative growth in 2005, the China market region grew the most in 2006, rising over 74 percent to US$2.3 billion. The Rest of World region, which aggregates Singapore, Malaysia, Philippines, other areas of Southeast Asia and smaller global markets, increased almost 30 percent. The equipment market in Europe increased 10 in 2006.
The global wafer processing equipment market segment increased 26 percent; the assembly and packaging segment grew 14 percent, the total test equipment sales increased 21 percent.
Table 3-3 2005-2006 Semiconductor Capital Equipment Market by World Region
2005-2006 Semiconductor Capital Equipment Market by World Region (Dollars in U.S. Millions; Percentage Year-over-Year)
Region 2005 2006 % Change China 1,327 2,315 74.4 Europe 3,262 3,595 10.2 Japan 8,183 9,209 12.5 Korea 5,826 7,014 20.4 North America 5,702 7,324 28.4 Taiwan 5,722 7,308 27.7 Rest of World 2,862 3,709 29.6 Total Regions 32,884 40,474 23.1 Source: SEMI-SEAJ 3.1.3 WFE segments
The business of WFE market could be divided into different segments including new leading edge fab, new non-leading edge fab, new specialty fab, upgrades and end of life.(See Figure 3-4)
Figure 3-4 WFE market segmentation (David Anderson, International SEMATECH, Global Economic Symposium)
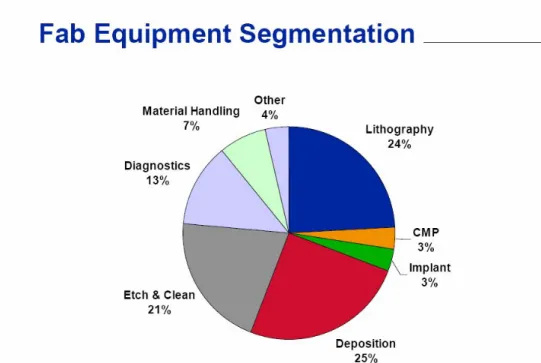
Among them, we can further break down the tools by into different production modules. That will include Lithography, CMP, Implant, Deposition, Etch and Clean, Diagnostics, Material Handling and others. See Figure 3-5 for billings trend and as it can be seen, the fluctuation is quite big. Find also Figure 3-6 for market share data in 1999.
Source: Advanced Forecasting, September 2005. Figure 3-5: Bookings -Semi Equipment Billings:
Figure 3-6: Fab Equipment segmentation by percentage (David Anderson)
3.2 Introduction to Lam Research Corporation
3.2.1 Basic data of Lam Research Co (www.lamrc.com) Corporate Snapshot
• Founded in 1980
• Corporate offices in Fremont, CA, USA • Approximately 2,250 employees worldwide
• 39 regional offices located in the United States, Europe, Japan, and Asia Pacific
Lam Research Corporation is a major supplier of wafer fabrication equipment and services to the world's semiconductor industry. The Company's innovative etch technologies empower customers to build the world's highest-performing integrated circuits. Lam's etch systems shape the microscopic conductive and dielectric layers into circuits that define a chip's final use and function. The Company also offers a next-generation wafer cleaning solution, which employs proprietary technology and can be used throughout the semiconductor manufacturing process. Headquartered in
Fremont, California, Lam maintains a network of facilities throughout the United States, Asia, and Europe to meet the complex and changing needs of its global customer base.
Lam is both the market share and technology leader for etch semiconductor processing equipment. Over the years, Lam has consistently provided innovative technologies to address the challenges of semiconductor manufacturing. The significance of several of these industry firsts has helped shape technology trends in the industry.
These innovations include:
z Being first to commercialize an inductively coupled plasma source technology with a planar coil
z Introducing Dual Frequency Confined™ (DFC™) technology for dielectric etch Developing the first 200/300 mm capable etch product line with a 200 mm comparable footprint
z Enhancing advanced process control (APC) capability in anticipation of future 300 mm requirements
z Decoupling of plasma density and bias power for conductor etch
z Providing unique technologies to control parameters that impact critical dimension (CD) uniformity
z Introducing an in situ clean strategy performed after each wafer is processed
As part of Lam's mission to provide innovative productivity solutions in etch, the Company's scientists and engineers strive to be first to introduce new capabilities to ensure customer competitiveness. Lam's core technologies include TCP high-density source technology for conductor (metal and silicon) etch and DFC medium-density
plasma source technology for dielectric etch processes.
Lam's systems employ these technologies to provide advanced solutions for the conductor and dielectric etch processes in the manufacture of integrated circuits.
Lam's innovative technologies position the Company to continue gaining market share in the emerging growth markets including back-end copper/low k interconnect processes and front-end gate processes involving new materials and approaches.
Below are the awards and rankings:
z Forbes Best Managed Companies in America list z Business Ethics 100 Best Corporate Citizens list
z The Business Journal Top 25 Largest Semiconductor Equipment Manufacturers list
z Silicon Valley 150 list
z Semiconductor International Editor’s Choice Best Product Awards for 2300 Exelan and 2300 Versys
z San Jose Magazine 50 Best Places to Work list
Financial Snapshots are listed as the following: • Initial public offering in 1984
• Common stock trades on the NASDAQ National Market® under the symbol LRCX • Member of the NASDAQ-100® Index and S&P 400 Mid-Cap Index
3.2.2 Core competency of Lam Research Co
The core competencies of Lam are Technology Innovation and Efficient customer support network.
Throughout its history, Lam has been the technology innovator in the semiconductor etch marketplace. It has consistently delivered technology breakthroughs that have advanced the state of the art for semiconductor etch and enabled leading semiconductor manufacturers to meet their technology roadmap goals.
Customers are many of the world’s leading semiconductor manufacturers, including logic and memory producers as well as foundries. Due to changing manufacturing requirements, the selection of next-generation process equipment is a critical component of their future success. By addressing these challenges, Lam’s differentiated products and services continue to drive market share gains. Besides that, its ValuePoint™ Optimized Productivity Services™ portfolio is designed to optimize customers’ equipment sets and support services as needs change throughout their product cycles.
3.2.3 Competitive Strategy
New technology for process equipment can take 2-3 years to develop into a production-worthy system. Therefore, suppliers need to know customer requirements 3 years in advance. However, neither customers nor industry technology roadmaps can definitively identify requirements that far into the future. Consequently, these uncertainties can significantly add to equipment development costs, and strategies are needed to enable providing cost-effective equipment to semiconductor manufacturers now challenged by increasing costs and lower revenues. At Lam, three key strategies are employed to ensure providing timely, cost-effective solutions:
Investment in research is based on development needs rather than a percent of revenue. At any given time, technology is in development at several stages -current technology transitioning to volume manufacturing, near-term technology in pilot lines, and next-generation technology at the R&D stage. In addition, product roadmaps with parallel development paths are maintained -based on a range of known viable options with the flexibility to implement new technologies that may emerge. This approach ensures a range of potential solutions to address a variety of customer requirements. 2. Pursuit of joint development relationships.
Relationships with leading-edge customers, supplier alliances, and consortia activities are actively pursued and developed to identify technology needs and define the focus. These activities ensure the right solutions are ready when customers need them.
3. Leveraging the Company's technology expertise
Lam leverages its core expertise in etch and cleaning to develop new technologies. Company engineers also evaluate related new technologies designed by other companies that can be developed into products quickly and at lower costs. Staying focused on the Company's technology expertise allows Lam to seize emerging opportunities quickly and provide cost-effective product solutions.
Lam has implemented a highly successful business model, with resources focused on core competencies-technology development and customer support. Recent Company achievements include:
• Higher cycle-to-cycle profitability with higher gross margins during periods of strong market share growth.
• Significantly improved cash generation, including strong free cash flow and a higher level of retained earnings.
• A stable employment environment in a cyclical industry, enhancing the ability to attract and retain world-class engineering talent
• An environment dedicated to building on core competencies, leading to: - Executive management focused on strategic planning
- More expedient new product development - Improved customer support
- Enhanced competitive differentiation
3.3 Introduction to Applied Materials 3.3.1 Basic data of Applied Materials
Applied Materials, Inc. (*NASDAQ: AMAT) is the global leader in nanomanufacturing technology solutions with a broad portfolio of innovative equipment, service and software products for the fabrication of semiconductor chips, flat panels, solar photovoltaic cells, flexible electronics and energy efficient glass.
Founded in 1967, Applied Materials creates and commercializes the nanomanufacturing technology that helps produce virtually every semiconductor chip and flat panel display in the world. The company recently entered the market for equipment to produce solar arrays and energy efficient glass.
Applied Materials service products improve yield enhancement and increase nanomanufacturing productivity.
To support its customers, Applied Materials employs approximately 14,000 people throughout the world. In fiscal year 2006, Applied Materials recorded net sales of U.S. $9.17 billion.
3.3.2 Core competency of Applied Materials
The core competency could be divided into several categories: (施純巧), 1. Tangible resources
A. Healthy financial status. Like in 2004, its revenue reaches 8.013 Billion USD with 1.351 Billion net profit. The accumulated cash reaches 2.28 B Billion.
B. It ranks 270th in Fortune top 500 and 5th in semiconductor electronics and devices companies.
2. Intangible resources
A. Numerous patents. In 2004 alone it has got more than 400 patent in U.S. B. Superior image and public relation. It is in Business Ethics 100 Best
Corporate Citizens list in 2004 and is the first semiconductor equipment supplier company that is ISO certified.
C. It has five R&D engineering centers around the globe and more than 90 branch offices to facilitate fast response and service to its customers. D. Built long term relationship with customer and focus on customer
satisfaction. Got numerous awards as best suppliers. 3. People capability
Former CEO James C. Morgan’s achievement and its effort on stock return rate was compared to that of GE’s Jack Welch. Business Week also comments that he is among the best CEOs in the U.S. He was considered as the most influential leaders in Silicon Valley together with former Intel President Andy Grove.
4. Organization capability
A. The capability of innovation and integration: New product development and commercialization is Applied Materials’ core competency. It has
developed and launched 75 products in 20 years. The R&D expenditure was as high as 15% since the 80s.
B. The capability of marketing and sales: It has broad product lines with average market share as high as 50%. It has great advantage of scale of economy. Its early into market strategy and diversified product portfolio makes it possible to have flexible sales tactics.
C. Sound knowledge management system and the culture of learning organization make the whole world as one big net. With systematic linkage, customer’s need is easily satisfied.
D. Complete functional organization makes customized service possible. Total solution and one stop shopping concept could be deployed.
3.3.3 Competitive Strategy
Refer to May Ho (2002)’s study of “Strategy Analysis of the Success of Applied Materials Inc”, we can summarized its competitive strategy in the three following categories:
Business and Markey strategies:
1. Carefully choose strategic customer, then aggressively invest to establish strong and early partnership (ex. Intel, TSMC)
2. Launch product earlier than competitor, even when product is not fully mature. Aiming to gain early presence in the market and “lock” customer’s resource on performance enhancement activities in factory.
3. Flexible pricing strategies to leverage strong and weak products. 4. Differentiate by continuously providing new value to customers
i. First in industry to guarantee process performance in early 90s.
Supplier Performance) meeting with key customers.
iii. First in industry to start parts consignment and TPM (total parts management), further anchoring partnership.
iv. First in industry to introduce “process module” solutions.
Technology development strategies:
1. Focus on core competence and targeted market
2. Leverage multi-product portfolio to achieve synergy and new value offer 3. Adopt M&A to achieve synergy
Infrastructure strategies: 1. Global infrastructure
A. Aggressively invest in regional sales and service team to ensure best service level and high efficiency of technology performance improvement and enhancement activities.
B. Industry-first to invest regional applications lab and training facility to facilitate “bring capability to customer” concept, and foster process development activities to strengthen technology partnership.
2. Organization is tailored to facilitate the most convenient communication channel and service quality for customers. (ex. Account management)
3. Focus best resources on core competence. Spend minimum resources to manage company’s non-core operations
Chapter Four: Operation effectiveness and efficiency analysis
While EVA is utilized as a measure of operation effectiveness, the corporate operation activities could be firmly combined with “value creation”. In this chapter, we first discuss the key factor of value creation- EVA theory, and then its operation measurement indexes will be used to measure our companies- Lam Research Corporation, benchmarked with those of Applied Materials.4.1 How Key Value Drivers are reflected by EVA terms From Chapter 2, we have derived that
Company Value= Invested Capital + Present Value of future Expected EVAs
= Invested Capital +
=Invested Capital+ + Continuing Value
Where Continuing Value=
(EVAt+1/WACC)+ (NOPATt+1 ( IROIC-WACC) g)/ (( WACC (WACC-g) IROIC))
Also we had EVA= NOPATt-(WACC x Invested Capitalt-1
From the above equation, we know that the main parameters that impact business value are:
1. ROIC: Return on Invested Capital. The higher ROIC is, the better it can utilize the invested capital to create net profit.
2. WACC: Weighted average cost of capital. The lower WACC is the better for having positive net profit.