自願性會計政策變更與盈餘宣告後股價持續反應之研究 - 政大學術集成
61
0
0
全文
(2) 謝辭 回想踏入研究所大門的這兩年,時光飛逝,忙碌且充實,直至論文完成,我才 終於意識到這趟旅程已經邁向終點。一路以來,謝謝老師、家人、朋友的幫助和鼓 勵,我才能持續突破自我、向前邁進,並順利完成人生中第一本論文,藉由這個版 面,我要向這些人生中的貴人獻上心中感謝之意、感激之情!. 首先,我要感謝我的指導教授諶家蘭老師,從碩一開始就與老師結緣,擔任研. 治 政 大 與我討論、教導我,使我訓練出清晰明確、具邏輯性的思維,在面對各種報告時都 立 能更有效率的去分析處理,進而使得在撰寫論文時能較快速的步上軌道。再者,也. 究助理的工作,無論是在助理的工作上,抑或是研究過程中,老師都細心、耐心的. ‧ 國. 學. 非常感謝遠在夏威夷的王大維老師對我的幫忙與鼓勵,從碩一開始懵懵懂懂的加入 老師們的研究,王老師一直都不厭其煩的回答我的各種問題,當遇到困難時也提供. ‧. 我各種協助,引領著我前進,使得第一次參與研究的我受益良多。而後到論文寫作. y. Nat. 時期,老師也總是耐心的教導我,使得我的論文能夠順利持續進行。我真誠的覺得. io. sit. 能成為諶老師和王老師的學生真的是我學生生涯中既榮幸又幸運的事。此外,也很. n. al. er. 感謝兩位口試委員王泰昌教授和蔡揚宗教授在百忙中抽空參與口試並提供許多非. i n U. v. 常寶貴的意見,兩位老師鞭辟入裡的評論,使我能了解需要改進或是更進一步思考. Ch. engchi. 的地方,並對於自己的研究領域更透徹了解。. 另外,非常感謝子齡學姐都在我徬徨時總是為我指點方向,無論是在未來求學 的選擇上或是論文的寫作上,學姐總是願意花時間與我聊天,賦予我「安心」的力 量,讓我能更堅定的向前走。也很感謝 101 級的同學們,使得碩士生涯這一路上豐 富且快樂。謝謝上琄無論是在上課或是論文寫作時,總是陪伴我度過各種難關,因 為有你,讓這整個研究過程中我不會感到孤單。謝謝唯真從碩一就提供給我這個政 大新鮮人各種幫忙和協助,也帶給我們歡樂的碩班生活,並在口試時義不容辭的幫 我們奔波籌備餐點,我很幸運能擁有如此義氣相挺的好友。謝謝怡全總是跟我一起.
(3) 面對大大小小的報告、一起度過許多歡樂的午餐時光,論文寫作過程中、口試前的 幫忙和打氣,我都銘記在心。. 最後,我要感謝最親愛的家人,謝謝我的外婆、爸爸、媽媽和姊姊總是願意聆 聽我每天發生的大小瑣事,在我遇到挫折時,總是第一時間給我安慰我、給我勇氣, 而在論文寫作期間,雖然有時因為壓力大或是遇到瓶頸導致情緒不穩,但你們總會 很有耐心的包容、體諒我,謝謝你們對我最真摯的愛,能成為你們的家人,是我人 生中,最幸福的事。. 立. 政 治 大 陳怡靜 謹誌於. ‧. ‧ 國. 學. n. er. io. sit. y. Nat. al. Ch. engchi. i n U. v. 2014.06.
(4) 摘要 本研究主要探討當公司管理階層選擇自願性會計政策變更時,是否影響市場對 於各該公司所發布相關訊息的反應情形,進而造成股價持續波動之狀況。本研究亦 探討是否會計政策的異質性(公司進行會計變更後採用與其同業不同的會計政策) 會影響到前述自願性會計變更與股價反映之關係。本研究以採用自願性會計政策變 更之美國上市公司為研究對象,樣本期間為 1994 年至 2008 年,並將研究對象之競 爭對手或產業領導者納入比較樣本。此外,為了觀察股價持續反應的情況,我們設 立了季報發布期間和季報發布後期間,以檢驗此研究之假說。. 立. 政 治 大. 此研究結果顯示,整體來說,自願性會計政策變更在季報發布期間對於未預期. ‧ 國. 學. 盈餘和報酬的關係,會有顯著正向之關聯。此外,考慮了會計政策之異質性後,若 公司在會計變更後採取了與同業相同之會計政策,在季報發佈期間對於未預期盈餘. ‧. 和報酬的關係會有顯著正向之關聯,而在季報發佈後期間對於未預期盈餘和報酬的 關係會有顯著負向之關聯;若公司在會計變更後採取了與同業不同之會計政策,市. y. Nat. sit. 場在季報發布後期間對於未預期盈餘和報酬的關係會有顯著正向之關聯,比較多的. n. al. er. io. 資訊反映於季報發佈後期間。所以,當公司會計變更後採取異質性的會計政策,外. i n U. v. 部使用者對於公司發布之相關資訊可能無法及時的消化和理解,進而導致市場遞延 反應。. Ch. engchi. 因此,雖然公司採用自願性會計政策變更可能是為了要更真實反映公司之營運 狀況,提升外部人士對於公司的實質了解,但根據本研究的實證結果顯示,外部使 用者對於自願性會計政策變更後之相關訊息可能需要比較長時間的理解,導致股價 會有持續反應的情況。. 關鍵詞:自願性會計政策變更、盈餘宣告後股價持續反應.
(5) Abstract This study investigates the relation between voluntary accounting changes (VACs) and post-earnings announcement drift. In addition, this study examines how accounting choice heterogeneity (different from the VAC firms’ peers) before and after VACs is associated with such association. This study collects VAC firms in the U.S. among 1994 to 2008 and identifies the heterogeneity of accounting choices between VAC and non-VAC firms. To test the hypotheses, this study considers the 10-Q filing window and a post-filing drift window.. 政 治 大 three-day market reactions to 10-Q filings. In addition, after taking into account the 立 accounting choice heterogeneity, this study observes that more of earnings-related stock The results demonstrate that, overall, VACs have a positive effect on the. ‧ 國. 學. price reaction occurs in the 10-Q filing window and less of earnings-related market reaction appears in the post-filing drift window. Moreover, VACs are positively. ‧. associated with the post-filing period drift when VACs are different from their industry peers after VACs.. That is, VAC firms adopting different post-change accounting. Nat. sit. y. method from non-VAC firms may make external users harder to digest related earnings. io. al. n. post-filing window.. er. information and lead to delayed market reaction, thus, more of stock price drift occur in. Ch. i n U. v. In conclusion, though VACs may enhance market participants’ understanding of. engchi. firms’ activities, the results demonstrate that market participants may spend more time to comprehend and digest VAC information disclosed by VAC firms compared to non-VAC firms, which leads to post-earnings announcement drift.. Keywords: voluntary accounting changes, post-earnings announcement drift.
(6) Table of Contents 1. INTRODUCTION ........................................................................................................ 1 1.1 Research Purpose and Motivation ......................................................................... 1 1.2 Research Questions ............................................................................................... 4 1.3. Research Structure ................................................................................................ 5. 2. LITERATURE REVIEW ............................................................................................ 6 2.1. Accounting Choice Changes ................................................................................. 6. 2.2. Voluntary Accounting Changes (VACs) ................................................................ 8. 2.3. Accounting Choice Heterogeneity ...................................................................... 12. 2.4. 政 治 大 Post-Earnings Announcement Drift .................................................................... 13 立. ‧ 國. 學. 3. METHODOLOGY..................................................................................................... 18 Hypothesis Development .................................................................................... 18. 3.2. Data Collection.................................................................................................... 21. 3.3. Research Method ................................................................................................. 26. 3.4. Research Model ................................................................................................... 27. ‧. 3.1. sit. y. Nat. io. al. er. 4. RESEARCH RESULTS AND ANALYSIS .............................................................. 33 Descriptive Statistics ........................................................................................... 33. 4.2. Empirical Results ................................................................................................ 39. n. 4.1. Ch. engchi. i n U. v. 5. CONCLUSIONS AND DISCUSSIONS ................................................................... 45 References ....................................................................................................................... 49 Appendix. Variable Definitions ..................................................................................... 53.
(7) List of Tables Table 1. Frequency Distribution of VAC Firms ...................................................... 22 Panel A. Year Breakdown............................................................................................. 22 Panel B. Industry Breakdown ...................................................................................... 23 Panel C. Types of Earnings Effect................................................................................ 23 Table 2. Descriptive Statistics ............................................................................. 35 Panel A. Full Sample .................................................................................................... 35. 政 治 大. Panel B. VAC Firms ..................................................................................................... 36 Panel C. Non-VAC Firms ............................................................................................. 37. 立. Table 3. Pearson/Spearman Correlation ................................................................ 38. ‧ 國. 學. Table 4. Results for VACs and Post-earnings announcement drift (Full Sample) ......... 40. ‧. Table 5. Results for VACs and Post-earnings announcement drift (Accounting Choices. n. al. er. io. sit. y. Nat. Heterogeneity) ................................................................................... 44. Ch. engchi. i n U. v.
(8) List of Figures Figure 1. Research Process and Structure .......................................................................... 5 Figure 2. Timeline of Information Events and Windows ................................................. 27. 立. 政 治 大. ‧. ‧ 國. 學. n. er. io. sit. y. Nat. al. Ch. engchi. i n U. v.
(9) 1. INTRODUCTION 1.1 Research Purpose and Motivation Accounting changes can be divided into two categories. One class is mandatory accounting changes (MACs), and the second class is voluntary accounting changes (VACs). MACs are that firms should follow the accounting regulations government enact with no reason, while VACs are that firms can make accounting changes. 治 政 大environment of firms, which is is to better reflect the investment and operating 立 consistent with the tenor of GAAP that allow for a choice among acceptable accounting voluntarily with certain intention. The management primarily claims that making VACs. ‧ 國. 學. methods. Firms that make voluntary accounting changes claim that the change can better. ‧. reflect the firms’ activities or economic reality, and the informativeness of earnings (Healy and Palepu 1993; Holthausen and Leftwich 1983). However, several studies. y. Nat. er. io. sit. argue and show that firms voluntarily change their accounting practices may have the intention to manipulate or smooth reported earnings (Fields et al. 2001; Pincus and. n. al. Wasley 1994).. Ch. i n U. v. For example, Cheng and Coulombe (1993) report that, relative to the. engchi. Compustat population, firms that adopt income-increasing changes may indicate financial. distress.. Dharan. and. Lev. (1993). suggest. that. firms. adopting. income-increasing accounting changes may have other hidden or fundamental issues that are revealed after the accounting changes.. Beatty and Weber (2003) indicate that when. the calculation of bank debt contracts can be influenced by accounting changes, firms prefer to adopt income-increasing changes instead of income-decreasing changes.. 1.
(10) In addition to the discussion the motivation of firms adopt VACs, several studies research on how external users response to VACs-related information.. Bradshaw et al.. (2008) and Wang et al. (2013) state that when firms’ accounting choices are different from those of their industry peers, there are larger analysts’ forecasts errors as well as dispersion and fewer analysts following the firm because of the increasing complexity of analysts’ tasks.. Both papers argue that with the existence of voluntary accounting. changes (VACs), external financial report users may spend more efforts when processing. 政 治 大. and digesting the earnings-related information.. 立. According to (semi-strong form of) efficient market hypothesis, investors in. ‧ 國. 學. efficient market will promptly adjust their expectations in relation to future earnings when receiving new information, which will instantaneously be reflected in stock prices.. ‧. However, Ball and Brown (1968) documented the phenomenon, which called. y. Nat. sit. post-earnings announcement drift, that stock prices still continue to drift up (down) for. n. al. er. io. good (bad) news firms even after earnings announcements. The observation of. i n U. v. post-earnings announcement drift suggests that the stock prices continue to drift after. Ch. engchi. earnings announcements (Ball and Brown 1968) due to incomplete risk adjustments in the estimation process of abnormal returns (Kim and Kim 2003) and/or delayed price response (Bernard. and Thomas 1990) (i.e., the market may be incapable of fully interpreting the implications of earnings information, which results in a delay of responses).. For instance, Liang (2003) suggests that information processing biases of. investors will lead to market reaction drift.. Lee (2012) also demonstrates that firms. with poorer readability disclosure in quarterly reposts may delay the speed at which earnings news is incorporated into stock prices. 2.
(11) Furthermore, several studies discuss about the relationship between VACs and market reaction. For instance, Linck et al. (2007) show little evidence between VACs and long-term abnormal returns as well as earnings informativeness while Dharan and Lev (1993) state that firms making accounting changes experience different long-term returns relative to other firms in the subsequent period.. Based on prior studies, this study investigates the consequence of VACs, and. 政 治 大. mainly focuses on the relation between VACs and post-earnings announcement drift.. 立. In addition, this research examines how accounting choice heterogeneity (different from. ‧ 國. 學. the VAC firms’ peers) before and after VACs is associated with the relation between VACs and post-earnings announcement drift.. ‧. n. er. io. sit. y. Nat. al. Ch. engchi. 3. i n U. v.
(12) 1.2 Research Questions Based on the research purpose, motivation and literature review, the research questions of this study is as follow:. 1. How are VACs associated with post-earnings announcement drift? 2. How is accounting choices heterogeneity before and after VACs associated with post-earnings announcement drift?. 立. 政 治 大. The remainder of the paper is organized as follows. In Section 2, review relevant. ‧ 國. 學. literature in VACs and post-earnings announcement drift. Research methodology is presented in Section 3.. In Section 4, the study presents the empirical results.. ‧. Conclusions are provided in Section 5.. n. er. io. sit. y. Nat. al. Ch. engchi. 4. i n U. v.
(13) 1.3 Research Structure The research process and structure in this study is presented as follows: Figure 1. Research Process and Structure. Introduction. 立. 政 治 大. Literature Review and Hypothesis Development. y. ‧. ‧ 國. 學. Nat. n. er. io. al. sit. Research Methodology. Ch. engchi. i n U. v. Emprical Results and Analysis. Conclusions and Discussions. 5.
(14) 2. LITERATURE REVIEW 2.1 Accounting Choice Changes Fields et al. (2001, 256) define accounting choice as “an accounting choice is any decision whose primary purpose is to influence (either in form or substance) the output of the accounting system in a particular way, including not only financial statements published in accordance with GAAP, but also tax returns and regulatory filings.”. 治 政 大 accounting numbers. They with respect to the decisions made primarily for affecting 立 examine the determinants and consequences of accounting choice from research in. Fields et al. (2001) state that the key of this definition is managerial intent, especially. ‧ 國. 學. 1990s, and categorize them into three groups by goals or motivations of accounting. ‧. choice: (1) Contractual motivation. Contractual arrangements made to alleviate the internal (owner — manager) and external (bondholder—shareholder and current. sit. y. Nat. io. er. owner—potential owner) agency costs by better aligning the incentives of the parties is. al. partially depend on the determination of accounting choices. For example, management. n. iv n C compensation contracts and bond are commonly based on reported financial h ecovenants ngchi U accounting numbers (Healy 1985; Smith and Warner 1979). Managers may take advantage of their accounting discretion to maximize multi-period compensation provided by bonus plan. When earnings are expected to fall between the upper and lower bound of bonus plan, managers make income-increasing choices. (Healy 1985). Watts and Zimmerman (1986) propose the motivation for many studies of whether management compensation contracts provide incentives for managers to select among accounting methods to achieve desired financial reporting objectives. 6. (2) Asset pricing.
(15) motivation. Managers with the goal of affecting stock price may make certain accounting choices to influence equity valuation or the cost of capital. For instance, Levitt (1988) states that managers may make accounting choices in order to meet analyst earnings forecasts and to avoid the negative stock price reaction, which may lead to a missed forecast. Several studies also examine the relation between accounting number and stock return (Ball and Brown 1968; Dharan and Lev 1993). (3) Motivation due to impact on external parties. Managers may have an incentive to select accounting. 政 治 大. methods to reduce taxes or avoid potential regulations when external parties use. 立. accounting-based information or information conforming to reported accounting. ‧. ‧ 國. 學. number.. Besides, Bradshaw et al. (2008) suggest that accounting choices have an. Nat. sit. y. influence on contracts, reported performance, and stock prices. Hence, through prior. n. al. er. io. studies, it seems that firms may determine accounting choices by several motivations or. i n U. v. certain intention. This study discusses the economic implications of accounting choices. Ch. engchi. and mainly focuses on the relation between VACs and stock price reaction.. 7.
(16) 2.2 Voluntary Accounting Changes (VACs) Accounting changes can be divided into two categories. One class is mandatory accounting changes (MACs), and the second class is voluntary accounting changes (VACs). MACs are that firms should follow the accounting regulations government enact with no reason, while VACs are that firms can make accounting changes voluntarily with certain intention, and the study mainly focuses on the VACs part. Studies have examined the determinants and consequences of VACs.. 政 治 大. For example,. Pincus and Wasley (1994) report types, frequency, and earnings effects of VACs, and the. 立. economic characteristics of firms that make these changes. They examine accounting. ‧ 國. 學. changes from the perspectives of managerial opportunism (earnings management) and efficient (optimal) contracting. The perspective of managerial opportunism comprises. ‧. post-contract opportunism to influence wealth redistributions between managers and. y. Nat. sit. stockholders or between bondholders and stockholders, and attempts to increase their. n. al. er. io. compensation or reduce the probability of violating provisions of debt covenants and. i n U. v. conceal poor operating performance. The perspective of efficient contracting is that. Ch. engchi. changes in the economic environment can lead to changes in firms' optimal contracting technologies. Under this condition, VACs are viewed as rational responses to changing contracting technology, and are made to minimize contraction costs and maximize firm value. However, the latter is supported by limited evidence. That is, they show that VACs are more likely to be made for the intention of earnings management or smoothing reported earnings. Dharan and Lev (1993) also provide descriptive evidence demonstrating that earnings management is a managerial motivation for changing accounting methods. 8.
(17) Moreover, several researches examine whether debt covenants affect borrowers’ decisions to change accounting methods. Healy and Palepu (1990) show that when firms close to violating their lending covenants and suffering from cash management concern, they may adopt the strategy such as dividend cuts or omission rather than making income-increasing accounting decisions, and Fields et al. (2001) argue that there is inconclusive evidence on whether accounting choices are motivated by debt covenant. However, Watts and Zimmerman (1986) suggest that debt contracts that make covenant. 政 治 大. thresholds a function of financial ratios give borrowers a motivation to make accounting. 立. changes to avoid costly covenant violations. Beatty and Weber (2003) examines whether. ‧ 國. 學. the provisions of a firm’s bank debt contracts influence its voluntary accounting choices, and find that firms are more likely to make income-increasing changes rather than. ‧. income-decreasing changes when bank debt contracts let accounting changes to affect. sit. y. Nat. contract calculations. They also find that if firms’ debt contracts include. n. al. er. io. accounting-based performance-pricing or dividend restrictions, borrowers are more. i n U. v. likely to make voluntarily income-increasing accounting changes. That is, gaining lower. Ch. engchi. interest rates through performance-pricing or keeping dividend payment flexibility are both the incentives of making VACs.. We can classify the impact of accounting changes related to earnings of firms into income-increasing accounting changes, and income-decreasing accounting changes. Papers have also focused on the motivation of income-increasing or income-decreasing VACs decisions. Dharan and Lev (1993) suggest that through the five years subsequent to the year of accounting changes, they find that firms originally making 9.
(18) income-decreasing decision have more abnormal return than the firms with income-increasing decision; the latter have large negative returns over the period. They also indicate that when facing the income-increasing accounting changes, investor’s valuations reflect a concern for the reduced quality of earnings, which reflected by smaller earnings response coefficients and r-squared. It suggests that income-increasing accounting changes may be the first manifest sign of other hidden, fundamental problems in firms that will be exposed in following years. Besides, firms perhaps prefer. 政 治 大. making income-increasing accounting changes when debt contract is allowed to affect. 立. its calculation by accounting changes or include accounting-based performance-pricing. ‧ 國. 學. (Beatty and Weber 2003). In the perspective of economic factors motivating accounting method decision, which assumed that accounting choices are a function of political costs,. ‧. manager’s compensation plan, and debt constraints, Cheng and Coulombe (1993) report. Nat. sit. y. that, relative to the Compustat population, firms adopting income-increasing changes are. n. al. er. io. related to financial distress.. Ch. engchi. i n U. v. Bradshaw et al. (2008) state that accounting choices are important since that they will influence contracts, reported performance and stock prices. There are papers discussing about market reaction of VACs.. For example, Linck et al. (2007). investigate the relation between VACs and equity prices by examining long-run stock-price performance and research changes in earnings informativeness in years surrounding the VAC event by examining the behavior of earning response coefficients and the relationship between earnings and future cash flows. They suggest that earnings informativeness is not significantly changed by VACs. Their results also show little 10.
(19) evidence that, within an efficient market, trading strategy based on the earnings effect of a VAC generate abnormal profits, which is different from prior researches. For instance, Dharan and Lev (1993) examine the valuation consequence of accounting changes and find that investors’ seem to largely ignore the accounting changes in the year they are made, whatever income-increasing changes or income-decreasing changes are adopted. However, their longitudinal test shows that firms making accounting changes experience different long-term returns relative to other firms in the subsequent period after accounting changes.. 立. 政 治 大. ‧ 國. 學. This study also investigates the consequence of VACs.. This research focuses. on the relation between VACs and post-earnings announcement drift and further. ‧. examines the relation between accounting choices heterogeneity before and after VACs. Nat. n. al. er. io. sit. y. and post-earnings announcement drift.. Ch. engchi. 11. i n U. v.
(20) 2.3 Accounting Choice Heterogeneity Firms have discretionary power to make accounting changes and choose the accounting method voluntarily. Regarding the determinants and consequences of VACs, firms may state that VACs can attribute to better reflect the economic reality of firms’ activities and earning performance, while several studies refer VACs to contractual motivation, financial reporting objectives, or poor operating performance (Holthausen and Leftwich 1983; Healy and Palepu 1993; Pincus and Wasley 1994; Fields et al. 2001;. 政 治 大. Bradshaw et al. 2008). Due to a variety of motivation behind VACs, the information. 立. processing of external financial report users will be influenced. Moreover, when the firm. ‧ 國. 學. adopt a VAC which is different from their industry peer, external financial report users may get harder to digest relative information revealed by VAC firms. Wang et al. (2013). ‧. state that, due to the increasing complexity of analysts’ tasks when firms’ post-change. y. Nat. n. al. er. Bradshaw et al. (2008) examine whether atypical accounting methods. io. will decrease.. sit. accounting methods are different from their industry peers, analysts following of firms. i n U. v. within an industry have an influence on analysts’ forecasts of future performance. They. Ch. engchi. find that the variation in accounting method raises the information processing costs of external users and is connected with larger analyst forecast errors and increased forecast dispersion.. Based on prior literatures, the study considers the characteristics of VACs and examines the relation between accounting choices heterogeneity before and after VACs and post-earnings announcement drift. . 12.
(21) 2.4 Post-Earnings Announcement Drift Ball and Brown (1968) first documented the phenomenon of post-earnings announcement drift that stock prices continue to drift after earnings announcements. Since then, researchers have investigated the phenomenon and attempted to provide explanations. Competing explanations for post-earnings announcement drift generally fall into two categories.. One is the model used to calculate abnormal returns, which. leads to incomplete risk adjustment in the estimation of abnormal returns.. 政 治 大. Kim and. Kim (2003) argue that most of prior studies related to post-earnings announcement drift. 立. may use the mis-specified models and fail to adjust raw returns fully for risk. The. ‧ 國. 學. other category of explanations suggests that, the stock prices fail to fully reflect the current earnings surprise.. Kormendi and Lipe (1987) and Freeman and Tse (1989). ‧. suggest that responses to current earnings reflect at least some of the implications for. Nat. Bernard. sit. y. future earnings, but that doesn’t mean the immediate response is complete.. n. al. er. io. and Thomas (1989) show that the evidence is inconsistent with the explanations based. i n U. v. on incomplete risk adjustment but due to delayed price response. Why does the market. Ch. engchi. fail to response to earnings information instantaneously?. One possibility is that transactions costs impede a complete and instant response to earnings information.. Bhushan (1994) uses the informational efficiency framework,. in this perspective, trading and investment by professionals help bring prices consistent with fundamentals. However, since that transaction costs can prevent professionals from trading in its shares, firms can be mispriced.. Bhushan (1994) divides transactions costs. into two parts: direct costs (include percent bid-ask spreads and commissions) and 13.
(22) indirect costs (include the adverse price effect and the delay in processing the transaction). Due to the evidence revealing that direct costs of trading are inversely related to share price and larger trades of stocks can be accomplished without delay or adverse price impact, the proxy for the inverse of direct and indirect costs of trading are share price and annual dollar trading volume, respectively. The paper shows that the post-earnings announcement drift is positively related to transactions costs and suggests that transactions costs are an important determinant of the efficiency of capital markets.. 政 治 大. Ng et al. (2008) use standard market microstructure features to examine the effect of. 立. transaction cost in the post-earnings announcement drift. They suggest weaker abnormal. ‧ 國. 學. returns at earnings announcement and higher returns at the subsequent period, for firms with higher transaction costs. Thus, transaction costs restrain profitable trades by. ‧. informed investors that are required to drive the market price in line with the. Nat. sit. y. fundamental value at the time of earnings announcement. Transaction costs can provide. n. al. er. io. an explanation for the persistence and existence of post-earnings announcement drift (Ng et al. 2008; Chung and Hrazdil 2011).. Ch. engchi. i n U. v. It is also possible that that the market is incapable of fully interpreting the implications of earnings information due to information processing capabilities.. Liang. (2003) examines the relation between information processing biases and post-earnings announcement drift. The empirical evidence shows that drift positively relate to heterogeneous information and negatively relate to the change in uncertainty around earnings announcements. It seems that two important factors which explain drift are investors’ overconfidence about their private information and under confidence of more 14.
(23) reliable information. Ayers et al. (2011) also state that large traders’ under reaction and the related drift may be referred to a longer price discovery process when earnings are more difficult to interpret.. Asthana (2003) argues that as a result of information. revolution, the cost of accessing and shipping information of companies is greatly reduced. Such information revolution indeed affect the informational efficiency of the capital market and reduce the post-earnings announcement drift, after controlling for several factors, such as time, size, investor sophistication, and sign of analysts’ forecast. 政 治 大. errors, etc. That is, the advance in information technology may reduce trading friction. 立. and promote informational efficiency.. Engelberg (2008) examines the relation between The paper suggests that. ‧ 國. 學. information processing cost and post-earnings drift.. information is heterogeneous in type and classify then into hard (such as an income. ‧. statement of a firm) and soft (such as the transcript of firms’ conference call). Nat. sit. y. information. Hard (soft) information has higher (lower) processing costs, which lead to. n. al. er. io. under reaction phenomenon after earnings announcement (i.e., when information. i n U. v. processing is costly, information may not be incorporated into stock prices instantly and completely).. Ch. engchi. Besides, readability of quarterly reports can also affect information processing capabilities. For example, Lee (2012) investigates how readability of quarterly reports affects the speed at which earnings news is impounded into stock prices. The results reveal that less (more) of the earning-related information is reflected in stock prices during 10-Q filing (post-filing drift) window for firms with poorer readability disclosure in quarterly reports. That is, only providing more disclosures of quarterly report do not 15.
(24) facilitate market efficiency, quarterly report readability should further be considered. In addition to the speed of investors’ response to new information that may lead to post-earnings announcement drift, studies also attribute the market reaction phenomenon to analysts’ slowness in revising their earnings forecasts. Such as Zhang (2008), examines the responsiveness of sell-side security analysts’ forecast revisions after quarterly earnings announcements and shows that the earnings response coefficient in the event window is significantly higher and the corresponding post-earnings. 政 治 大. announcement drift is significantly lower for firm-quarters with responsive analysts.. 立. Thus, responsiveness of analysts will reduce the drift and contribute to market. ‧. ‧ 國. 學. efficiency.. Several studies examine whether individual investors or institution investors Bartov et al. (2000) assume that there are. sit. y. Nat. influence post-earnings announcement drift.. n. al. er. io. two types of investors in the market. Market participants who are experts in gathering. i n U. v. and processing public information called sophisticated investors, and others called. Ch. engchi. unsophisticated investors. Institutional investor holdings of a stock are used as a proxy for investor sophistication. They illustrate that, because sophisticated investors are expected to characterize the process underlying earnings correctly and unsophisticated investors perceive the process to be a seasonal random walk, the degree of abnormal returns after earnings announcement is inversely related to the proportion of firm’s stock held by institutional investors. However, the results of tests evaluating the validity of institutional holdings as a proxy for their variable are mixed, which may affect the persuasiveness of their findings.. Hirshleifer et al. (2008) examine the relation between 16.
(25) actual daily signed trades made by individual investors after earnings surprises and subsequence returns, which is distinct from the indirect method used by prior studies (i.e., examine the fraction of shares held by institutions). They suggest that individual investors do not cause post-earnings announcement drift. Different from past studies, Ayers et al. (2011) argue that after earnings announcements, small (large) traders trade in the direction of seasonal random-walk-based (analyst-based) earnings surprises. Small traders’ fail to digest the time-series property of earnings, which lead to delayed small. 政 治 大. trades and larger traders have a longer price discovery process that is reflected in the. 立. delayed large trades. They also find that the more these traders react to the earnings. ‧ 國. 學. news during the announcement period, the lower magnitude of the post-earnings announcement drift will occur.. ‧. Nat. sit. y. Based on prior studies, this study investigates whether VACs are associated with. n. al. er. io. post-earnings announcement drift.. Ch. engchi. 17. i n U. v.
(26) 3. METHODOLOGY 3.1 Hypothesis Development 3.1.1 The relation between VACs and post-earnings announcement drift. Firms have discretionary power to choose the accounting method and adopt accounting changes voluntarily. VACs is supposed to better reflect the investment. 治 政 大 of the firm. However, as improve external financial reporting users’ understanding 立 mentioned earlier, some studies argue and show that VACs is related to earnings. and operating environment, which increases the transparency of the firms and. ‧ 國. 學. manipulation and may be an indicator of hidden problems of VAC firms (Fields et al. Linck et al. (2007) also. ‧. 2001; Pincus and Wasley 1994; Dharan and Lev 1993).. state that there is little evidence regarding firms adopting VACs to enhance earnings. y. Nat. er. io. sit. informativeness. As a result of indefinite determinants and consequences of VACs adopted by firms, financial report users may need more efforts to process earnings. n. al. Ch. i n U. v. information, and affect the ability of future earnings prediction with VACs.. engchi. Hirshleifer and Teoh (2003) argue that investors, analysts, and other securities market professionals have limited cognitive abilities and cannot attend to all information made available to them. Zhang (2008) suggests that the speed of market participants, specifically analysts, incorporating new information into their forecasts for future earnings is related to post-earnings announcement drift.. Moreover,. Engelberg (2008) state that when information processing costs are higher, stock prices cannot reflect information of firms immediately and completely. When the 18.
(27) market fails to fully and promptly interpret the implications of earnings information, the price responses will be delayed (Engelberg 2008; Lee 2012; Bernard and Thomas 1989).. Accordingly, the information of VACs adopting by VAC firms may let information processing costly to external users, which may impede external users’ capability to process information and lead to delayed price response. Thus, this study. 政 治 大. predicts that VAC firms after VACs, relative to non-VAC firms, less of the. 立. earnings-related market responses will take place during the 10-Q filing window and. ‧ 國. 學. more of earnings-related market responses will take place during the post-filing drift window. Formally,. ‧. Nat. sit. y. Hypothesis 1. VAC is negatively associated with the relation between earnings. n. al. er. io. surprises and market reactions on filing date and positively. i n U. v. associated with the post-filing announcement drift.. Ch. engchi. 3.1.2 The relation between VACs and post-earnings announcement drift regarding accounting choices heterogeneity. Hypothesis 1 fails to discuss the characteristics of VACs. This study also considers how accounting choices heterogeneity affect the association between VACs and post-earnings announcement drift.. I classify accounting choices. heterogeneity between VAC firms and their industry peers (non-VAC firms) into two 19.
(28) types: (1) the post-change accounting methods of VAC firms are similar as non-VAC firms, and (2) the post-change accounting methods of VAC firms are different from non-VAC firms.. Specifically, given that accounting choices are generally clustered. within industry (Bowen et al. 1999; McNamara et al. 2003; Bradshaw et al. 2008), industry peers provide an important reference point for users to comprehend accounting policy information. Bradshaw et al. (2008) show that when firms’ accounting choices are different from those of their industry peers, it leads to greater. 政 治 大. analysts’ forecasts error and forecast dispersion. That is, when a VAC deviates from. 立. industry practices, it requires more efforts to process related information.. ‧ 國. 學. In sum, after taking characteristics of VACs into consideration, accounting. ‧. choices heterogeneity may also influence other external users’ digestion of earnings. Nat. sit. y. information. This research predicts that when post-change accounting methods are. n. al. er. io. different from their industry peers, information processing costs of external users. i n U. v. may increase, which will reinforce the relation between VACs and post-earnings. Ch. engchi. announcement drift. Accordingly,. Hypothesis 2. The association in Hypothesis 1 is larger when the accounting policy adopted by the VACs firm after the VAC is different from that of its industry peers.. 20.
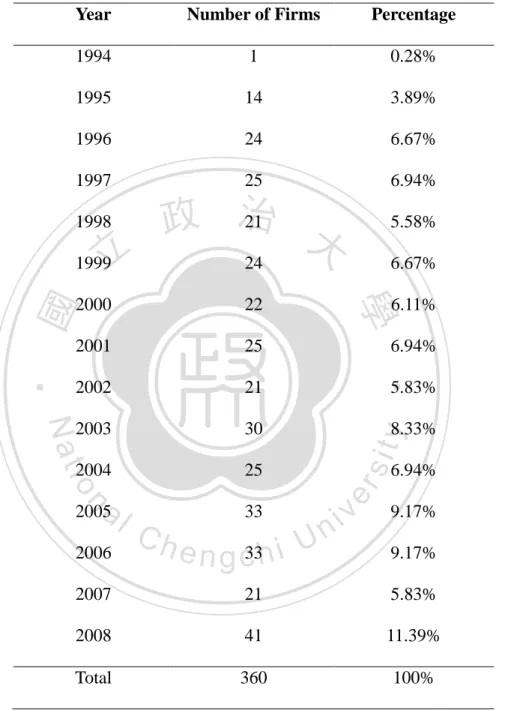
(29) 3.2 Data Collection This study focuses on U.S. firms with VACs.. In order to address the research. question, this study collects firms with VACs (the test group) and without VACs (the control group). Details are as follows.. For VAC firms (the test group), first, this study reviews the letters issued by audit firms related to accounting principles changes from 1994 to 2008 in Securities and. 政 治This 大 study can identify VACs from all. Exchange Commission’s (SEC’s) website.. 立. accounting changes and the note from audit firms.. 學. ‧ 國. accounting changes by the content of these letters, which express firms’ incentive of The process results in 360 VAC. firms, which does not include firms with more than two VACs in the same year.. ‧. Second, this research reads both the letters issued by audit firms and the VAC related. Nat. n. al. The year, industry distribution, types. er. io. (both financial and non-financial) of these VACs.. sit. y. disclosures in 10-Q filings from SEC’s website in order to acquire detailed description. i n U. v. of earnings effect of these firms are given in Table 1 Panel A, Penal B, and Penal C, respectively.. Ch. engchi. 21.
(30) Table 1. Frequency Distribution of VAC Firms Panel A. Year Breakdown Number of Firms. Percentage. 1994. 1. 0.28%. 1995. 14. 3.89%. 1996. 24. 6.67%. 1997. 25. 6.94%. 1998. 21 政 治 大. 5.58%. 1999. 24. 6.67%. 2000. 22. 6.11%. 2001. 25. 2002. 21. 6.94%. ‧. 2004. 25. io. 30. y. Nat. 2003. sit. 5.83%. n. al. 2005 2006. Ch. 33. e n g c33h i U. 8.33% 6.94%. er. ‧ 國. 立. 學. Year. v ni. 9.17% 9.17%. 2007. 21. 5.83%. 2008. 41. 11.39%. Total. 360. 100%. 22.
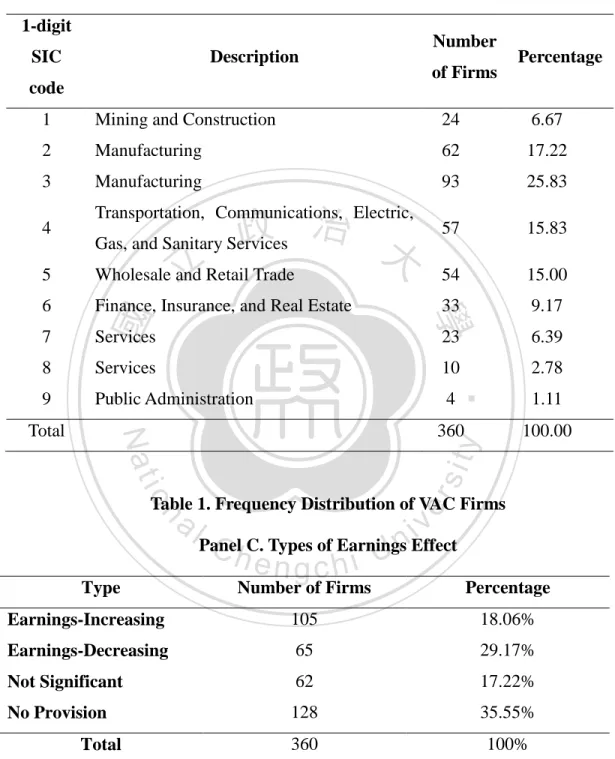
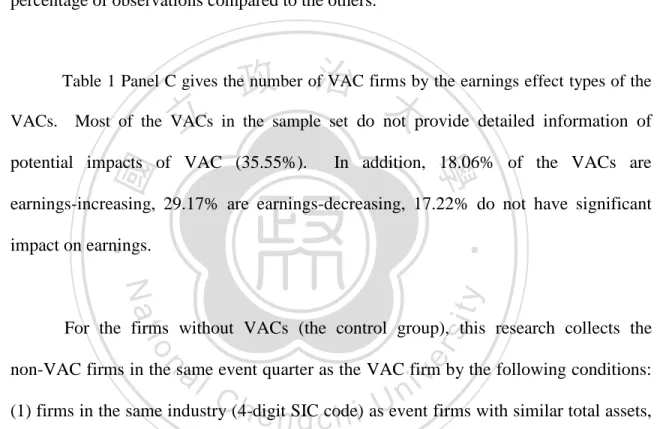
(31) Table 1. Frequency Distribution of VAC Firms Panel B. Industry Breakdown 1-digit SIC. Number. Description. of Firms. code. Percentage. 1. Mining and Construction. 24. 6.67. 2. Manufacturing. 62. 17.22. 3. Manufacturing. 93. 25.83. 57. 15.83. 4. 政 治 大. Transportation, Communications, Electric, Gas, and Sanitary Services. 立. Wholesale and Retail Trade. 54. 15.00. 6. Finance, Insurance, and Real Estate. 33. 9.17. 23. 6.39. Services. 10. 2.78. Public Administration. 4. 1.11. 360. 100.00. io. sit. y. Nat. Total. ‧. 9. Services. er. 8. ‧ 國. 7. 學. 5. Table 1. Frequency Distribution of VAC Firms. n. al. Type. Ch. i n U. v. Panel C. Types of Earnings Effect. engchi. Number of Firms. Percentage. Earnings-Increasing. 105. 18.06%. Earnings-Decreasing. 65. 29.17%. Not Significant. 62. 17.22%. No Provision. 128. 35.55%. 360. 100%. Total. 23.
(32) Table 1 Panel A shows that the number of VACs is mostly the same across years, though there are slightly more observations in 2005, 2007, and 2008.. In Table 1 Panel. B, the VAC firms are distributed based on the 1-digit SIC code. Panel B shows that Manufacturing (17.22% and 25.83%), Transportation, Communication, Electric, Gas (15.83%), and Wholesale and Retail Trade (15.00%) are the industries with the highest percentage of observations compared to the others.. 政 治 大 Most of the VACs 立 in the sample set do not provide detailed information of. Table 1 Panel C gives the number of VAC firms by the earnings effect types of the VACs.. ‧ 國. In addition, 18.06% of the VACs are. 學. potential impacts of VAC (35.55%).. earnings-increasing, 29.17% are earnings-decreasing, 17.22% do not have significant. ‧. impact on earnings.. sit. y. Nat. er. io. For the firms without VACs (the control group), this research collects the. al. n. iv n C h e nSIC (1) firms in the same industry (4-digit h i asUevent firms with similar total assets, g ccode). non-VAC firms in the same event quarter as the VAC firm by the following conditions:. (2) major competitors of a firm from Yahoo! Finance (http://finance.yahoo.com), and (3) a firm with the highest market share (i.e., the market leader) in the same industry (4-digit SIC code) as the event firm. These conditions are used because the accounting method choices are inclined to be similar within industry clusters, and firms may take their competitors as the main benchmark when making choices (Bowen et al. 1999; Bradshaw et al. 2008; McNamara et al. 2003).. 24.
(33) For the purpose of examining the relation between accounting choices heterogeneity before and after VACs and post-earnings announcement drift, after collecting all VAC firms and non-VAC firms, this study manually comprehends their accounting methods through 10-Q in SEC’s website in order to determine whether their corresponding accounting methods are the same before and after VACs for VAC and non-VAC firms.. In addition, in order to investigate how the market reactions change. before and after VACs, this study expands the dataset to include three quarters before and after VACs.. 立. 政 治 大. ‧. ‧ 國. 學. n. er. io. sit. y. Nat. al. Ch. engchi. 25. i n U. v.
(34) 3.3 Research Method 3.3.1 Descriptive Statistics Analysis This study adopts the descriptive statistics analysis to analyze all sample data. The items including numbers, means, medians, first quartiles, third quartiles, and standard errors are calculated, identified, and then displayed line by line. Thus, this study can realize the distribution of all sample data, VAC firms’ data, and non-VAC firms’ data and find out whether there is any extreme observation that may cause. 政 治 大. issues when performing the analyses. Besides, this research uses Pearson and. 立. Spearman correlation to make sure if there are collinear problems involved.. ‧ 國. 學. 3.3.2 Regression Analysis. ‧. This study uses multiple regression models to analyze the relation between. y. Nat. sit. independent variables (including intersections) and abnormal returns, in order to test. n. al. er. io. the hypotheses and investigates the association between VACs and post-earnings announcement drift.. Ch. engchi. 26. i n U. v.
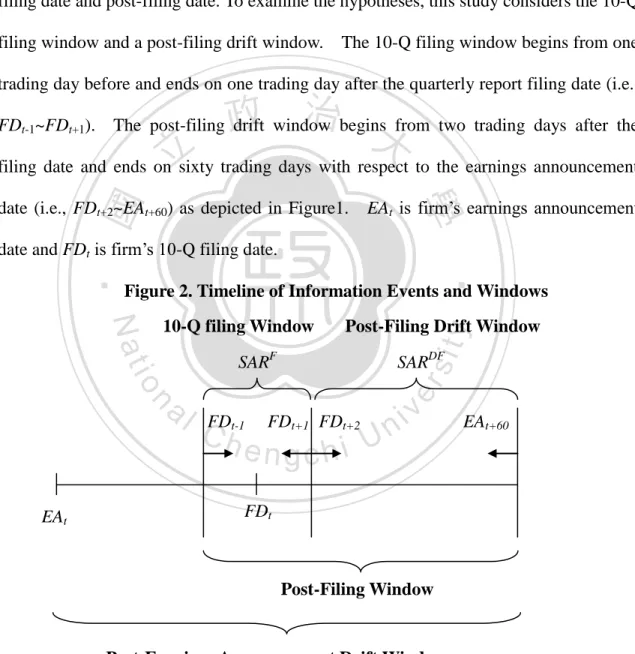
(35) 3.4 Research Model To test the relation between VACs and post-earnings announcement drift, as mentioned above, this study collects VACs-related information through 10-Q filings in SEC’s website. Hence, this research mainly focuses on the event window around 10-Q filing date and post-filing date. To examine the hypotheses, this study considers the 10-Q filing window and a post-filing drift window. The 10-Q filing window begins from one trading day before and ends on one trading day after the quarterly report filing date (i.e.,. 政 治 大. FDt-1~FDt+1). The post-filing drift window begins from two trading days after the. 立. date (i.e., FDt+2~EAt+60) as depicted in Figure1.. 學. ‧ 國. filing date and ends on sixty trading days with respect to the earnings announcement EAt is firm’s earnings announcement. date and FDt is firm’s 10-Q filing date.. ‧. Figure 2. Timeline of Information Events and Windows. sit. io. SARF. SARDF. n. al. EAt. y. Post-Filing Drift Window. er. Nat. 10-Q filing Window. CFDh. t-1. FDt+1 FDt+2. engchi. i n U. v. EAt+60. FDt. Post-Filing Window. Post-Earnings Announcement Drift Window Notes: EAt is firm’s earnings announcement date. FDt is firm’s 10-Q filing date. The 10-Q filing window begins from trading day -1 and ends on trading day +1 with regard to FDt. The post-filing drift window begins from trading day +2 with regard to FDt and ends on trading day +60 with regard to EAt. SARF and SARDF are equally weighted cumulative abnormal returns over the 10-Q filing window and the post-filing drift window, respectively.. 27.
(36) Specifically, this research uses Equation (1) and Equation (2) to test my hypotheses.. Equation (1) and Equation (2) are estimated by using ordinary least. squares (OLS) model after controlled for industry fixed effect and the firm-year clustered standard error as in Petersen (2009).. SARF. = β0 + β1SURPRISE + β2VAC + β3POST + β4VAC_POST + β5SURPRISE × VAC + β6SURPRISE × POST + β7SURPRISE ×. 政 治 大 VAC_POST + β SURPRISE × SIZE + β SURPRISE × NUMBER + 立 8. 9. ‧ 國. β12SURPRISE × DVOLUME. +. 學. β10SURPRISE × SGROWTH + β11SURPRISE × LEVERAGE + β13SIZE. +. β14NUMBER. +. ‧. β15SGROWTH + β16LEVERAGE + β17DVOLUME + β18Industry + ε. er. io. sit. y. Nat. al. iv n C × VAC β SURPRISE h i U × POST e n g+ cβhSURPRISE. = β0 + β1SURPRISE + β2VAC + β3POST + β4VAC_POST +. n. SARDF. (1). 5. 6. + β7SURPRISE ×. VAC_POST + β8SURPRISE × SIZE + β9SURPRISE × NUMBER + β10SURPRISE × SGROWTH + β11SURPRISE × LEVERAGE + β12SURPRISE × DVOLUME. +. β13SIZE. +. β14NUMBER. +. β15SGROWTH + β16LEVERAGE + β17DVOLUME + β18Industry + ε (2). 28.
(37) where, Dependent Variables: SARF = equally weighted cumulative abnormal returns over the 10-Q filing window. SARFD = equally weighted cumulative abnormal returns over the 10-Q post-filing window. Independent Variables:. 政 治 大. SURPRISE = earnings surprise, calculated by earnings per share minus the most. 立. recent analyst forecast consensus for the quarter divided by the stock price at the. ‧ 國. 學. end of the quarter.. ‧. VAC = a dummy variable, which equals one if the firm has VACs, 0 otherwise.. y. Nat. sit. POST = a dummy variable, which equals 1 if a firm-quarter observation is after the. er. io. VACs, 0 otherwise.. al. n. iv n C SIZE = the market capitalization h e nofga cfirmhati theUend of the quarter. NUMBER = number of analysts following a firm at the end of the quarter. SGROWTH = sales growth of firms at the end of the quarter. LEVERAGE = leverage ratio of a firm at the end of the quarter, which equals total liabilities divided by total assets. DVOLUME = dollar trading volume, which is scaled by the firm’s market value at the end of the quarters. 29.
(38) 3.4.1 Return/Earnings-related variables Dependent variables, SARF and SARDF are equally weighted cumulative abnormal returns over the 10-Q filing window (FDt-1~FDt+1) and the post-filing drift window (FDt+2~EAt+60) respectively. Cumulative abnormal returns are estimated using the market model with an estimated period of 255 days starting from 46 days before the filing date by using OLS regression models.. SURPRISE is earnings. surprise, calculated by earnings per share minus the most recent analyst forecast. 政 治 大. consensus for the quarter divided by the stock price at the end of the quarter. The. 立. decile ranking of SAR and SURPRISE are provided for Equation (1) and (2).. ‧ 國. 學. 3.4.2 VACs-related variables. ‧. VAC is a dummy variable, which equals 1 if the firm has VACs, 0 otherwise.. Nat. sit. y. POST is a dummy variable indicating whether a firm-quarter observation is after. n. al. er. io. VACs, which equals 1 if a firm-quarter observation is after the VAC, 0 otherwise.. v ni. VAC_POST is the interaction term of VAC and POST.. Ch. engchi U. SURPRISE× VAC is an. interaction term, which means the impact of VACs to market reaction compared to non-VAC firms, without considering whether the firm-quarter observation is after VACs.. SURPRISE×POST is an interaction term, which means the market reaction. after VACs, compared to that before VACs.. In order to examine my hypotheses, the. study mainly focuses on SURPRISE×VAC_POST, the interaction term of SURPRISE and VAC_POST, is used to examine the relation between VACs and post-earnings announcement drift at the period after VACs compared to the period before VACs. Hypothesis 1 predicts that VAC is negatively associated with the relation between 30.
(39) earnings surprises and market reactions on filing date and positively associated with the post-filing announcement drift. Hence, the study expects the coefficients on SURPRISE×VAC_POST to be negative in Equation (1) (10-Q filing window) and positive in Equation (2) (post-filing drift window).. 3.4.3 Control variables This study controls for several variables.. First, this research controls for the. 政 治 大. size of the firm (SIZE). SIZE is the logarithm of the market capitalization of a firm. 立. at the end of the quarter. It has been shown to affect the relationship between. ‧ 國. 學. earnings and return of a firm (Bhushan 1994; Lakonishok et al. 1994; Hayn 1995; Lee 2012), while some studies find that firm size may not have a impact on NUMBER is the number of analyst. y. Nat. Lee (2012) uses it as a proxy for the. sit. following a firm at the end of the quarter.. ‧. earnings-return relation (Bartov et al. 2000).. n. al. er. io. richness of the firm’s information environment, and suggests that firms with more. i n U. v. sophisticated information users might facilitate the efficiency of stock price.. Ch. engchi. SGROWTH is sales growth of firms at the end of the quarter. Sales growth is the firms-related factor that may influence market reaction (Lakonishok et al. 1994). LEVERAGE is leverage ratio of a firm at the end of the quarter, which equals to total liabilities divided by total assets.. Price et al. (2012) use leverage to control for. increased information demand when firms are in financial distress.. DVOLUME is. dollar trading volume, which is scaled by the firm’s market value at the end of the quarters.. DVOLUME is a proxy for transaction costs, which may result in under. reaction to earnings information and slow down the convergence of the stock price to 31.
(40) the fundamental value. It has been shown to have a positive relation with post-earnings announcement drift (Bernard. and Thomas 1990; Bhushan 1994; Ng et al. 2008).. The study also includes all the interactions terms between SURPRISE. and all other variables.. 3.4.4 Data source VAC and POST are identified from VAC firms with the letters issued by audit. 政 治 大. firms about accounting principles changes from 1994 to 2008 in SEC’s website. This. 立. study obtains SAR and DVOLUME from CRSP, while SURPRISE and NUMBER are. ‧ 國. 學. from IBES. Moreover, SIZE, SGROWTH and LEVERAGE come from Compustat. See Appendix for variable definitions.. ‧. n. er. io. sit. y. Nat. al. Ch. engchi. 32. i n U. v.
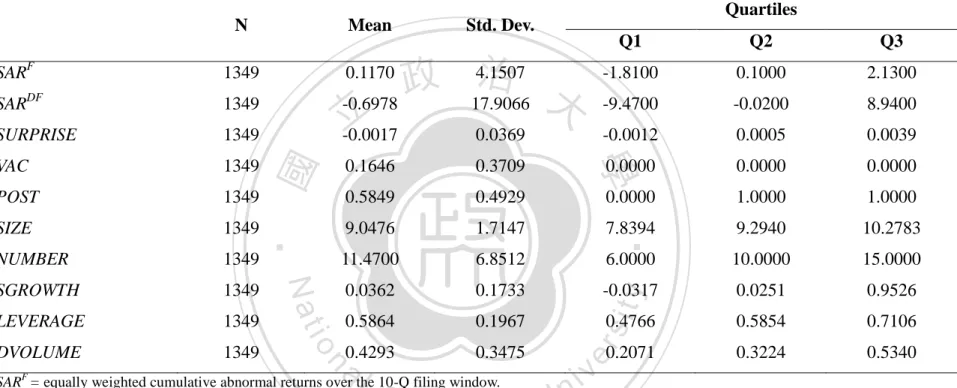
(41) 4. RESEARCH RESULTS AND ANALYSIS 4.1 Descriptive Statistics The descriptive statistics of the variables in Equation (1) and Equation (2) are shown in Table 2. To mitigate undue effect of outliers, this research winsorizes all variables at the 1% and 99% levels.. 治 政 equally weighted cumulative abnormal returns (SAR大 ) are about 0.12% during three-day 立 10-Q filling window. Equally weighted cumulative abnormal returns (SAR ) are about Table 2 Panel A shows descriptive statistics for all sample data. On average, F. DF. ‧ 國. 學. -0.70% during post-filing drift window. Earnings surprise (SURPRISE) for the event Furthermore, there are about 16% of VAC firms in the. ‧. quarter is -0.0017 on average.. sample (VAC), and about 58% of the firm-quarter observation is after VACs (POST).. y. Nat. er. io. sit. There are approximately 11 analysts follow a firm (NUMBER). The mean (median) size of firms (SIZE) is about 9.05 (9.29), while average (median) sales growth at the end. n. al. Ch. i n U. v. of the event quarter (SGROWTH) is about 4% (3%). In addition, the mean and median of. engchi. leverage ratio (LEVERAGE) are both around 59%, and the mean (median) of dollar trading volume (DVOLUME) is 0.43 (0.32).. My initial sample begins with 9,548. firm-quarters of VAC and non-VAC firms. After eliminating missing data such as firm-quarters without COMPUSTAT gvkeys, CRSP permnos, without necessary data to compute the abnormal returns or without necessary control variables, my final sample consists of 1349 firm-quarters.. 33.
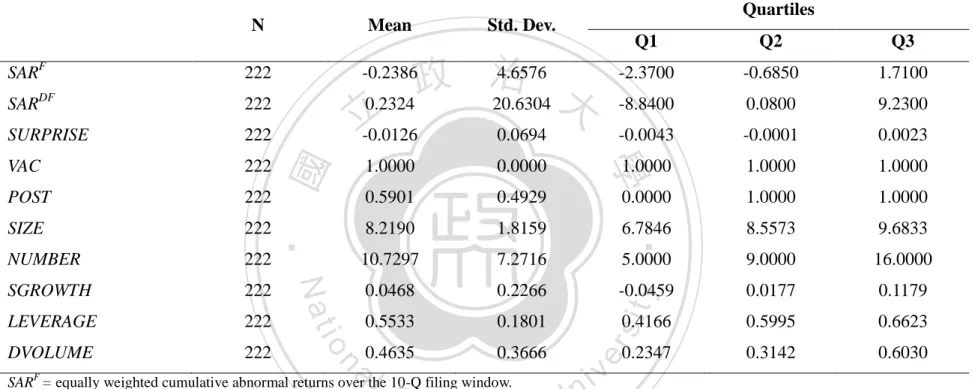
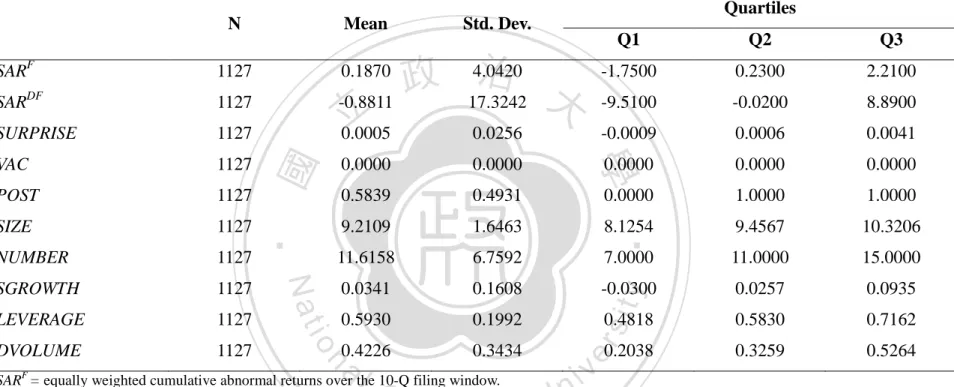
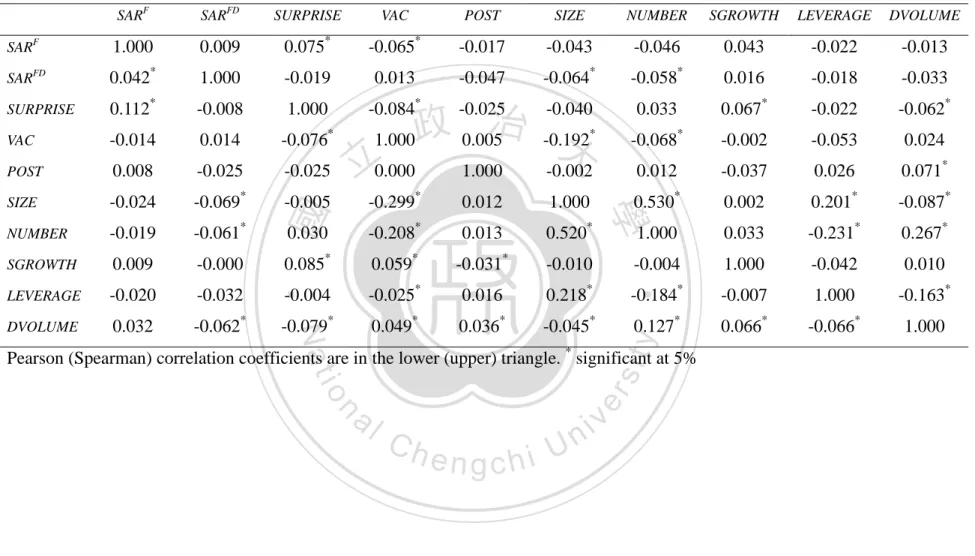
(42) Table 2 Panel B and Panel C are the descriptive statistics for VAC and non-VAC firms, respectively. Among my final data, there are 222 firm-quarters of VAC firms and 1127 firm-quarters of non-VAC firms.. The mean abnormal returns of VAC firms. in 10-Q filing window and post-filing drift window are separately -0.24% and 0.23%, and earnings surprise (SURPRISE) is approximately -0.01. On the other hand, the mean abnormal returns of non-VAC firms in 10-Q filing window and post-filing drift window are 0.19% and -0.88%, individually, and earnings surprise (SURPRISE) is 0.0005 on average.. 政 治 大. In addition, firms size (SIZE) and number of analysts following (NUMBER). 立. of VAC firms are slightly less than non-VAC firms. Sales growth (SGROWTH) of VAC. ‧ 國. LEVERAGE and DVOLUME are not. 學. firms is larger than non-VAC firms on average.. significantly different between VAC firms and non-VAC firms.. ‧. The correlations of the variables are given in Table 3.. Nat. y. This study finds no high. n. al. er. io. sit. correlation that may cause issues when performing the analyses.. Ch. engchi. 34. i n U. v.
(43) Table 2. Descriptive Statistics Panel A. Full Sample N. POST. 1349. SIZE. 1349. NUMBER. 1349. SGROWTH. 1349. LEVERAGE. 1349. DVOLUME. 1349. 0.1000. 2.1300. -9.4700. -0.0200. 8.9400. -0.0012. 0.0005. 0.0039. 0.0000. 0.0000. 0.0000. 0.0000. 1.0000. 1.0000. 0.1646. 0.3709. 0.5849. 0.4929. 9.0476. 1.7147. 7.8394. 9.2940. 10.2783. 11.4700. 6.8512. 6.0000. 10.0000. 15.0000. 0.0362. 0.1733. y. 1349. -1.8100. -0.0317. 0.0251. 0.9526. 0.5864. 0.1967. sit. VAC. Q3. 0.5854. 0.7106. 0.4293. 0.3475. 0.3224. 0.5340. 0.4766. er. 1349. ‧ 國. SURPRISE. Q2. ‧. 1349. 治 政 4.1507 -0.6978 17.9066 大 立 -0.0017 0.0369. Q1. 學. SARDF. Quartiles. Std. Dev.. 0.1170. io. 1349. Nat. SARF. Mean. 0.2071. n. a l 10-Q filing window. v i SAR = equally weighted cumulative abnormal returns over the n SAR = equally weighted cumulative abnormal returns over theC 10-Q post-filing window. U h thenmost SURPRISE = earnings surprise, calculated by earnings per share minuse h ianalyst forecast consensus for the quarter divided by the stock price at g crecent F. FD. the end of the quarter. VAC = a dummy variable, which equals one if the firm has VACs, 0 otherwise. POST = a dummy variable, which equals 1 if a firm-quarter observation is after the VAC, 0 otherwise. SIZE = size of a firm, which is the market capitalization of a firm at the end of the quarter. NUMBER = number of analysts following a firm at the end of the quarter. SGROWTH = sales growth of firms at the end of the quarter. LEVERAGE = leverage ratio of a firm at the end of the quarter, which equals total liabilities divided by total assets. DVOLUME = dollar trading volume, which is scaled by the firm’s market value at the end of the quarters. 35.
(44) Table 2. Descriptive Statistics Panel B. VAC Firms N. POST. 222. SIZE. 222. NUMBER. 222. SGROWTH. 222. LEVERAGE. 222. DVOLUME. 222. -0.6850. 1.7100. -8.8400. 0.0800. 9.2300. -0.0043. -0.0001. 0.0023. 1.0000. 1.0000. 1.0000. 0.0000. 1.0000. 1.0000. 1.0000. 0.0000. 0.5901. 0.4929. 8.2190. 1.8159. 6.7846. 8.5573. 9.6833. 10.7297. 7.2716. 5.0000. 9.0000. 16.0000. 0.0468. 0.2266. y. 222. -2.3700. -0.0459. 0.0177. 0.1179. 0.5533. 0.1801. sit. VAC. Q3. 0.5995. 0.6623. 0.4635. 0.3666. 0.3142. 0.6030. 0.4166. er. 222. ‧ 國. SURPRISE. Q2. ‧. 222. 4.6576 政 治 0.2324 20.6304 大 立 -0.0126 0.0694. Q1. 學. SARDF. Quartiles. Std. Dev.. -0.2386. io. 222. Nat. SARF. Mean. 0.2347. n. a l 10-Q filing window. v i SAR = equally weighted cumulative abnormal returns over the n SAR = equally weighted cumulative abnormal returns over theC 10-Q post-filing window. U h thenmost SURPRISE = earnings surprise, calculated by earnings per share minuse h ianalyst forecast consensus for the quarter divided by the stock price at g crecent F. FD. the end of the quarter. VAC = a dummy variable, which equals one if the firm has VACs, 0 otherwise. POST = a dummy variable, which equals 1 if a firm-quarter observation is after the VAC, 0 otherwise. SIZE = size of a firm, which is the market capitalization of a firm at the end of the quarter. NUMBER = number of analysts following a firm at the end of the quarter. SGROWTH = sales growth of firms at the end of the quarter. LEVERAGE = leverage ratio of a firm at the end of the quarter, which equals total liabilities divided by total assets. DVOLUME = dollar trading volume, which is scaled by the firm’s market value at the end of the quarters. 36.
(45) Table 2. Descriptive Statistics Panel C. Non-VAC Firms N. POST. 1127. SIZE. 1127. NUMBER. 1127. SGROWTH. 1127. LEVERAGE. 1127. DVOLUME. 1127. 0.2300. 2.2100. -9.5100. -0.0200. 8.8900. -0.0009. 0.0006. 0.0041. 0.0000. 0.0000. 0.0000. 0.0000. 1.0000. 1.0000. 0.0000. 0.0000. 0.5839. 0.4931. 9.2109. 1.6463. 8.1254. 9.4567. 10.3206. 11.6158. 6.7592. 7.0000. 11.0000. 15.0000. 0.0341. 0.1608. y. 1127. -1.7500. -0.0300. 0.0257. 0.0935. 0.5930. 0.1992. sit. VAC. Q3. 0.5830. 0.7162. 0.4226. 0.3434. 0.3259. 0.5264. 0.4818. er. 1127. ‧ 國. SURPRISE. Q2. ‧. 1127. 治 政 4.0420 -0.8811 17.3242 大 立 0.0005 0.0256. Q1. 學. SARDF. Quartiles. Std. Dev.. 0.1870. io. 1127. Nat. SARF. Mean. 0.2038. n. a l 10-Q filing window. v i SAR = equally weighted cumulative abnormal returns over the n SAR = equally weighted cumulative abnormal returns over theC 10-Q post-filing window. U h thenmost SURPRISE = earnings surprise, calculated by earnings per share minuse h ianalyst forecast consensus for the quarter divided by the stock price at g crecent F. FD. the end of the quarter. VAC = a dummy variable, which equals one if the firm has VACs, 0 otherwise. POST = a dummy variable, which equals 1 if a firm-quarter observation is after the VAC, 0 otherwise. SIZE = size of a firm, which is the market capitalization of a firm at the end of the quarter. NUMBER = number of analysts following a firm at the end of the quarter. SGROWTH = sales growth of firms at the end of the quarter. LEVERAGE = leverage ratio of a firm at the end of the quarter, which equals total liabilities divided by total assets. DVOLUME = dollar trading volume, which is scaled by the firm’s market value at the end of the quarters. 37.
(46) Table 3. Pearson/Spearman Correlation SARF. SARFD. SURPRISE. VAC. POST. SIZE. NUMBER. SGROWTH. LEVERAGE. DVOLUME. SARF. 1.000. 0.009. 0.075*. -0.065*. -0.017. -0.043. -0.046. 0.043. -0.022. -0.013. SARFD. 0.042*. 1.000. -0.019. 0.013. -0.047. -0.064*. -0.058*. 0.016. -0.018. -0.033. SURPRISE. 0.112*. -0.008. 1.000. -0.084*. 0.033. 0.067*. -0.022. -0.062*. VAC. -0.014. 0.014. -0.076*. 1.000. -0.068*. -0.002. -0.053. 0.024. POST. 0.008. -0.025. -0.025. SIZE. -0.024. -0.069*. -0.005. NUMBER. -0.019. -0.061*. SGROWTH. 0.009. -0.000. LEVERAGE. -0.020. -0.032. DVOLUME. 0.032. -0.062*. 政 0.005治 -0.192 大. 立0.000. -0.025. -0.040 *. 0.012. -0.037. 0.026. 0.071*. -0.299*. 0.012. 1.000. 0.530*. 0.002. 0.201*. -0.087*. 0.030. -0.208*. 0.013. 0.520*. 1.000. 0.033. -0.231*. 0.267*. 0.085*. 0.059*. -0.031*. -0.010. -0.004. 1.000. -0.042. 0.010. -0.004. -0.025*. 0.016. 0.218*. -0.184*. -0.007. 1.000. -0.163*. -0.079*. 0.049*. 0.036*. -0.045*. 0.127*. 0.066*. -0.066*. 1.000. Nat. y. ‧. ‧ 國. -0.002. 學. 1.000. n. al. er. io. sit. Pearson (Spearman) correlation coefficients are in the lower (upper) triangle. * significant at 5%. Ch. engchi. 38. i n U. v.
(47) 4.2 Empirical Results 4.2.1 Results for VACs and Post-earnings announcement drift (Full Sample) The results are shown in Table 4, which presents the results for Equation (1) and Equation (2) through Model (1) and Model (2), respectively. Model (1) shows the market reaction around 10-Q filing window (FDt-1~FDt+1) and Model (2) shows those around post-filing drift window (FDt+2~EAt+60). The column of Full sample is about the results of all sample data.. Table 4 shows the associations between the. 政 治 大. control variables and market reaction in Model (1) and Model (2). The insignificant. 立. coefficient of SURPRISE× LEVERAGE shows that leverage ratio of firms do not. ‧ 國. 學. have a relation with market reaction drift after earnings announcement. The significant coefficients of SURPRISE× SGROWTH shows that firms with higher. ‧. 4. display. insignificant. coefficient. of. SURPRISE× VAC. and. sit. Table. Nat. in. y. sales growth followed by less stock price drift in the filing window. The main results. n. al. er. io. SURPRISE× POST, which means VAC and POST are not related to the association. i n U. v. between earnings surprises and market reactions separately. However, when taking. Ch. engchi. both VAC and POST into consideration, there is significant coefficient of SURPRISE× VAC_POST in 10-Q filing window (0.285, p<0.1), and insignificant coefficient in post-filing drift window, which is inconsistent with hypothesis 1 : VAC is negatively associated with the relation between earnings surprises and market reactions on filing date and positively associated with the post-filing announcement drift. That is, VAC firms adopting VACs only evoke the drift of market price in the filing window after VACs, compared to the non-VAC firms. However, the results haven’t involved the effect of accounting choice heterogeneity. 39.
(48) Table 4. Results for VACs and Post-earnings announcement drift (Full Sample) Model Event Window Dependent variable Intercept SURPRISE VAC. SURPRISE× SIZE. Nat. SURPRISE× NUMBER. io. SURPRISE× SGROWTH. al. n SURPRISE× LEVERAGE SURPRISE× DVOLUME SIZE NUMBER SGROWTH LEVERAGE DVOLUME Industry Effect N Adj. R2. Ch. engchi. *. y. SURPRISE× VAC_POST. ‧. ‧ 國. SURPRISE× POST. 學. SURPRISE× VAC. sit. 立. VAC_POST. 政 治 大. er. POST. (1) 10-Q Filing SARF Full Sample 6.972*** (5.32) -0.050 (-0.24) -0.307 (-0.41) 0.117 (0.29) -1.519 (-1.59) -0.044 (-0.34) -0.032 (-0.50) 0.285* (1.71) 0.018 (0.66) -0.004 (-0.60) -0.372** (-2.02) -0.033 (-0.16) 0.047 (0.50) -0.154 (-0.96) 0.012 (0.31) 2.787** (2.47) -0.028 (-0.02) -0.424 (-0.73) Included 1349 0.02. i n U. v. (2) Post-Filing Drift SARDF Full Sample 7.386*** (5.70) -0.017 (-0.08) -0.098 (-0.13) -0.240 (-0.59) 0.132 (0.13) -0.027 (-0.22) -0.014 (-0.21) 0.039 (0.24) -0.005 (-0.19) -0.003 (-0.48) 0.045 (0.24) 0.025 (0.14) 0.105 (1.30) -0.063 (-0.40) -0.007 (-0.18) -0.128 (-0.10) -0.604 (-0.55) -0.977* (-1.87) Included 1349 0.02. significant at 10%, ** significant at 5%, ***significant at 1%, t statistics are in parentheses and are estimated with clustered standard errors as in Petersen (2009). See Appendix for variable definitions. 40.
(49) 4.2.2 Results for VACs and Post-earnings announcement drift (Accounting Choices Heterogeneity) This study further considers the heterogeneity of accounting choices and categorizes the results into two groups in Table 5. The column of Similar consists of VAC firms adopting similar accounting method as their industry peers (non-VAC firms) after VACs, and the column of Different includes VAC firms adopting different accounting method from their industry peers after VACs. Besides, the. 政 治 大. column of Full sample is provided for comparison.. 立. ‧ 國. 學. Considering the results of Similar column in Table 5, the control variables present some connections with the market reactions. For instance, as mentioned. ‧. earlier, the negative significant coefficients of SURPRISE× SGROWTH shows that. Nat. sit. y. sales growth of firms has a reverse effect on stock price drift in the filing window.. n. al. er. io. The significant coefficients of SURPRISE× SIZE in the column of Similar in the. i n U. v. filing window and insignificant in post-filing drift window, indicate that the earnings. Ch. engchi. surprise of larger firms is followed by more stock price drift in the filing window when VAC firms have similar accounting method as non-VAC firms after VACs. The significantly coefficient of SURPRISE× VAC (-0.442, p < 0.01) only showing in Model (1) indicates that there is a negative stock return drift in the filing window of VAC firms with similar accounting choices as their industry peers, compared to non-VAC firms.. The significantly coefficient of SURPRISE× POST (-0.273, p <. 0.01) in Model (1) shows that in the case of VAC firms adopting similar accounting choices as non-VAC firms, this research finds significant market price drift after 41.
(50) VACs in the filing window, compared to that before VACs. However, SURPRISE× VAC and SURPRISE× POST do not consider whether the firm-quarter observation is after VACs or whether the firm has VACs, respectively. The coefficient of SURPRISE× VAC_POST in the column of Similar is significantly positive in the filing window and significantly negative in the post-filing drift window (0.727 and -0.402, p < 0.01 and p < 0.1), showing that when VAC firms adopting similar accounting choices as their industry peers, the association between. 政 治 大. earnings surprises and market reactions is larger around the filing date but smaller in the. post-filing. 立window.. Moreover,. through. the. coefficient. of. ‧ 國. 學. SURPRISE× VAC_POST in the column of Similar compared to that of Full sample, it seems that the impact of VACs to the filing drift and post-filing drift are much. ‧. clearer when considering the heterogeneity of accounting choices.. sit. y. Nat. n. al. er. io. Last, focusing on the VACs that are different from their industry’s peers’, the. i n U. v. coefficient of SURPRISE× VAC_POST is insignificant in Model (1) (0.081, n.s.) and. Ch. engchi. positively significant in Model (2) (0.393, p < 0.1). Different from the column of Full Sample and Similar, the results in Different column indicate that when VAC firms adopt different accounting method from their industry’s peers after VACs, VACs have a positively impact on the association between earnings surprise and market reactions in the post-filing window. Therefore, only when considering the heterogeneity of accounting choices, this study observes that VACs lead to more post-filing drift.. 42.
(51) In summary, the results in full sample indicate that VACs influence the earning information cognizance of external users, which leads to more market reaction in 10-Q filing window. However, it seems that the impact of VACs to post-filing drift doesn’t appear.. Furthermore, after considering the heterogeneity of accounting choices, the empirical results indicate that VAC firms adopting similar accounting choices as. 政 治 大. non-VAC firms after VACs makes external users easier to incorporate earnings. 立. information and reduce their information processing costs, which leads to less delayed. ‧ 國. 學. price response after earnings announcement, thus, more of earnings-related stock price reaction occurs in the 10-Q filing window and less of earnings-related market reaction. ‧. appears in the post-filing drift window.. sit. y. Nat. n. al. er. io. Compared to the data of Similar column, when VAC firms adopting different. i n U. v. accounting choices from non-VAC firms after VACs, external users get harder to. Ch. engchi. absorb related earnings information, which results in more delayed price response after earnings announcement. That means earnings-related market reaction defer until post-filing drift window. Therefore, the association between VACs and market reactions is larger in the post-filing window when considering accounting choices heterogeneity.. 43.
(52) Table 5. Results for VACs and Post-earnings announcement drift (Accounting Choices Heterogeneity) Model Event Window Dependent variable. (1) (2) 10-Q Filing Post-Filing Drift SARF SARDF Full Sample Similar Different Full Sample Similar Different 6.972*** 9.920*** 7.312*** 7.386*** 5.381** 6.642*** Intercept (5.32) (3.94) (3.82) (5.70) (2.09) (4.08) -0.050 -0.610 -0.181 -0.017 0.386 0.045 SURPRISE (-0.24) (-1.65) (-0.54) (-0.08) (0.98) (0.17) -0.307 1.343 -1.653 -0.098 -0.465 0.570 VAC (-0.41) (1.30) (-1.59) (-0.13) (-0.35) (0.56) 0.117 1.332* -0.655 -0.240 -0.442 0.404 POST (0.29) (1.92) (-1.04) (-0.59) (-0.64) (0.71) -1.519 -3.511** -0.504 0.132 2.677 -1.716 VAC_POST (-1.59) (-2.40) (-0.36) (0.13) (1.61) (-1.23) -0.044 -0.442*** 0.245 -0.027 0.085 -0.176 SURPRISE× VAC (-0.34) (-2.66) (1.35) (-0.22) (0.46) (-1.14) -0.032 -0.273*** 0.087 -0.014 0.070 -0.146 SURPRISE× POST (-0.50) (-2.72) (0.84) (-0.21) (0.67) (-1.62) 0.285* 0.727*** 0.081 0.039 -0.402* 0.393* SURPRISE× VAC_POST (1.71) (3.22) (0.36) (0.24) (-1.72) (1.79) 0.018 0.122** 0.021 -0.005 -0.032 -0.011 SURPRISE× SIZE (0.66) (2.51) (0.52) (-0.19) (-0.65) (-0.30) -0.004 -0.015 -0.008 -0.003 -0.014 0.008 SURPRISE× NUMBER (-0.60) (-1.52) (-0.80) (-0.48) (-1.20) (0.90) -0.372** -1.367*** -0.159 0.045 -0.516 0.073 SURPRISE× SGROWTH (-2.02) (-3.60) (-0.62) (0.24) (-1.03) (0.38) -0.033 -0.257 0.023 0.025 -0.040 -0.075 SURPRISE× LEVERAGE (-0.16) (-0.90) (0.08) (0.14) (-0.13) (-0.27) 0.047 0.078 0.075 0.105 0.124 0.150 SURPRISE× DVOLUME (0.50) (0.86) (0.58) (1.30) (1.19) (1.36) -0.154 -0.742*** -0.130 -0.063 0.106 -0.053 SIZE (-0.96) (-2.50) (-0.57) (-0.40) (0.34) (-0.26) 0.012 0.097 -0.001 -0.007 0.055 -0.066 NUMBER (0.31) (1.45) (-0.02) (-0.18) (0.74) (-1.30) 2.787** 10.025*** 0.798 -0.128 3.600 0.204 SGROWTH (2.47) (3.47) (0.61) (-0.10) (0.98) (0.15) -0.028 1.771 -0.263 -0.604 -0.965 0.813 LEVERAGE (-0.02) (0.98) (-0.15) (-0.55) (-0.49) (0.51) -0.424 -1.204* 0.193 -0.977* -0.853 -1.080* DVOLUME (-0.73) (-1.52) (0.23) (-1.87) (-1.18) (-1.66) Industry Effect Included Included Included Included Included Included N 1349 454 711 1349 454 711 Adj. R2 0.02 0.09 0.04 0.02 0.04 0.03 * significant at 10%, ** significant at 5%, ***significant at 1%, t statistics are in parentheses and are estimated with clustered standard errors as in Petersen (2009). See Appendix for variable definitions.. 立. 政 治 大. ‧. ‧ 國. 學. n. er. io. sit. y. Nat. al. Ch. engchi. 44. i n U. v.
數據

+7
相關文件
• Information on learners’ performance in the learning task is collected throughout the learning and teaching process so as to help teachers design post-task activities
The aim of this theme is to study the factors affecting industrial location using iron and steel industry and information technology industry as examples. Iron and steel industry
現時,STEM 教育已融入了在小學課程當中;不少學校在規劃及組織 STEM 相關學習活 動時,更融入藝術教育/人文精神的學習元素,以
智利政府在十月初宣布地鐵漲價,大批學生因此發起抗議遊行,最終演變為反政府 流血示威,並造成 15 人死亡。流血示威經過一週後,在 10 月
基於 TWSE 與 OTC 公司之特性,本研究推論前者相對於後者採取更穩定之股利政 策 (Leary and Michaely, 2011; Michaely and
甲、 秦朝的統一及其統治措施 乙、 漢武帝的統治政策與疆域拓展 丙、 昭宣以後的政治與社會的發展
“libact is a Python package designed to make active learning easier for real-world users”.. Realistic
政府於2018年施政報告宣布,由2019/20學 年起,增加給予學校家教會的經常撥款,讓 學校家教會舉辦更多校本家長教育課程或活
