國
立 交 通 大 學
應用化學系博士班
博士論文
高電容量錫基奈米結構作為鋰離子電池
之陽極
High Capacity Tin-Based Nanostructures as
Anodes for Lithium-Ion Batteries
研究生:許凱捷
指導教授:裘性天 教授
李紫原 教授
高電容量錫基奈米結構作為鋰離子電池
之陽極
High Capacity Tin-Based Nanostructures as
Anodes for Lithium-Ion Batteries
研 究 生:許凱捷 Student:Kai-Chieh Hsu
指導教授:裘性天 教授 Advisor:Prof. Hsin-Tien Chiu
李紫原 教授 Prof. Chi-Young Lee
國 立 交 通 大 學
應用化學系博士班
博士 論 文
A Thesis
Submitted to Ph. D Program, Department of Applied Chemistry College of Science
National Chiao Tung University in Partial Fulfillment of the Requirements
for the Degree of Doctor in
Applied Chemistry September 2014
Hsinchu, Taiwan, Republic of China
I
High Capacity Tin-Based Nanostructure as Anodes for Lithium-Ion
Batteries
Student: Kai-Chieh Hsu Advisor: Dr. Hsin-Tien Chiu
Dr. Chi-Young Lee
Abstract
In this studies, we demonstrate the synthesis of tin-based nanostructures include SnO2 nanorods (NRs), hollow spheres (HSs), nanosheets (NSs) and Sn@C core-shell nanowires (NWs) without the usage of template and catalysts. Growth mechanism and electrochemical properties of tin-based samples were also investigated.
First, phase-segregated SnO2 nanorods (NRs, length 1-2 m and diameter 10-20 nm) were developed in a matrix of CaCl2 salt by reacting CaO particles with a flowing mixture of SnCl4 and Ar gases at elevated temperatures via a vapor–solid reaction growth (VSRG) pathway. And developed a facile hydrothermal method to synthesize SnO2 hollow spheres (HSs) and nanosheets (NSs). The morphologies and structures of SnO2 could be controlled by Sn+4/+2 precursors. The shell thickness of the HSs was around 200 nm with diameter 1-3 μm, while thickness of the NSs was 40 nm. The correlation between the morphological characteristics and the electrochemical properties of SnO2 NRs, HSs and NSs were discussed. The SnO2 nanomaterials were investigated as a potential anode material for Li-ion batteries (LIBs). SnO2 NRs, HSs and NSs exhibit superior electrochemical performance and deliver 435, 522 and 490 mA h g−1 up to the one hundred cycles at a current density of 100 mA g-1 (0.13 C), which is ascribed to the unique structure of SnO2 which be surrounded in the inactive amorphous byproduct matrix. The matrix probably buffered and reduced the stress caused by the volume change of the electrode during the charge-discharge cyclings.
II
Development tin-based nanocomposites containing suitably chosen matrix elements to achieve higher performance and reduce irreversibility processes. Designed strategy to fabricate a novel tin-carbon nanocomposites as electrodes of LIBs. Sn@C core-shell nanowires (NWs) were synthesized by reacting SnO2 particles with a flowing mixture of C2H2 and Ar gases at elevated temperatures. The overall diameter of the core–shell nanostructure was 100-350 nm. The C shell thickness was 30-70 nm. The NW length was several micrometers. Inside the shell, a void space was found. The reaction is proposed to be via a vapor–solid reaction growth (VSRG) pathway. The NWs were investigated as a potential anode material for Li-ion batteries (LIBs). The half-cell constructed from the as-fabricated electrode and a Li foil exhibited a reversible capacity of 525 mA h g-1 after one hundred cycles at a current density of 100 mA g-1. At a current density as high as 1000 mA g-1, the battery still maintained a capacity of 486 mA h g-1. The excellent performance is attributed to the unique 1D core-shell morphology. The core-shell structure and the void space inside the shell can accommodate large volume changes caused by the formation and decomposition of LixSn alloys in the charge-discharge steps.
III
高電容量錫基奈米結構作為鋰離子電池之陽極
研究生:許凱捷
指導教授:裘性天 博士
李紫原 博士
摘要
此次研究中,我們提出在不使用模板與金屬催化劑的環境下,合
成出錫基奈米結構,其中包含奈米棒、空球狀、奈米片狀之二氧化錫
以及碳材包覆金屬錫之核殼一維奈米線作為陽極材料。此外,本研究
也對錫基奈米結構的成長機制以及電化學性質作了詳細的探討。
首先,藉由氣固相反應,以氧化鈣及四氯化錫作為前驅物,氬氣
作為載流氣體之環境,合成出具有相分離奈米棒之二氧化錫(短軸為
10-20 奈米長度;長軸為 1-2 微米長度)及氯化鈣鹽類。接著,藉由水
熱法以不同的+4/+2 價態錫之前驅物,合成出空球狀、奈米片狀之二
氧化錫,其中空球之殼厚大約為
200 奈米厚度,球狀大小為 1-3 微米
長度;片狀為
40 奈米厚度。根據實驗所觀察之結果,提出成長機制,
藉其嘗試了解成長過程。並且進一步討論,在電化學性質上與不同形
貌奈米棒、空球狀、奈米片狀之二氧化錫之間相關性。電池測試方面,
以二氧化錫奈米結構作為電極(充放電速率為 100 mA g
-1),奈米棒、
空球狀、奈米片狀之二氧化錫經過
100 次循環充放電分別有 435、522
IV
以及
490 mA h g
-1,其效能表現優異,主要原因為二氧化錫具有獨特
之奈米形貌以及被非活性物質圍繞著,故此在充放電過程中,以至於
能達到降低材料體積變化之壓力。
為了達到更佳效能以及減少不可逆現象,並以錫基為基礎的複合
材料,故此設計一新穎之錫碳複合奈米材料作為電極材料。我們提出
一簡單方式製備碳材包覆金屬錫之核殼一維奈米線材料。以二氧化錫
作為前驅物,通入乙炔氣體及氬氣作為載流氣體之環境成長;其中短
軸為
100-350 奈米長度;長軸為數十微米長度;碳層為 30-70 奈米厚
度,並發現管壁中具有中空區域。根據實驗所觀察之結果,提出一氣
固相反應的成長機制,藉其嘗試了解成長過程。電池測試方面,以碳
錫材料作為電極 (充放電速率為 100 mA g
-1),經過 100 次循環充放電
仍有
525 mA h g
-1;甚至在快速充放電狀況(1000 mA g
-1),依然保有
486 mA h g
-1。因本材料具有獨特之一維形貌與中空區域作為體積膨
脹之緩衝區域,故其效能之表現優異。
V
Acknowledgements
在這個實驗室六年了~終於可以寫篇謝誌!每年看著大夥一個一個離去真是 有點感傷,現在換我自己想到要離開這Chiulab 真的也有些不捨。 碩博期間能順利完成這段學業,首先要感謝的就是指導教授裘性天老師以及 李紫原老師,兩位老師總是能在學生困惑時,適時地推一把,讓學生找到方向, 不管是在學業或是生活上,都能給予適當建議與想法。在此還要感謝百忙之中抽 空參加口試的陳登銘教授、李積琛教授、陳金銘博士,對於論文內容給予寶貴的 建議,使得論文更加完整。 在 Chiulab 中,有個特色就是裘老師會跟大夥一起吃飯,這時裘老師就像是 位老朋友般跟大家一起聊天打哈哈,與大家分享生活趣事,解解大家實驗之餘的 苦悶,我想自己一定會懷念這一起吃飯的時刻。在Chiulab 這個大家庭中,每個 人互相扶持、互相幫忙,真的是謝謝各位的幫忙。感謝彭志偉學長、佳兒學姊、 煌凱、亭凱、蕭蕭、weiwei、大銘、劉文志、柏欽、Kimi、心安、yoyo、鯊魚哥、 亦諄、小童、鄒宗育、阿龍、明甥、千千、麥子、奕佑、彥伶、乃瑛、妤靜、鮑 魚、小臉、毓翔、凱歆、Sponge、顏詩芸、胡庭禎、楊晉嘉、麻立、李祖源、資 竣和在職班的程壹、朝和、貴虹以及其他學弟妹。另外LeeLab 的成員,雖然一 周只有咪挺才相會,但大家也都是一起奮鬥的好夥伴,感謝旻橋、薏仁、聰明哥、 弘麒、久萱、婷婷、逸群、閔涵、淵為、Shalini、曉萍、景翔、猴子、庭輝、建 甫、雅蓁、欣俞、緯祥、郁書、尹捷、貴麟、玠城、甘軒、世明和其他學弟妹。 最後要感謝我的家人,爸媽、兩位哥哥、大嫂,還有 Gigi。謝謝你們願意 當作我的靠山,讓我能無憂無慮地完成這學業,願意等待我這讀書的時間,謝 謝你們!感謝在這段日子上所有曾經幫助與指點過我的人。VI
Content
Abstract ... I 摘要... III Acknowledgements………... VI Content ... VII Content of Tables and Schemes ... IX List of Figures ... XChapter 1 Introduction ... 1
1.1 Introduction ... 1
1.2 Battery systems ... 1
1.3 Lithium-ion batteries (LIBs) ... 3
1.4 Electrode materials ... 5
1.5 Approaches for improving anode performance... 7
1.6 Synthetic approaches to novel nanomaterials ... 8
1.7Aim of the thesis ... 9
1.8 References ... 10
Chapter 2 Vapor Solid Reaction Growth of SnO2 Nanorods as an Anode Material for Lithium-Ion Batteries ... 14
2.1 Introduction ... 14
2.2 Experimental ... 18
2.2.1 Growth of SnO2 nanorods ... 18
2.2.2 Materials characterizations ... 19
VII
2.3 Results and discussion ... 20
2.3.1 Characterization of SnO2 NRs ... 20
2.3.2 Proposed reaction pathway ... 25
2.3.3 Electrochemical properties of SnO2 NRs ... 28
2.4 Conclusions ... 38
2.5 References ... 39
Chapter 3 Template-Free Hydrothermal Syntheses of SnO2 Structures for Anodes in Lithium-Ion Batteries ... 42
3.1 Introduction ... 42
3.2 Experimental ... 43
3.2.1 Growth of SnO2 structures ... 43
3.2.2 Materials characterizations ... 43
3.2.3 Electrochemical tests ... 44
3.3 Results and discussion ... 45
3.3.1 Characterization of SnO2 HSs ... 45
3.3.2 Characterization of SnO2 NSs ... 47
3.3.3 Electrochemical properties of SnO2 ... 51
3.4 Conclusions ... 58
3.5 References ... 59
Chapter 4 One-Step Vapor–Solid Reaction Growth of Sn@C Core–Shell Nanowires as an Anode Material for Li-Ion Batteries ... 62
4.1 Introduction ... 62
4.2 Experimental ... 66
4.2.1 Growth of Sn@C core–shell NWs ... 66
4.2.2 Materials characterizations ... 66
VIII
4.3 Results and discussion ... 67
4.3.1 Characterization of Sn@C core–shell NWs... 68
4.3.2 Proposed reaction pathway ... 74
4.3.3 Electrochemical properties of Sn@C core–shell NWs ... 75
4.4 Conclusions ... 82 4.5 References ... 82 Chapter 5 Conclusions ... 87
IX
Content of Tables and Schemes
Table 1.1 List of common commercial battery systems ... 2
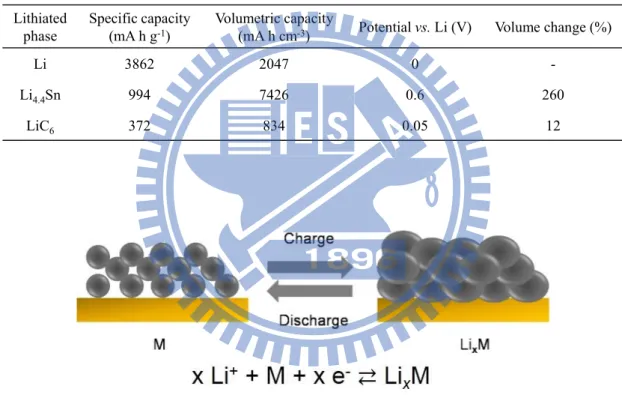
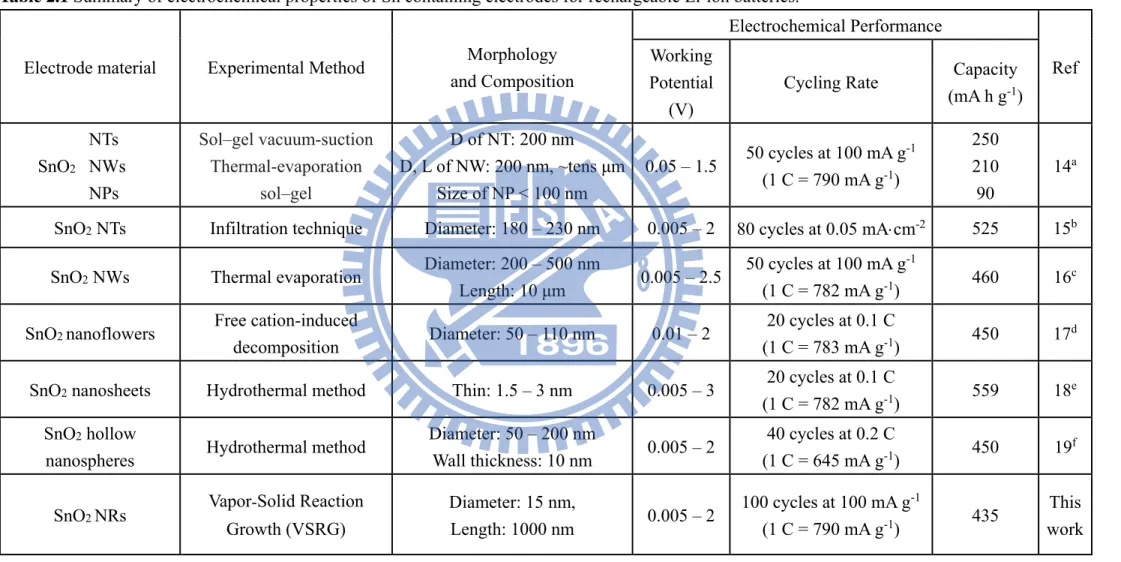
Table 1.2 Comparison of the theoretical specific capacity, charge density, volume change and onset potential of various anode materials. ... 7 Table 2.1 Summary of electrochemical properties of Sn containing electrodes for rechargeable Li-ion batteries. ... 16
Table 2.2 Experimental conditions for samples prepared by reacting SnCl4(g) and CaO(s).
... 19 Table 2.3 Fitted impedance parameters obtained from EIS using the circuit in Figure 2.13b... 38 Table 4.1 Summary of electrochemical properties of Sn containing electrodes for rechargeable Li-ion batteries. ... 64
Table 4.2 Summary of Sn@C NW samples ... 66
Scheme 2.1 Proposed VSRG pathway to form SnO2 NRs and schematic diagram
showing the role of the amorphous byproduct matrix during the lithiation and de-lithiation. ... 28
Scheme 4.1 Proposed VSRG pathway to form Sn@C core–shell NWs. ... 75
Scheme 5.1 Illustration of tin-based nanostructures as electrochemical test for LIBs. ... 88
X
List of Figures
Figure 1.1 Energy storage capability of common rechargeable battery systems. ... 3
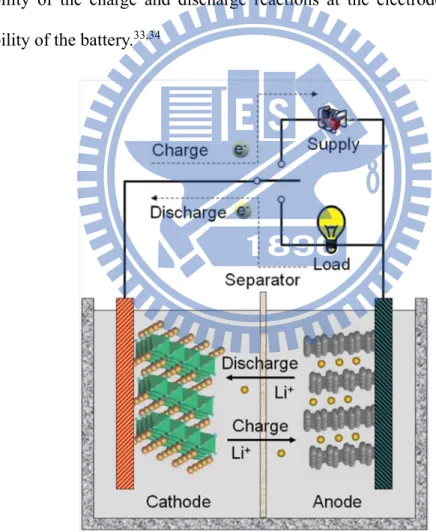
Figure 1.2 Components of a typical lithium-ion battery and the electrochemical processes in charging and discharging. ... 4
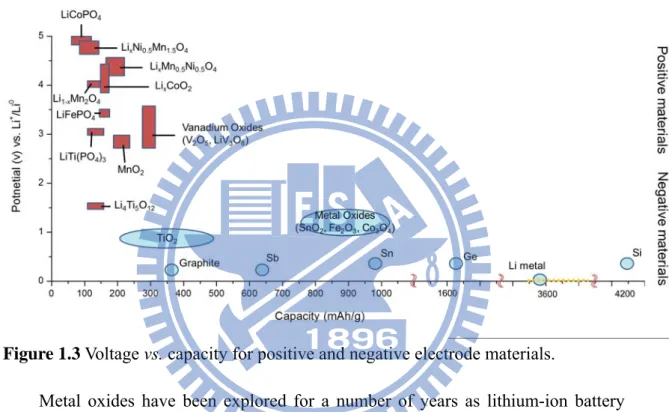
Figure 1.3 Voltage vs. capacity for positive and negative electrode materials. ... 5
Figure 1.4 Schematic the volume change of alloy materials during the cyclings. ... 7
Figure 2.1 Low and high magnifications SEM images of A. (a) Sample with both NRs and particles, (b) enlarged view of the squared area in (a), (c and d) views of NRs, and (e and f) views of particles. (g) EDX and (h) XRD pattern. ... 22 Figure 2.2 Low magnification SEM image in (a) shows the presence of a less observed morphology at the centre. (b) Enlarged view of the morphology. ... 23 Figure 2.3 TEM studies of A. (a) Image of a section of a NR, (b) SAED pattern, and (c) HRTEM image from the circled area in (a), (d) a bundle of NRs, (e) high magnification image, and (f) SAED pattern from the squared area in (d). ... 25 Figure 2.4 (a) Low and (b) high magnification SEM images and (c) EDX data from an area of sample B. (d) – (f) Corresponding data from another area of B. ... 26 Figure 2.5 XRD patterns of samples B and C. Standard XRD patterns and the corresponding JCPDS file numbers are shown also. ... 27 Figure 2.6 Low and high magnification SEM images of samples D and E. The EDX data are from the selected areas marked by red rectangles. Images and EDX of D are shown in (a) – (c). The data suggest that D is composed of SnO2. Images and EDX of E are shown in (d) – (h). There two types of solids. The NRs shown in (d) and (e) are SnO2, indicated by the EDX result in (f). According to the EDX in (h), the particles in (g) are CaSnO3. The assignments are consistent with the XRD results shown in Figure
XI
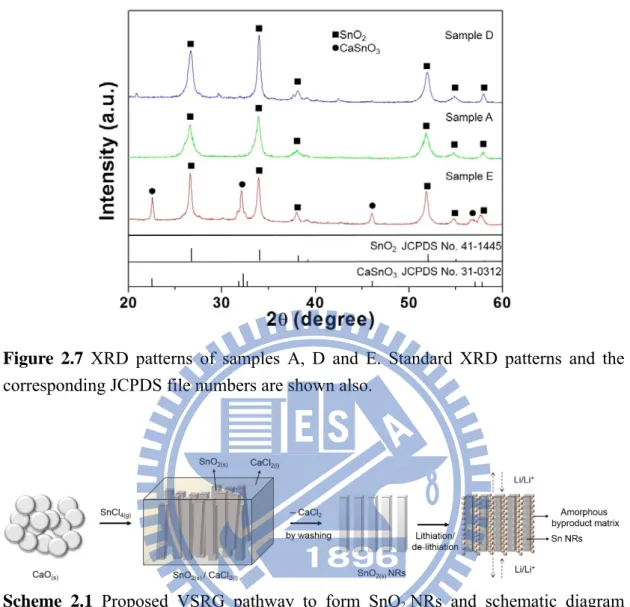
2.7... 27 Figure 2.7 XRD patterns of samples A, D and E. Standard XRD patterns and the corresponding JCPDS file numbers are shown also. ... 28
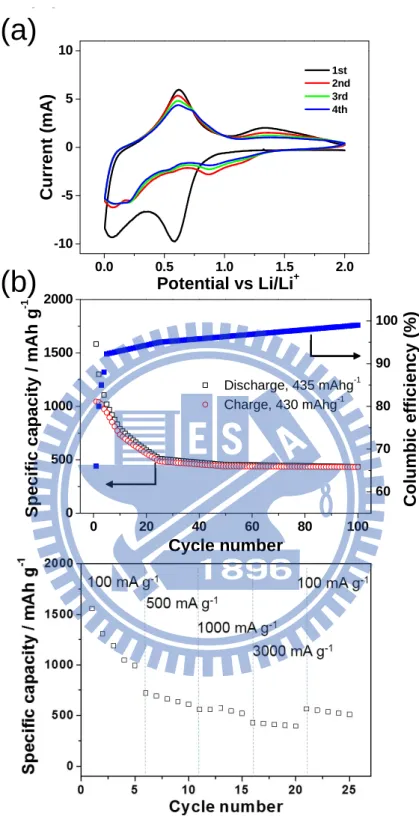
Figure 2.8 (a) CV of a SnO2 NR electrode scanned at 0.5 mV s−1. (b) Specific capacity
and columbic efficiency of a SnO2 NR electrode cycled at 100 mA g−1. (c) Discharge capacity of a SnO2 NR electrode as a function of discharge rate (100–3000 mA g−1). All experiments were cycled between 0.005 V and 2.0 V vs. Li/Li+. ... 31
Figure 2.9 (a) Discharge capacities of electrodes fabricated from commercial SnO2
powders (sizes: 1 - 10 m and 100 nm) at a cycling rate 100 mA g-1. (b) Electrochemical performance of a SnO2 NR electrode cycled between 0.005 V and 2.0 V vs. Li/Li+ after first ten cycles were cycled at 100 mA g-1. 100 mA g-1 (), 500 mA g-1 (), 1000 mA g-1 (), and 3000 mA g-1 (). ... 32
Figure 2.10 SEM images of (a) an electrode after one hundred cycles of lithiation and de-lithiation (without being washed) and (b) the original SnO2 NR electrode. The electrode was fabricated from a mixture of SnO2NRs, carbon black, and binder. ... 34
Figure 2.11 (a) EDX of a SnO2 NR electrode after 100 cycles of lithiation and
de-lithiation. The upper result was obtained from the whole-scan of the area shown in Figure 2.10a. The Cl content was low. The Pt signal was from the sputtered Pt metal, used to enhance the sample conductivity. The lower result was from the centre–point of one NR. (b) XRD patterns of sample A before and after 100 cycles of lithiation and de-lithiation. Related XRD patterns and the corresponding JCPDS file numbers are shown also. ... 35
Figure 2.12 SEM image of an electrode fabricated from a mixture of commercial SnO2
powder, carbon black, and binder after 50 cycles of lithiation and de-lithiation. ... 36 Figure 2.13 (a) Nyquist plots from coin cells composed of as-fabricated NR and commercial powder of SnO2. (b) Equivalent circuit for experimental data fitting. Re:
XII
electrolyte resistance; R(sf+ct): surface film and charge transfer resistance; Rf: polarization resistance; CPE: constant phase elements; W: Warburg impedance; C: intercalation capacitance. ... 37 Figure 3.1 (a-c) Low and high magnifications SEM images and (d) XRD pattern of the HSs. Standard XRD pattern and the corresponding JCPDS file number are shown also. ... 45 Figure 3.2 Results of TEM studies. (a) Image of a broken of HS. (b) SAED pattern and (c) HRTEM image from the squared area in (a). (d) EDX. ... 46 Figure 3.3 (a-c) Low and high magnifications SEM images and (d) XRD pattern of SnO2 NSs. Standard XRD patterns and the corresponding JCPDS file numbers are shown also. ... 48 Figure 3.4 Results of TEM studies. (a) Image of a section of a sheet. (b) SAED pattern and (c) HRTEM image from the squared area in (a). (d) EDX. ... 49
Figure 3.5 BET surface area profiles of (a) HSs and (b) NSs of SnO2. ... 50
Figure 3.6 Electrochemical studies of (a, c, e) HSs and (b, d, f) NSs of SnO2. (a, b) CVs
of SnO2 electrodes scanned at 0.5 mV s-1. (c, d) Specific capacity and columbic efficiency of SnO2 electrodes cycled at 100 mA g-1. (e, f) Discharge capacities of SnO2 electrodes at various discharge rates 100-3000 mA g-1. All experiments were cycled at 0.005-2.0 V vs. Li/Li+. ... 53
Figure 3.7 Electrochemical studies of (a) HSs and (b) NSs of SnO2. Electrochemical
performances of SnO2 electrodes cycled at 0.005-2.0 V vs. Li/Li+. The first ten cycles were cycled at 100 mA g-1. : 100 mA g-1, : 500 mA g-1, : 1000 mA g-1, and : 3000 mA g-1... 54
Figure 3.8 SEM images of (a) the original SnO2 HS electrode and (b, c) the electrode
after one hundred cycles of lithiation and de-lithiation (without being washed). (d) EDX of the SnO2 HS electrode after 100 cycles of lithiation and de-lithiation. The Pt signal
XIII
was from the sputtered Pt metal, used to enhance the sample conductivity. The electrode was fabricated from a mixture of SnO2, carbon black, and binder. ... 55
Figure 3.9 XRD patterns of the SnO2 HS electrode before and after 100 cycles of
lithiation and de-lithiation. Related XRD patterns and the corresponding JCPDS file numbers are shown also. ... 56
Figure 3.10 SEM images of (a) the original SnO2 NS electrode and (b, c) the electrode
after one hundred cycles of lithiation and de-lithiation (without being washed). (d) EDX of the SnO2 NS electrode after 100 cycles of lithiation and de-lithiation. The Pt signal was from the sputtered Pt metal, used to enhance the sample conductivity. The electrode was fabricated from a mixture of SnO2, carbon black, and binder. ... 56
Figure 3.11 XRD patterns of the SnO2 NS electrode before and after 100 cycles of
lithiation and de-lithiation. Related XRD patterns and the corresponding JCPDS file numbers are shown also. ... 57 Figure 3.12 Nyquist plots from coin cells composed of as-fabricated HSs and NSs of SnO2. ... 58
Figure 3.13 Equivalent circuit for experimental data fitting. Re: electrolyte resistance;
R(sf+ct): surface film and charge transfer resistance; Rf: polarization resistance; CPE: constant phase elements; W: Warburg impedance; C: intercalation capacitance. ... 58 Figure 4.1 SEM images. (a) Low and (b) high magnification views of product A. (c) Low and (d) high magnification views of product B. The core–shell structures can be observed in the regions marked in the insets. ... 69
Figure 4.2 SEM image and energy dispersive X-ray spectrum (EDX) of product A. 69
Figure 4.3 XRD patterns of products A and B. ... 70
Figure 4.4 Raman spectra of product A and SnO2. (Excitation wavelength: 785 nm,
power: 5 mW) ... 70 Figure 4.5 Thermogravimetric analysis (TGA) profile of A. The Sn and C contents are
XIV
estimated to be 46.8 wt % (8.1 at %) and 53.2 wt % (91.9 at %), respectively. The analysis was taken in O2 using a heating rate of 10 K min-1. ... 71
Figure 4.6 SEM images of samples prepared at (a) 873 K for 60 min, (b) 923 K for 30 min, (c) 973 K for 30 min, (d) 1073 K for 30 min, and (e) 1123 K for 30 min. C2H2 was flowing at 3 sccm under atmospheric pressure. ... 71 Figure 4.7 TEM studies of product A. (a) A completely filled core–shell NW, (b) a pair of partially filled NWs, (c) a section of a broken NW, (d) a high magnification image from the pointed region in (c), (e) SAED pattern from the rectangle area in (c) and (f) SAED pattern from the end of the core in (d). (g) HRTEM image from the region circled in (d). (h) EDX spectrum from (c). ... 73 Figure 4.8 TEM images of a Sn@C core–shell NW. (a) Low magnification image and (b) high magnification view of the area marked by the arrow in (a) images taken after irradiating the circled area in (b) by an electron beam for (c) 60 s and (d) 180 s. The void shown in the circled area in (b) was filled by melted Sn after the electron beam irradiation. ... 73 Figure 4.9 (a) Cyclic voltammograms of a Sn@C core–shell NW electrode (scan speed 0.5 mV s-1). Electrochemical performance of the electrode cycled between 0.005 V and 2.0 V vs. Li/Li+ (cycling rate 500 mA g-1); (b) voltage profiles of the electrode after 1, 2, 10, 25, 50, and 100 cycles and (c) capacity fading of the electrode. Coulombic efficiency and reversibility of each cycle of the electrode are presented in the secondary y-axis on the right of (c). The discharge capacity of an electrode fabricated from commercial Sn powder was cycled at 100 mA g-1. ... 78
Figure 4.10 Electrochemical performance of a Sn@C core–shell NW electrode cycled between 0.005 V and 2.0 V vs. Li/Li+. (a) Curves of specific capacity versus cycle number of the electrode at cycling rates of 100 mA g-1, 500 mA g-1, 1000 mA g-1 and 3000mA g-1. (b) Discharge capacities of the electrode as a function of discharge rates
XV
(100–3000 mA g-1). ... 79
Figure 4.11 SEM images of the electrode prepared from Sn@C core-shell NWs. (a) Low and (b) high magnification views. (c) Low and (d) high magnification views of the electrode after 100 cycles of lithiation and delithiation. The electrode was fabricated with a mixture of carbon black and binder. ... 80 Figure 4.12 SEM images of (a) the commercial Sn powder, (b) the electrode prepared from the powder, and (c) low and (d) high magnification views of the electrode after 50 cycles of lithiation and delithiation. The Sn particles shown in (b) and (c) were mixed with carbon black and binder used for the electrode fabrication. ... 81
1
Chapter 1 Introduction
1.1 Introduction
Energy consumption or production that rely on the combustion of fossil fuels is forecast to have a severe future impact on world economics and ecology. Electrochemical energy production is under serious consideration as an alternative energy and power source, as long as this energy consumption is designed to be more sustainable and more environmentally friendly.1,2 It is now almost universally recognized that gaseous emissions from the burning of fossil fuels and biomass are not only polluting the air of large, modern cities but are also creating a global warming with alarming consequences.3-6 The battery provides the portability of stored chemical energy with the ability to deliver this energy as electrical energy with a high conversion efficiency and no gaseous exhaust. Moreover, the alternative energy sources are preferably converted to D.C. electrical energy well-matched to storage as chemical energy in a battery. Therefore, of particular interest is a low-cost, safe, rechargeable battery of high voltage, capacity, and rate capability.7,8 The higher stored volume and gravimetric energy density of a Li battery has enabled realization of the mobile phone and tablet computer. However, the cost, safety, stored energy density, current rates, and service life are issues that continue to plague the development of the Li battery for the potential mass market of electric vehicles to alleviate distributed CO2 emissions and noise pollution.
1.2 Battery systems
A list of common commercial systems is found in Table 1.1. A battery is one or more electrically connected electrochemical cells having terminals or contacts to supply electrical energy.9-12 A primary battery is a cell, or group of cells, for the generation of
2
electrical energy intended to be used until exhausted and then discarded. Primary batteries are assembled in the charged state; discharge is the primary process during operation.13-19 A secondary battery is a cell or group of cells for the generation of electrical energy in which the cell, after being discharged, may be restored to its original charged condition by an electric current flowing in the direction opposite to the flow of current when the cell was discharged.20-26 Other terms for this type of battery are rechargeable battery or accumulator. As secondary batteries are ususally assembled in the discharged state, they have to be charged first before they can undergo discharge in a secondary process.27,28
Table 1.1 List of common commercial battery systems
The advancement in battery technology has been relying on the development and use of different types of materials for electrodes and electrolytes and thus with different electrochemical reactions. Figures 1.1 compares different types of batteries; lithium-ion batteries (LIBs) offer a balanced combinatlithium-ion of high power and energy density, long cyclic life, and stability.12,29 The commercialization of lithium ion batteries has witnessed the soaring market share in the energy industry, especially in powering small electronic devices such as notebooks and cell phones.30
3
Figure 1.1 Energy storage capability of common rechargeable battery systems.
1.3 Lithium-ion batteries (LIBs)
Lithium-ion batteries (LIBs) are considered the most promising energy storage technologies for mobile electronics, electric vehicles and renewable energy systems operating on intermittent energy sources such as wind and solar.31,32 The anode is the negative electrode of a cell associated with oxidative chemical reactions that release electrons into the external circuit. The cathode is the positive electrode of a cell associated with reductive chemical reactions that gain electrons from the external circuit. Active mass is the material that generates electrical current by means of a chemical reaction within the battery. An electrolyte is a material that provides pure ionic conductivity between the positive and negative electrodes of a cell. A separator is a physical barrier between the positive and negative electrodes incorporated into most cell designs to prevent electrical shorting. The separator can be a gelled electrolyte or a microporous plastic film or other porous inert material filled with electrolyte. Separators must be permeable to the ions and inert in the battery environment. Usually
4
LIBs are connected in series or in parallel to deliver the user specified electrical characteristics. The active cathode and anode materials in a typical LIB are LiMO2 (M: Fe, Co, Ni, Mn, etc.) and graphite respectively as shown in Figures 1.2; electrically insulated by a porous polypropylene membrane separator and an intervening electrolyte of LiClO4 or LiPF6 in a mixture of organic solvents (e.g. ethylene carbonate and dimethyl carbonate). During discharging, the electrochemical potential difference between the anode and cathode drives the Li+ ions to move from anode to cathode internally through the electrolyte. The reverse process occurs during charging. The reversibility of the charge and discharge reactions at the electrodes determines the reversibility of the battery.33,34
Figure 1.2 Components of a typical lithium-ion battery and the electrochemical processes in charging and discharging.
The three most important performance indicators for a LIB are capacity, cyclability and rate capability, which are strongly dependent on the properties of the
5
active electrode materials. For emerging applications, however, fundamental improvements are needed with regard to power, safety, cycle life, and cost.
1.4 Electrode materials
Summarizes the electrochemical potential and the typical lithium ion storage capacities of both anodic and cathodic materials as shown in Figure 1.3.33,35
Figure 1.3 Voltage vs. capacity for positive and negative electrode materials.
Metal oxides have been explored for a number of years as lithium-ion battery anodes. The types of materials studied fall into three main categories: insertion compounds, notably Li4Ti5O12, compounds that act as a source of an active main group metal, e.g. Sn-based materials, and compounds that act as a precursor to form a composite of Li2O and a catalytic transition metal.36-41 Each type of material has distinct advantages and disadvantages. For the insertion compound Li4Ti5O12, high cycling stability is due in part to a negligible crystallographic volume contraction and expansion on lithium insertion and extraction, a flat voltage response at approximately 1.5 V (vs. Li/Li+), and excellent Li diffusivity.36 Other related lithium titanates, such as Li2MTi6O14 (M = Sr, Ba), have similar operating voltages and capacities but usually
6
display sloping discharge profiles due in part to the variety of crystallographic sites that are filled during single-phase reaction processes.37 In contrast, certain main group metal oxides can react with lithium to form a matrix of Li2O and an electrochemically active main group metal.38,39 These composite electrodes tend to offer a high initial capacity below 1 V; however, the reaction that forms the active matrix results in a high irreversible capacity and capacity fade on cycling remains an issue. More literatures have evaluated several transition metal oxides, e.g., CoO, in lithium cells.41 As with the main group metal oxides above, these materials work by metal displacement reactions to form lithia and, in this case, a transition metal. On charging to 3.0 V, however, the lithia is formally reduced due to the catalytic activity of the nanoscale transition metal in the electrode matrix, reducing the lithium cations at the counter electrode and reforming the metal oxide. This type of anode affords a stable, high capacity lithium-ion anode but the 3V voltage window required for reversibility may be too high for a commercially battery.38-41 Research into low price and high efficiency energy storage materials have been recently intensified, and among various candidates, tin-based materials have been intensively investigated due to their versatile and easy modification of nanostructures.
Alloy anodes are known for their high specific capacity characteristics.34,42,43 The electrochemical properties of Sn-based alloy anodes, lithium metal and graphite are summarize in Table 1.2.34 The theoretical specific capacities of alloy anodes are 2 times higher than that of graphite. Note that the charge densities (volumetric capacities) were calculated using the density of pristine metal. Even if the full volume expansion of lithiated products is considered, the charge densities of alloy anodes are still 8 times higher than those of graphite. The second merit of alloy anodes is their moderate operation potential vs. lithium. For example, Sn anodes have an onset voltage potential of 0.6 V above Li/Li+. This moderate potential averts the safety concern of lithium
7
deposition as with graphite anodes (∼0.05 V vs. Li/Li+).
The main challenge for the implementation of alloy anodes is their large volume change (up to 300%) during lithium insertion and extraction, which often leads to pulverization of the active alloy particles and poor cycle stability as shown in Figure 1.4. In addition, the first-cycle irreversible capacity loss of alloy anodes is too high for practical application.44-46
Table 1.2 Comparison of the theoretical specific capacity, charge density, volume change and onset potential of various anode materials.
Figure 1.4 Schematic the volume change of alloy materials during the cyclings.
1.5 Approaches for improving anode performance
In an attempt to reduce the cyclic capacity fade and the first cycle irreversible capacity of alloy anodes, several strategies have been developed to reduce the detrimental effects of large volume changes and to alleviate the side reaction with electrolyte. Lithiated phase Specific capacity (mA h g-1) Volumetric capacity
(mA h cm-3) Potential vs. Li (V) Volume change (%)
Li 3862 2047 0
-Li4.4Sn 994 7426 0.6 260
8
It has been confirmed in many studies that reducing the active particle size to the nanometer range and using the specific morphology of active materials can significantly improve the cycling performance of alloy anodes, especially when agglomeration of the particles is inhibited by a composite matrix.47-50
In addition, the purpose of dispersing active alloy particles within a composite matrix is to use the host matrix to buffer the large volume change of the active particles so that the electrode integrity and the electronic contact between the active particles and conductive phase can be maintained. To this end, the host matrix must allow rapid transport of electrons and Li+ and maintain the microstructural stability of the whole anode. The host matrix also acts as a spacer to reduce the aggregation of active particles during cycling. Based on the type of host phase, composite anodes can be described as inactive matrix, active matrix, carbon-matrix composite and porous structures. The improved cycling stability was attributed primarily to the ability of nanosized particles to accommodate large stress and strain without cracking.51-53
1.6 Synthetic approaches to novel nanomaterials
A widely accepted definition of a nanostructure is a system in which at least one dimension is down to 100 nm, typically including layer-like, wire-like, and particle-like structures.54-57 Since the successful synthesis of nanomaterials in our laboratory, the investigation of nanostructures has attracted considerable attention. Here, propose two simple synthesis method: hydrothermal method and vapor-solid reaction growth.58-66
Hydrothermal method is an environmentally friendly procedure due to the fact that it takes place at lower temperatures and the costs for energy, instrumentation and precursors are lower. In the past, hydrothermal methods were intensively studied and were applied to obtain a wide range of nanomaterials: powders, thin films, nanorods, fibbers, nanotubes, etc. Some of the recent examples are presented below: The
9
TiO2 fibers were synthesized using titanium isopropoxide (TTIP) under hydrothermal conditions; V2O5 nanobelt array was obtained by hydrothermal route starting from V2O5xH2O nanobelt array as precursor; SnO2/carbon composite with double-shelled hollow spherical structure were synthesized involves two main steps.58-61
Vapor-solid reaction growth (VSRG) is different from the the chemical vapor deposition reactions. However, the similar means that approaches are carried out by introducing precursors for the material to be deposited into a reaction chamber. Our group developed a unique route of phase segregation assisted VSRGs to synthesize one-dimensional (1D) nanostructures, including as cable-like Cu nanowires (NWs), a-silica encapsulated Ag NWs, CaF2@a-C core–shell NWs, SiC nanotubes (NTs), Si NWs, and graphite fibers.62-66 Solid products generated in a VSRG may interact with others differently. Thus, they do not dissolve each other. Instead, the phase segregation cause the products develop cooperatively into unique morphology. The observed morphology variations are analogous to the examples found in block copolymer systems.
1.7Aim of the thesis
Many research results related to improving the performance and cycle life of high-capacity electrode materials. Tin-based materials has been demonstrated as a potential anode material for LIBs because of its high lithium-ion storage capacity. Its theoretical specific capacity (Li4.4Sn, 992 mA h g -1) is much higher than that of graphitic carbon (LiC6, 372 mA h g -1). And Specific morphology materials are promising candidates for lithium-ion battery electrodes due to their faster charge transport, better conducting pathways, and good strain relaxation.
In this thesis, we will demonstrate a facile fabrication of tin-based nanostructures, include SnO2 nanorods (NRs), hollow spheres (HSs), nanosheets (NSs) and Sn@C core-shell nanowires (NWs) via two kinds of synthetic approaches: hydrothermal
10
method and a unique VSRGs. The preparation, characterization, and growth mechanism of the tin-based nanostructures will be discussed in detail. And then, as-fabricated tin-based nanostructures will be used as electrochemical test for LIBs. Electrochemical properties and performance of the tin-based nanostructures are demonstrated in this work.
1.8 References
1. M. Granovskii, I. Dincer and M. A. Rosen, J. Power Sources, 2007, 167, 461. 2. D. P. Birnie Iii, J. Power Sources, 2009, 186, 539.
3. M. Z. Jacobson, J. Geophys. Res., 2002, 107, 4410.
4. S. H. Chung and J. H. Seinfeld, J. Geophys. Res., 2002, 107, 4407. 5. M. Z. Jacobson, J. Geophys. Res., 2004, 109, D21201.
6. M. Z. Jacobson, Energy Environ. Sci., 2009, 2, 148.
7. R. J. Brodd, K. R. Bullock, R. A. Leising, R. L. Middaugh, J. R. Miller and E. Takeuchi, J. Electrochem. Soc., 2004, 151, K1.
8. M. S. Whittingham, Chem. Rev., 2004, 104, 4271.
9. J. Besenhard, J. Heydecke, E. Wudy, H. Fritz and W. Foag, Solid State Ionics, 1983, 8, 61.
10. K. Murata, S. Izuchi and Y. Yoshihisa, Electrochim. Acta, 2000, 45, 1501. 11. J.-S. Chung and H.-J. Sohn, J. Power Sources, 2002, 108, 226.
12. M. Winter and R. J. Brodd, Chem. Rev., 2004, 104, 4245. 13. S. Zaromb, J. Electrochem. Soc., 1962, 109, 1125. 14. B. Ratnakumar, J. Appl. Electrochem., 1988, 18, 268.
15. P. Hany, R. Yazami and A. Hamwi, J. Power Sources, 1997, 68, 708. 16. C. F. Holmes, J. Power Sources, 2001, 97, 739.
11 A1499.
18. H. Yang, Y. Wang, X. Ai and C. Cha, Electrochem. Solid-State Lett., 2004, 7, A212. 19. M. Freitas, V. Pegoretti and M. Pietre, J. Power Sources, 2007, 164, 947.
20. T. Sakai, H. Miyamura, N. Kuriyama, A. Kato, K. Oguro and H. Ishikawa, J. Electrochem. Soc., 1990, 137, 795.
21. C. J. Rydh, J. Power Sources, 1999, 80, 21.
22. N. Vassal, E. Salmon and J. F. Fauvarque, J. Electrochem. Soc., 1999, 146, 20. 23. S. Okada, S. Sawa, M. Egashira, J.-i. Yamaki, M. Tabuchi, H. Kageyama, T. Konishi
and A. Yoshino, J. Power Sources, 2001, 97, 430.
24. S. Seki, Y. Kobayashi, H. Miyashiro, Y. Ohno, A. Usami, Y. Mita, N. Kihira, M. Watanabe and N. Terada, J. Phy. Chem. B, 2006, 110, 10228.
25. H. Kim, B. Han, J. Choo and J. Cho, Angew. Chem., 2008, 120, 10305. 26. X. Zhao and L. Ma, Int. J. Hydrogen Energy, 2009, 34, 4788.
27. S. Licht and B. Wang, Electrochem. Solid-State Lett., 2000, 3, 209. 28. J.-W. Lee and B. N. Popov, J. Power Sources, 2006, 161, 565. 29. Y. Nishi, J. Power Sources, 2001, 100, 101.
30. S. F. J. Flipsen, J. Power Sources, 2006, 162, 927.
31. P. G. Bruce, B. Scrosati and J.-M. Tarascon, Angew. Chem. Int. Ed., 2008, 47, 2930. 32. D. Deng, M. G. Kim, J. Y. Lee and J. Cho, Energy Environ. Sci., 2009, 2, 818. 33. D. Liu and G. Cao, Energy Environ. Sci., 2010, 3, 1218.
34. W.-J. Zhang, J. Power Sources, 2011, 196, 13.
35. M. Armand and J.-M. Tarascon, Nature, 2008, 451, 652.
36. E. Ferg, R. Gummow, A. De Kock and M. Thackeray, J. Electrochem. Soc., 1994, 141, L147.
37. I. Belharouak and K. Amine, Electrochem. Commun., 2003, 5, 435.
12 Electrochim. Acta, 2001, 46, 1161.
39. P. Meduri, C. Pendyala, V. Kumar, G. U. Sumanasekera and M. K. Sunkara, Nano Lett., 2009, 9, 612.
40. F. Badway, I. Plitz, S. Grugeon, S. Laruelle, M. Dolle, A. Gozdz and J.-M. Tarascon, Electrochem. Solid-State Lett., 2002, 5, A115.
41. V. Pralong, J. B. Leriche, B. Beaudoin, E. Naudin, M. Morcrette and J. M. Tarascon, Solid State Ionics, 2004, 166, 295.
42. D. Larcher, S. Beattie, M. Morcrette, K. Edstrom, J.-C. Jumas and J.-M. Tarascon, J. Mater. Chem., 2007, 17, 3759.
43. H. Kim, G. Jeong, Y.-U. Kim, J.-H. Kim, C.-M. Park and H.-J. Sohn, Chem. Soc. Rev., 2013, 42, 9011.
44. M. Winter and J. O. Besenhard, Electrochim. Acta, 1999, 45, 31. 45. R. Benedek and M. M. Thackeray, J. Power Sources, 2002, 110, 406.
46. U. Kasavajjula, C. Wang and A. J. Appleby, J. Power Sources, 2007, 163, 1003. 47. L. Beaulieu, D. Larcher, R. Dunlap and J. Dahn, J. Electrochem. Soc., 2000, 147,
3206.
48. C. K. Chan, H. Peng, G. Liu, K. McIlwrath, X. F. Zhang, R. A. Huggins and Y. Cui, Nat Nano, 2008, 3, 31.
49. N. Ding, J. Xu, Y. Yao, G. Wegner, I. Lieberwirth and C. Chen, J. Power Sources, 2009, 192, 644.
50. H. Li, Z. Wang, L. Chen and X. Huang, Adv. Mater., 2009, 21, 4593. 51. J. Yang, M. Winter and J. O. Besenhard, Solid State Ionics, 1996, 90, 281.
52.J. Yang, M. Wachtler, M. Winter and J. O. Besenhard, Electrochem. Solid-State Lett., 1999, 2, 161.
53. Q. Si, K. Hanai, N. Imanishi, M. Kubo, A. Hirano, Y. Takeda and O. Yamamoto, J. Power Sources, 2009, 189, 761.
13
54. C. M. Lieber, Solid State Commun., 1998, 107, 607.
55. X. Zhou, L.-J. Wan and Y.-G. Guo, Chem. Commun., 2013, 49, 1838.
56. W. Tian, C. Zhang, T. Zhai, S.-L. Li, X. Wang, M. Liao, K. Tsukagoshi, D. Golberg and Y. Bando, Chem. Commun., 2013, 49, 3739.
57. S. I. Cha, K. H. Hwang, Y. H. Kim, M. J. Yun, S. H. Seo, Y. J. Shin, J. H. Moon and D. Y. Lee, Nanoscale, 2013, 5, 753.
58. P.-C. Chen, M.-C. Tsai, C. Chen, I. N. Lin, S. Sheu, Y.-S. Lin, J.-G. Duh, H.-T. Chiu and C.-Y. Lee, J. Mater. Chem., 2012, 22, 5349.
59. P.-C. Chen, M.-C. Tsai, M.-H. Yang, T.-T. Chen, H.-C. Chen, I. C. Chang, Y.-C. Chang, Y.-L. Chen, I. N. Lin, H.-T. Chiu and C.-Y. Lee, Appl. Catal. B: Environ., 2013, 142, 752.
60. Y. Wang, H. J. Zhang, W. X. Lim, J. Y. Lin and C. C. Wong, J. Mater. Chem., 2011, 21, 2362.
61. X. W. Lou, D. Deng, J. Y. Lee and L. A. Archer, Chem. Mater., 2008, 20, 6562. 62. M. Y. Yen, C. W. Chiu, C. H. Hsia, F. R. Chen, J. J. Kai, C. Y. Lee and H. T. Chiu,
Adv. Mater., 2003, 15, 235.
63. C.-H. Hsia, M.-Y. Yen, C.-C. Lin, H.-T. Chiu and C.-Y. Lee, J. Am. Chem. Soc., 2003, 125, 9940.
64. C.-H. Huang, Y.-H. Chang, C.-Y. Lee and H.-T. Chiu, Langmuir, 2005, 22, 10. 65. C.-H. Wang, H.-K. Lin, T.-Y. Ke, T.-J. Palathinkal, N.-H. Tai, I. N. Lin, C.-Y. Lee
and H.-T. Chiu, Chem. Mater., 2007, 19, 3956.
66. C.-H. Huang, Y.-H. Chang, K. Lin, C.-W. Peng, W.-S. Chung, C.-Y. Lee and H.-T. Chiu, J. Phys. Chem. C, 2007, 111, 4138.
14
Chapter 2 Vapor Solid Reaction Growth of SnO
2Nanorods as an Anode Material for Lithium-Ion
Batteries
2.1 Introduction
Li-ion batteries (LIBs) have been commonly used as a power source for portable electronic devices and are also considered as a candidate to power electric vehicles and hybrid electric vehicles.1,2 Nanoscale materials are expected to contribute significantly to realizing these important goals in LIB research because the device may achieve high capacity, power rate, and long cycle lifetime simultaneously.3,4 Graphite is the current choice of anode material for commercial LIBs. However, its theoretical capacity is low, 372 mA h g−1.5 To achieve high energy density, novel materials are required to replace presently used graphite anodes. Many promising anode electrode materials, such as Si, TiO2, and Sn-based materials,6–11 have been explored in order to overcome the limitations. The high theoretically capacity of Sn-based materials are more than twice of that of the commercial graphite. The potential of Li+ ion intercalation of Sn-based materials is low. Among them, SnO2 is regarded as one of the most promising candidates for anode application in LIBs.12–19 When SnO
2 is used as the active component in the LIBs, the electrochemical reactions are comprised of irreversible and reversible steps, (2-1) and (2-2), respectively:
SnO2 + 4 Li+ + 4 e- 2 Li2O + Sn (2-1)
Sn + x Li+ + x e
⇄ LixSn (0 x 4.4) (2-2)
However, these steps provide some drawbacks. Due to its irreversible nature, the first reaction is responsible for the severe capacity loss in the first few cycles. This is
15
the result of the formation of an inactive amorphous byproduct matrix. It probably contains Li2O, formed from the reduction of SnO2 by Li, the decomposed carbonate-based electrolyte, and the solid electrolyte interphase (SEI).20 The second reaction is reversible, with Li+ ions repeatedly stored and released during alloying and dealloying cycles. However, a drastic volume change, around 300% during the cyclings, is induced in this step.21 The so-called pulverization problem blocks the electrical contact pathways and leads to rapid deterioration of the electrode capacity. Unique SnO2 structures prepared by different synthetic routes could overcome the problem.14– 19 Literature example of electrodes composed of nanoparticles (NPs), one-dimensional (1D), two-dimensional (2D), and hollow nanostructures of SnO2 showed improved electrochemical performances. These cases, with high surface-to-volume ratio and excellent surface activities, are summarized in Table 2.1.
16
Table 2.1 Summary of electrochemical properties of Sn containing electrodes for rechargeable Li-ion batteries.
Electrode material Experimental Method Morphology
and Composition Electrochemical Performance Ref Working Potential (V)
Cycling Rate Capacity
(mA h g-1) SnO2 NTs NWs NPs Sol–gel vacuum-suction Thermal-evaporation sol–gel D of NT: 200 nm D, L of NW: 200 nm, ~tens μm Size of NP < 100 nm 0.05 – 1.5 50 cycles at 100 mA g -1 (1 C = 790 mA g-1) 250 210 90 14a
SnO2 NTs Infiltration technique Diameter: 180 – 230 nm 0.005 – 2 80 cycles at 0.05 mAcm-2 525 15b
SnO2 NWs Thermal evaporation Diameter: 200 – 500 nm
Length: 10 μm 0.005 – 2.5
50 cycles at 100 mA g-1
(1 C = 782 mA g-1) 460 16
c
SnO2 nanoflowers Free cation-induced
decomposition Diameter: 50 – 110 nm 0.01 – 2
20 cycles at 0.1 C
(1 C = 783 mA g-1) 450 17d
SnO2 nanosheets Hydrothermal method Thin: 1.5 – 3 nm 0.005 – 3 20 cycles at 0.1 C
(1 C = 782 mA g-1) 559 18
e
SnO2 hollow
nanospheres Hydrothermal method
Diameter: 50 – 200 nm Wall thickness: 10 nm 0.005 – 2 40 cycles at 0.2 C (1 C = 645 mA g-1) 450 19 f SnO2 NRs VaporSolid Reaction Growth (VSRG) Diameter: 15 nm, Length: 1000 nm 0.005 – 2 100 cycles at 100 mA g-1 (1 C = 790 mA g-1) 435 This work
17
SnO2/Cu nanosheets Rolled-up nanotechnology SnO2 film: 50 nm,
Cu film: 3 nm 0.05 – 1.5
150 cycles at 100 mA g-1
(1 C = 782 mA g-1) 764 36g
NT: nanotube, NW: nanowire, NP: nanoparticle.
a. M.-S. Park, Y.-M. Kang, G.-X. Wang, S.-X. Dou and H.-K. Liu, Adv. Funct. Mater., 2008, 18, 455. b. Y. Wang, J. Y. Lee and H. C. Zeng, Chem. Mater., 2005, 17, 3899.
c. M. S. Park, G. X. Wang, Y. M. Kang, D. Wexler, S. X. Dou and H. K. Liu, Angew. Chem., 2007, 119, 764.
d. J. Ning, Q. Dai, T. Jiang, K. Men, D. Liu, N. Xiao, C. Li, D. Li, B. Liu, B. Zou, G. Zou and W. W. Yu, Langmuir, 2009, 25, 1818. e. C. Wang, Y. Zhou, M. Ge, X. Xu, Z. Zhang and J. Z. Jiang, J. Am. Chem. Soc., 2010, 132, 46.
f. X. W. Lou, Y. Wang, C. Yuan, J. Y. Lee and L. A. Archer, Adv. Mater., 2006, 18, 2325.
18
In previous works, we have demonstrated the growths of 1D nanostructures, including as Sn@C core–shell nanowires (NWs), SiC nanotubes (NTs), Si NWs, and graphite fibers, by phase segregation assisted vapor–solid reaction growths (VSRGs).10,22,23 Solid products generated in a VSRG may interact with others differently. Thus, they do not dissolve each other. Instead, the phase segregation cause the products develop cooperatively into unique morphology. The observed morphology variations are analogous to the examples found in block copolymer systems.24,25 In these cases, due to chemical incompatibility, each one of the component blocks self-assembles into nanophases ordered and arranged discretely. In this study, we report a new reaction employing vapor phase SnCl4 and CaO solid particles as the reactants. The products of the VSRG process are SnO2 and CaCl2 solids. After the removal of the CaCl2 salt, SnO2 nanorods (NRs) are isolated. Electrodes composed of the SnO2 NRs are investigated for possible LIB electrode applications. Our observations are discussed below.
2.2 Experimental
2.2.1 Growth of SnO2 nanorods
A typical reaction was carried out inside a hot-wall reactor composed of a Lindberg tubular furnace and a quartz tube (diameter 27 mm). Dehydration of Ca(OH)2 (Sigma-Aldrich) uniformly placed in a quartz boat (length 10 cm) at the centre of the furnace at 1023 K for 1 h produced CaO. SnCl4 (Acros Organics, 99%, anhydrous) was vaporized at room temperature and atmospheric pressure by a flowing stream of Ar (20 sccm) into the reactor and reacted with CaO at a designated temperature and time period. The products were cooled naturally to room temperature in Ar and collected. The products were washed with deionized (DI) water several times to remove the soluble portion. The insoluble portion was dried at 353 K overnight to offer a white product. A
19
summary of the experimental conditions and the obtained products are listed in Table 2.2.
Table 2.2 Experimental conditions for samples prepared by reacting SnCl4(g) and CaO(s).
Sample Reaction Temperature (K) Reaction Time (min) Washed by H2O(l)
Observed Solid Phases in the Product
A 1023 360 Yes SnO2(s)
B 1023 360 No SnO2(s), CaCl2(s)
C 1023 60 No SnO2(s), CaSnO3(s), CaCl2(s),
CaO(s)
D 1073 360 Yes SnO2(s)
E 973 360 Yes SnO2(s), CaSnO3(s)
SnCl4(l) was evaporated at room temperature by Ar(g) (10 sccm). Another flowing stream of Ar(s) (10 sccm) was also introduced into the reactor.
2.2.2 Materials characterizations
Samples were characterized by using a Bruker AXS D8 Advance X-ray diffractometer (XRD) with Cu Kα1 radiation. Scanning electron microscopic (SEM) images and energy dispersive X-ray (EDX) spectra were taken with a Hitachi S-4700I operated at 15 keV. Transmission electron microscopic (TEM), electron diffraction (ED), high-resolution TEM (HRTEM) images, and EDX data were acquired on a JEOL JEM-2010 at 200 kV.
2.2.3 Electrochemical tests
Typically, two-electrode 2032 coin-type cells were assembled using the materials described below in a dry room. An N-methyl pyrrolidone (NMP) (Timcal) slurry was prepared by mixing SnO2, carbon black (Super-P) (Timcal), and polyvinylidene fluoride (PVDF) with a weight ratio 80 : 10 : 10. A Cu foil (Furukawa) (thickness 14 μm),
20
vacuum dried at 403 K overnight, was compressed and cut into disks (diameter 14 mm). An electrolyte composed of LiClO4 (Sigma-Aldrich) dissolved in a mixture of ethylenecarbonate (EC) (Alfa-Aesar) and dimethylcarbonate (DMC) (Alfa-Aesar) (1.0 M, volume ratio 1 : 1) was prepared also. A Li plate was cut into disks (diameter, 14 mm) and used as both the reference and the counter electrode. The amount of the composite was weighed and combined with the electrolyte and the electrodes into coin-type cells. Electrochemical measurements were performed with a battery test system (UBIQ technology, BAT-750B). Cyclic voltammetry (CV) and electrochemical impedance spectroscopy (EIS) experiments were carried out using a CHI 6081C (CH Instruments) electrochemical analyzer. Electrochemical experiments of the coin-type cells were cycled between 0.005 V and 2.0 V at room temperature. Some of the devices were disassembled after the tests. The composite solids after the cycling were investigated without being washed.
2.3 Results and discussion
In a horizontal hot-wall quartz tube reactor, Ca(OH)2 powder was dehydrated. As shown by the XRD of the product, CaO was formed (JCPDS card file no. 44-1481 and 70-4068).25 Then, the as-formed powder was reacted to a flowing mixture of SnCl4 and Ar at 1023 K under atmospheric pressure. After the as-prepared product was washed with DI water to remove CaCl2, the final product sample A, characterized to be SnO2 NRs as described below, was obtained. Detailed experimental conditions and results are summarized in Table 2.2.
2.3.1 Characterization of SnO2 NRs
SEM images of sample A are shown in Figure 2.1. Figure 2.1a displays the typical morphology found A. From a selected area in Figure 2.1a, numerous NRs
21
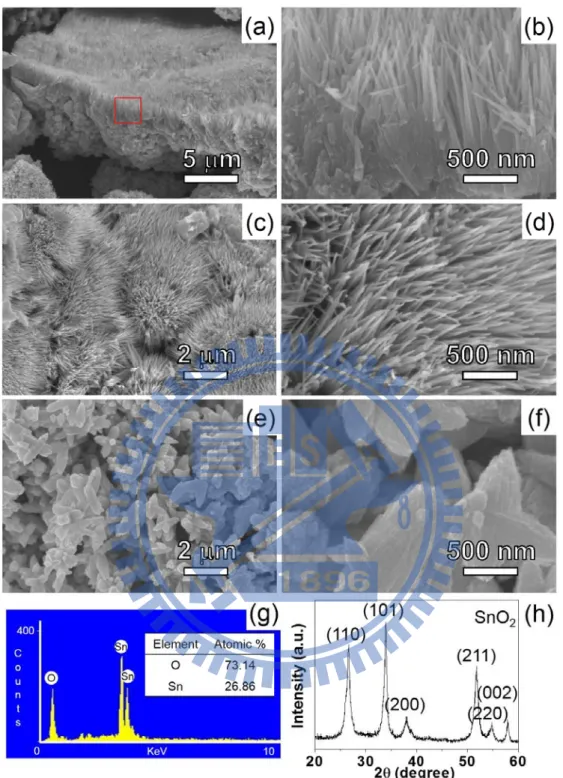
(diameter 10–20 nm, length 1–2 μm) on top of an aggregate of particles can be seen in the magnified view in Figure 2.1b. Figure 2.1c and 2.1d display the views on top of the NRs. Figure 2.1e and 2.1f present the low and high magnification views of representative aggregates of particles, respectively. From TEM studies (see below), the particles are characterized to be composed of bundles of NRs. An EDX of sample A shown in Figure 2.1g indicates that it contains both Sn and O. The XRD pattern in Figure 2.1h confirms that sample A is composed of SnO2 (JCPDS card File no. 41-1445).26 Another type of less observed morphology, shown in Figure 2.2, also presents bundles of branched NRs. The estimated amount of this morphology is ca. 5%.
22
Figure 2.1 Low and high magnifications SEM images of A. (a) Sample with both NRs and particles, (b) enlarged view of the squared area in (a), (c and d) views of NRs, and (e and f) views of particles. (g) EDX and (h) XRD pattern.
23
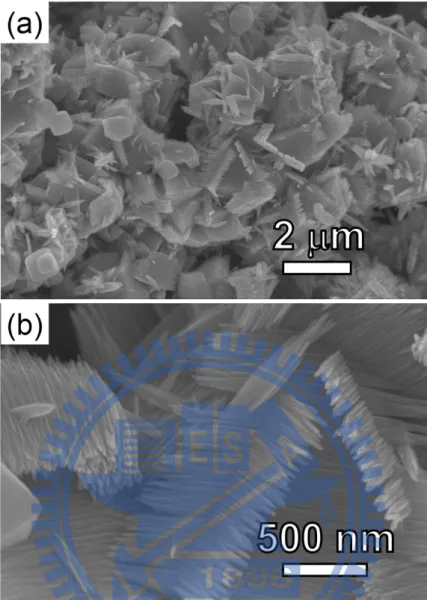
Figure 2.2 Low magnification SEM image in (a) shows the presence of a less observed morphology at the centre. (b) Enlarged view of the morphology.
TEM studies of sample A are shown in Figure 2.3. In Figure 2.3a, the image of a 1D material is presented. Its length, 150 nm, suggests that it is a fragment of a NR. It confirms that the NR structure with diameter 7–20 nm are observed shown. The SAED in Figure 2.3b shows a dot pattern. This indicates that the sample can be indexed to the [0 1 0] zone axis of the single crystalline SnO2. From the image, the lattice parameters a and c of a tetragonal crystal system are estimated to be 0.47 nm and 0.31 nm, respectively.26 Figure 2.3c shows a high resolution lattice image of the sample displayed in Figure 2.3a. The space between the parallel fringes from the crystalline structure was measured to be 0.24 nm and 0.27 nm. These are equal to the spacings of
24
the {2 0 0} and {1 0 1} planes of SnO2, respectively. Also, the image suggests that the diameter of the NR is 18 nm. Combined with the SAED result, the crystallization of the NR is determined to be along the [0 0 2]. Figure 2.3d displays the image of a particle found in sample A. The magnified view of a selected area shown in Figure 2.3d is presented in Figure 2.3e. From the image, it is clear that the particle is actually composed of bundles of numerous NRs with gaps among them. The SAED of the selected area displays a slightly diffused dot pattern which can be indexed to SnO2 also.26 This suggests that all NRs in the bundles are single crystalline, with the same crystallization orientation but independent from each other in space. Thus, voids exist among the NRs. According to a literature report, the volume change is about 300% during the cyclings.21 By assuming that the length of the NR does not increase during the cyclings, the diameter would increase about 75% at most. These gaps or voids may act as the buffer areas to accommodate the volume expansion of the electrode material during Li alloying and dealloying processes.14,15 Details will be discussed more below.
25
Figure 2.3 TEM studies of A. (a) Image of a section of a NR, (b) SAED pattern, and (c) HRTEM image from the circled area in (a), (d) a bundle of NRs, (e) high magnification image, and (f) SAED pattern from the squared area in (d).
2.3.2 Proposed reaction pathway
To understand more about the factors affecting the NRs growths, several samples prepared at different reaction conditions were investigated. Sample B was the as-synthesized product formed at 1023 K without DI water washing. The co-existence of SnO2 and CaCl2 was observed by SEM, EDX and XRD, as shown in Figure 2.4 and 2.5. SEM and XRD characterizations of samples C, D and E are displayed in Figure 2.5-2.7. In samples C and E, prepared by using a shorter reaction time or a lower temperature, respectively, than the condition employed to form sample A, the coexistence of SnO2 and CaSnO3 is found. We attribute CaSnO3 as an observed intermediate and describe the overall reactions in the equation below.
SnCl4(g), 1023 K SnCl4(g), 1023 K
CaO(s) CaSnO3(s) SnO2(s) -CaCl2(s) -CaCl2(s)
The overall reaction stoichiometry is proposed to be:
(200) (101) (101) (002) [010] (200) (101) (101) (002) [010]
(c)
(d)
(b)
(a)
(e)
(f)
26
2 CaO(s) + SnCl4(g) SnO2(s) + 2 CaCl2(s) Gr° = -356.2 kJ/mol The reaction is thermodynamically favoured due to the negative standard Gibbs free energy of reaction ΔGo
r.27 In addition, we suggest that SnO2 NRs are grown via a VSRG pathway similar to the one proposed for the growths of nanosized graphite and Si crystals with various mophologies.23 The overall phenomena resembled the morphology alterations caused by the phase segregation in block copolymer systems.24,25 In this study, the initial products were CaSnO
3 and CaCl2. Further reactions between the SnCl4 vapor and the CaSnO3 solid would produce a molten mixture of SnO2 and CaCl2. The solubility of the high melting point SnO2 (mp 1903 K) in the low melting ionic CaCl2 (mp 1045 K) is expected to be extremely low. As the reaction prolongs, SnO2 crystallizes into the NR shape in the molten CaCl2. These are summarized in Scheme 2.1.
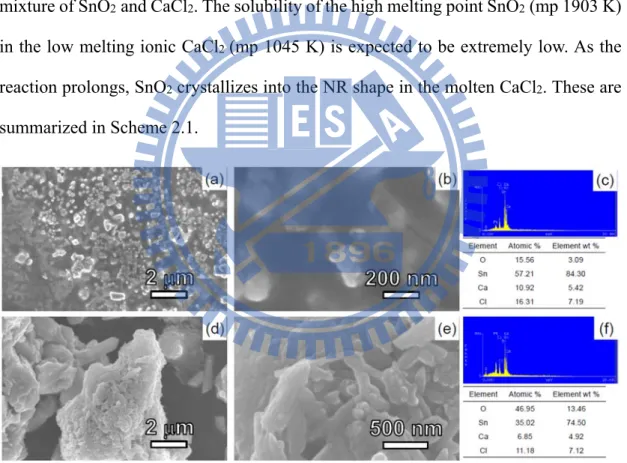
Figure 2.4 (a) Low and (b) high magnification SEM images and (c) EDX data from an area of sample B. (d) – (f) Corresponding data from another area of B.
27
Figure 2.5 XRD patterns of samples B and C. Standard XRD patterns and the corresponding JCPDS file numbers are shown also.
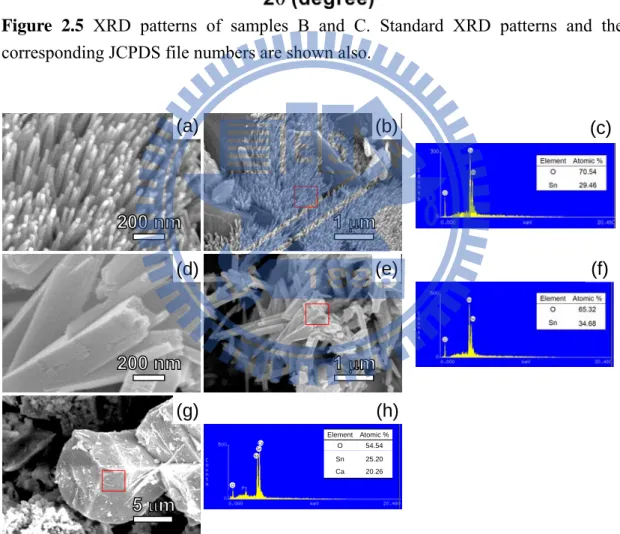
Figure 2.6 Low and high magnification SEM images of samples D and E. The EDX data are from the selected areas marked by red rectangles. Images and EDX of D are shown in (a) – (c). The data suggest that D is composed of SnO2. Images and EDX of E are shown in (d) – (h). There two types of solids. The NRs shown in (d) and (e) are SnO2, indicated by the EDX result in (f). According to the EDX in (h), the particles in (g) are CaSnO3. The assignments are consistent with the XRD results shown in Figure 2.7. Sn Sn O Element Atomic % O 54.54 Sn Ca 25.20 20.26 Ca (a) (b) (d) (e) (g) (h) (c) (f)
28
Figure 2.7 XRD patterns of samples A, D and E. Standard XRD patterns and the corresponding JCPDS file numbers are shown also.
Scheme 2.1 Proposed VSRG pathway to form SnO2 NRs and schematic diagram
showing the role of the amorphous byproduct matrix during the lithiation and de-lithiation.
2.3.3 Electrochemical properties of SnO2 NRs
Half-cells composed of a Li foil, as the negative electrode (anode), and SnO2 NRs, as the positive electrode (cathode), were assembled into test cells for the following electrochemical studies. To understand the electrochemical reactions during the cell cycling, CV measurements were performed and presented in Figure 2.8a. In the first cathodic sweep, a broad peak at 0.59 V is attributed to the reduction of SnO2 to form Sn, as described in eqn (1-1), and the formation of the SEI layer.28,29 In the following
29
cycles, the peak disappears while two peaks, at 0.88 V and 1.15 V, are observed. Another peak at 0.07 V is found in the first cycle. It shifts slightly in the subsequent scans to 0.2 V with reduced peak current. The observations are attributed to the occurrence of irreversible processes initially and the formation of various LixSn alloys, as suggested by eqn (2-2), during the cathodic sweeps.30,31 In the anodic sweeps, two peaks are found. The one at ca. 0.61 V is assigned to the dealloying process of LixSn, the reverse reaction in eqn (2-2). The other peak is at ca.1.34 V, which is associated with partial oxidation of Sn to form tin oxides. The signal corresponds to a small peak at ca. 0.55 V in the cathodic scans, indicating the reduction of the oxides to Sn metal.28 Figure 2.8b depicts the specific capacity and the columbic efficiency of the discharge–charge process of the half-cell with a cycling rate 100 mA g−1 (0.13 C). The first discharge and charge steps deliver specific capacities 1583 and 1044 mA h g−1, respectively. The large initial capacity loss can be attributed to the reduction of SnO2 to form Sn, the formation of the SEI layer on the electrode surface during the first discharge step, and the storage of Li+ ions in the EC/DMC-based electrolytes.28– 31 These materials are attributed to the major components in the inactive amorphous byproduct matrix formed among the NRs and will be discussed more below. Obviously, the capacity dropped swiftly for the first twenty five cycles. In the later cycles, the specific capacity and the columbic efficiency stay relatively stable. At the end of the one hundredth cycle, a respectable specific capacity 435 mA h g−1 and a columbic efficiency over 98% are observed. In contrast, the cycling performances of half-cells constructed from commercial SnO2 powders (particle sizes 1–10 μm and 100 nm) at 100 mA g−1 are poor, as shown in Figure 2.9a. Figure 2.9b displays the discharge capacities of the device fabricated from SnO2 NRs at high current rates 500, 1000, and 3000 mA g−1 (0.63, 1.26 and 3.78 C). After one hundred cycles, the discharge (Li alloying) capacities are found to be 357, 290 and 215 mA h g−1, respectively. In Figure
30
2.8c, a capacity 997 mA h g−1 is observed after the battery is cycled at 100 mA g−1 for five times. Then, after it is cycled at 500 mA g−1, 1000 mA g−1, and finally 3000 mA g−1 for five times each, the half-cell shows a capacity 510 mA h g−1 at 100 mA g−1, very close to value found in the twenty fifth measurement shown in Figure 2.8b, 518 mA h g−1. These observations demonstrate that even after the fast discharge–charge cycles at 3000 mA g−1, the electrode did not degrade severely so that the half-cell still exhibited excellent cycling properties.
31
Figure 2.8 (a) CV of a SnO2 NR electrode scanned at 0.5 mV s−1. (b) Specific capacity
and columbic efficiency of a SnO2 NR electrode cycled at 100 mA g−1. (c) Discharge capacity of a SnO2 NR electrode as a function of discharge rate (100–3000 mA g−1). All experiments were cycled between 0.005 V and 2.0 V vs. Li/Li+.
(a)
0.0 0.5 1.0 1.5 2.0 -10 -5 0 5 10 1st 2nd 3rd 4th Cur rent ( m A ) Potential vs Li/Li+(a)
(b)
0 20 40 60 80 100 0 500 1000 1500 2000 Co lumbic ef fi cie n cy (%) Discharge, 435 mAhg-1 Charge, 430 mAhg-1 Sp ec if ic c apa city / mAh g -1 Cycle number 60 70 80 90 10032
Figure 2.9 (a) Discharge capacities of electrodes fabricated from commercial SnO2
powders (sizes: 1 - 10 m and 100 nm) at a cycling rate 100 mA g-1. (b) Electrochemical performance of a SnO2 NR electrode cycled between 0.005 V and 2.0 V vs. Li/Li+ after first ten cycles were cycled at 100 mA g-1. 100 mA g-1 (), 500 mA g-1 (), 1000 mA g-1 (), and 3000 mA g-1 ().
Clearly, the half-cells constructed from the SnO2 NRs demonstrate much better performance than the ones from the commercial SnO2 powders do. To understand the alteration of the electrode material after repeated lithiation and de-lithiation processes, a SEM image of the electrode after one hundred discharge–charge cycles is shown in Figure 2.10a. Clearly, many NRs still maintain their original 1-D morphology when they are compared to the image of the original electrode shown in Figure 2.10b. In addition, the EDX and the XRD data of the electrode material after one hundred cycles are displayed in Figure 2.11. The EDX spectra in Figure 2.11a suggest that both Sn and
(b)
(a)
0 20 40 60 80 100 0 500 1000 1500 100 mA g-1 500 mA g-1 1000 mA g-1 3000 mA g-1 Spec ific capacity / m Ah g -1 Cycle number 100 mA g-1 0 10 20 30 40 50 0 500 1000 1500 2000 S p ec if ic ca p a c it y / mA h g -1 Cycle number particle size 1 – 10 m 100 nm33
O atoms are the major components of the electrode. The XRD pattern in Figure 2.11b indicates the presence of Sn and Cu metals, which is the foil for the electrode contact. This suggests that the SnO2 NRs has been completely converted into Sn metal NRs during the discharge–charge cycles. Based on the results, we assign the O signal found in the EDX to Li2O, formed from the reduction of SnO2 by Li, the irreversible decomposition of the electrolyte, and the SEI layer on the surface of the active material formed during the cell cyclings.20,28–33 Due to its light mass, Li cannot be observed by EDX. These inactive components appear to be amorphous because no related XRD signals can be found in Figure 2.11b. We assume that the amorphous byproduct matrix played an important role for maintaining the cell performance over extended discharge– charge cycles.33 The soft and low density matrix appears to intersperse uniformly among the NRs. The separations could effectively minimize the aggregation of the as-formed Sn NRs. Also, due to the even distribution of the voids among the inactive matrix, the mechanical stress caused by the volume changes in the lithiation and de-lithiation process could be alleviated, as shown in Scheme 2.1. In contrast, the electrode fabricated from commercial SnO2 show severe aggregations after fifty discharge– charge cycles, as demonstrated in the SEM image shown in Figure 2.12. Considering a relatively wide voltage window applied in this study, we summarize the enhanced capacity of the SnO2 NRs based cells at long cycles and variable rates to the following reasons. First of all, the amorphous byproduct matrix in the voids among the NRs might effectively buffer the drastic volume changes during the lithiation and de-lithiation process. Also, due to the presence of the matrix, the NR structure was maintained after SnO2 was reduced to Sn. The NR structure may provide effective electrolyte/electrode contact surfaces which shorten the transport lengths for both electrons and Li+ ions. In addition, the diffusion time of ions could be reduced in the nanocomposite so that the rates of phase transitions are increased.
34
Figure 2.10 SEM images of (a) an electrode after one hundred cycles of lithiation and de-lithiation (without being washed) and (b) the original SnO2 NR electrode. The electrode was fabricated from a mixture of SnO2NRs, carbon black, and binder.