行政院國家科學委員會專題研究計畫 成果報告
全民健康保險藥品市場集中度之研究
計畫類別: 個別型計畫
計畫編號: NSC94-2416-H-004-026-
執行期間: 94 年 08 月 01 日至 95 年 07 月 31 日
執行單位: 國立政治大學財政系
計畫主持人: 周麗芳
共同主持人: 陳曾基
報告類型: 精簡報告
處理方式: 本計畫可公開查詢
中 華 民 國 95 年 10 月 30 日
摘要
背景: 台灣自 1997 年起,於西醫與牙醫門診,逐步實施醫藥分業。此政策欲
促進藥師的自主與提升藥品處方的透視與安全。然而,部分診所欲避免釋出處
方的損失,或於診所內聘請藥師,或於診所旁開設藥局(
「門前藥局」
)
。
目的: 釐清在全民健康保險的體系內 1996 年至 2004 年間開業藥局與診所的關
係。
研究方法: 全民健康保險研究資料庫提供 1997 年至 2004 年特約藥局的全部申
報檔案。找出每一張已調劑處方的開立醫事機構,用以計算出藥局業務的集中
度
CR-1(1-firm concentration ratio,該藥局每年調劑的處方中,來自最大客戶
【診所或醫院】的佔率)
。相同處理方式也應用於診所。此外,亦找出每家診所
的最大合作藥局,並比較兩者的
CR-1。每月調劑大於 900 張處方的藥局被視為
生意較好。如果某家藥局的
CR-1 大於等於 0.99 且其最大合作診所的 CR-1 也大
於等於
0.99,則兩者可視為業務上關係密切,可能是門前藥局。
結果: 全部特約藥局的調劑處方數目,由 1996 年的 226,901 張,成長至 2004
年的
59,785,039 張;同時期,有調劑的特約藥局數目由 481 家成長至 3,529 家
。1999 年後越來越多的藥局有較高的 CR-1。大部分的處方只可能在一處調劑
。在
2004 年,1,429 家診所每月釋出大於 900 張處方且 CR-1 大於等於 0.99。
這些診所釋出的處方數目,相當於所有在特約藥局調劑處方的
75.8%。其中 811
家診所,其合作藥局的
CR-1 亦大於等於 0.99。
結論: 大部分西醫與牙醫診所開立的處方只可能在一處調劑,意味著藥師的專
業自主與病人的用藥權益可能受到影響。
關鍵詞: 集中度、藥品處方、衛生服務研究、全國衛生計畫、藥局、專業自主
、台灣
ABSTRACT
Background: In Taiwan, a policy of separation of prescribing and dispensing practices
of practitioners at Western medical and dental clinics was implemented on an
incremental basis in 1997. The purpose of this policy was to promote pharmacists’
autonomy and increase the transparency and safety of prescribing medications. To
avoid profit loss from no longer being able to dispense prescription medications, some
clinics opened pharmacies located under the same roof as the clinic (“next-door”
pharmacies) or hired an on-site pharmacist. This practice might compromise
pharmacists’ professional autonomy and patients’ benefit in pharmaceutical care.
Objective: The aim of the current study was to clarify the relationship between
practicing pharmacies and clinics that resulted from contracts between pharmacies
and the Bureau of National Health Insurance from 1996 to 2004.
Methods: The National Health Research Institutes database in Taiwan supplied the
complete claims data sets of practicing pharmacies from 1997 to 2004. The
prescribing source of every dispensed prescription was used to calculate the 1-firm
concentration ratio (CR-1) (ie, the proportion of prescriptions issued by the largest
prescribing clinic/hospital in the total number of dispensed prescriptions of a
pharmacy in each year). Similar processing was applied to the clinics. We identified
each clinic’s largest cooperating pharmacy and compared their CR-1s. Pharmacies
that dispensed >900 prescriptions/mo during the study period were considered
thriving. Pharmacies with a CR-1 ≥0.99 and whose largest cooperating clinic had a
CR-1 ≥0.99 were considered to have a close business relationship, possibly indicating
a next-door pharmacy.
Results: The total number of prescriptions dispensed at all pharmacies in the database
grew from 226,901 in 1996 to 59,785,039 in 2004, and the number of pharmacies,
from 481 to 3,529. An increasing number of pharmacies had a higher CR-1 after 1999.
We found that most prescriptions could be dispensed at only 1 pharmacy during the
study period. In 2004, 1,429 clinics had >900 prescriptions/mo dispensed externally
and a CR-1 ≥0.99. They had released 75.8% of all prescriptions to be dispensed at
practicing pharmacies; 811 of these clinics had a cooperating pharmacy with a CR-1
≥0.99.
Conclusions: In this data analysis in Taiwan, most prescriptions from practitioners at
Western medical and dental clinics could be dispensed at only 1 pharmacy during the
study period, suggesting that pharmacists’ professional autonomy and the patients’
benefit in pharmaceutical care might be compromised in Taiwan.
Keywords: concentration ratio, drug prescriptions, health services research, national
health programs, pharmacies, professional autonomy, Taiwan.
Co
py
rig
ht
©
Ex
ce
rpt
a M
ed
ica
, In
c,
20
06
No
t f
or
Co
mm
erc
ial
Dis
tri
bu
tio
n
ABSTRACTBackground: In Taiwan, a policy of separation of
prescribing and dispensing practices of practitioners at Western medical and dental clinics was implement-ed on an incremental basis in 1997. The purpose of this policy was to promote pharmacists’ autonomy and increase the transparency and safety of prescrib-ing medications. To avoid profit loss from no longer being able to dispense prescription medications, some clinics opened pharmacies located under the same roof as the clinic (“next-door” pharmacies) or hired an on-site pharmacist. This practice might compro-mise pharmacists’ professional autonomy and patients’ benefit in pharmaceutical care.
Objective: The aim of the current study was to
clari-fy the relationship between practicing pharmacies and clinics that resulted from contracts between pharma-cies and the Bureau of National Health Insurance from 1996 to 2004.
Methods: The National Health Research Institutes
database in Taiwan supplied the complete claims data sets of practicing pharmacies from 1997 to 2004. The prescribing source of every dispensed prescription was used to calculate the 1-firm concentration ratio (CR-1) (ie, the proportion of prescriptions issued by the largest prescribing clinic/hospital in the total number of dis-pensed prescriptions of a pharmacy in each year). Similar processing was applied to the clinics. We iden-tified each clinic’s largest cooperating pharmacy and compared their CR-1s. Pharmacies that dispensed >900 prescriptions/mo during the study period were considered thriving. Pharmacies with a CR-1 ≥0.99 and whose largest cooperating clinic had a CR-1 ≥0.99 were considered to have a close business rela-tionship, possibly indicating a next-door pharmacy.
Results: The total number of prescriptions
dis-pensed at all pharmacies in the database grew from 226,901 in 1996 to 59,785,039 in 2004, and the number of pharmacies, from 481 to 3529. An
increas-ing number of pharmacies had a higher CR-1 after 1999. We found that most prescriptions could be dis-pensed at only 1 pharmacy during the study period. In 2004, 1429 clinics had >900 prescriptions/mo dispensed externally and a CR-1 ≥0.99. They had released 75.8% of all prescriptions to be dispensed at practicing macies; 811 of these clinics had a cooperating phar-macy with a CR-1 ≥0.99.
Conclusions: In this data analysis in Taiwan, most
prescriptions from practitioners at Western medical and dental clinics could be dispensed at only 1 macy during the study period, suggesting that phar-macists’ professional autonomy and the patients’ benefit in pharmaceutical care might be compromised in Taiwan. (Clin Ther. 2006;28:1225–1230) Copyright © 2006 Excerpta Medica, Inc.
Key words: drug prescriptions, health services
re-search, national health programs, pharmacies, profes-sional autonomy, Taiwan.
INTRODUCTION
Physicians’ and pharmacists’ right to dispense prescrip-tion medicaprescrip-tions is a historical and legal issue world-wide.1–3In Taiwan, until 1997, practitioners at Western
medical and dental clinics, especially those practicing independently, prescribed medications, and the nurs-es at the clinics typically dispensed them. In 1995, National Health Insurance (NHI) was established to cover the health care costs of nearly the entire popu-lation of Taiwan (22,134,270 beneficiaries at the end of 2004).4 In 1997, to promote the dispensation of
prescription medications by practicing pharmacies,
Clinical Therapeutics/Volume 28, Number 8, 2006
August 2006 1225
Accepted for publication June 12, 2006.
doi:10.1016/j.clinthera.2006.08.005 0149-2918/06/$19.00
Printed in the USA. Reproduction in whole or part is not permitted. Copyright © 2006 Excerpta Medica, Inc.
Application of Concentration Ratios to Analyze the
Phenomenon of “Next-Door” Pharmacy in Taiwan
Tzeng-Ji Chen, DrMed
1; Li-Fang Chou, DrScPol
2; and Shinn-Jang Hwang, MD
11
Department of Family Medicine, Taipei Veterans General Hospital and National Yang-Ming University School
of Medicine, Taipei, Taiwan; and
2Department of Public Finance, National Chengchi University, Taipei, Taiwan
1225_chen_7-21 8/21/06 2:58 PM Page 1225the government implemented, stepwise from metro-politan to rural areas, a policy in which clinic staff could no longer fill prescriptions. The purpose of this policy was to promote pharmacists’ autonomy and in-crease the transparency and safety of prescribing medi-cations. To retain profit (ie, the difference between the purchase price and the price approved by the NHI) from dispensing drugs, physicians and dentists ob-tained the right to add a pharmacist to their clinics’ staff (analogous to the situation in hospitals).5To
fur-ther promote dispensing at practicing pharmacies, the NHI also modified the reimbursement schedule. The service fees charged by these on-site pharmacists were lower than those charged by external practicing macists. Practitioners who chose not to hire a phar-macist were compensated with a consultation fee for each prescription dispensed externally at a practic-ing pharmacy. The difference amounted to US $1.50/ prescription—more than one fourth of the consulta-tion fee in Taiwan.5,6
As a result, an increasing number of pharmacies come under contract with the Bureau of National Health Insurance (BNHI). Although the law in Taiwan dic-tates that pharmacies must be managed by a pharma-cist, they need not be owned by one. Thus, allegedly, some practicing physicians established ownership of pharmacies located under the same roof as their clin-ics, but with a separate entrance, allowing the clinic to collect both the consultation fee and the profit from dispensing drugs. This phenomenon, which came to be known as “next-door” pharmacy, became the subject of many disputes.6To resolve these disputes, the BNHI
and the associations of physicians and pharmacists took measures (eg, curtailing compensation for consul-tation and dispensing) that came into effect in 2006.7
The aim of the current study was to clarify the re-lationship between practicing pharmacies and clinics that resulted from contracts between pharmacies and the BNHI from 1996 to 2004.
MATERIALS AND METHODS Data Collection
Prescriptions
NHI claims data from all practicing pharmacies in Taiwan are managed on the database8of the National
Health Research Institutes (NHRI) (Miaoli, Taiwan). The NHRI periodically releases data sets to researchers; however, due to a time lag between up-to-date claims and archived data sets, in June 2006, only data from
claims filed through 2004 were available at the time of this study. Thus, we obtained complete claims data sets of all practicing pharmacies contracted with the BNHI from 1997 to 2004. These data sets did not contain data from pharmacies in hospitals or clinics.
Each record contained data related to 1 dispensed prescription, including the identification numbers of the pharmacy, prescribing clinic or hospital, prescrib-ing physician, and patient; and the date and sequence number of the clinic visit. Each field was routinely checked by the BNHI for data consistency with the prescription claims from the clinics. Some records also contained details concerning prescription medications dispensed at practicing pharmacies, but these records were not used in the present study.
Using these data, we (1) identified the source (pre-scribing clinic) of every prescription dispensed at prac-ticing pharmacies; (2) determined the NHI’s amount of prescriptions dispensed at these pharmacies; (3) ana-lyzed the concentration of business of individual phar-macies using an economic index; and (4) analyzed data from records of prescriptions originating from clinics that had a large proportion of prescriptions dispensed externally.
Health Care Facilities
We used the registry for BNHI-contracted health care facilities, an electronic data file provided annual-ly by the NHRI, to differentiate practicing clinics from hospitals (outpatient departments). Only data from facilities practicing Western medicine and dentistry, including home health care and community psychi-atric rehabilitation programs, were analyzed. In addi-tion, we directly calculated the number of visits to health care facilities in each year using the monthly claim summary for ambulatory care claims.
Statistical Analysis
For each pharmacy, we calculated the mean num-ber of prescriptions dispensed per month in each year by dividing the number of prescriptions dispensed in each year by the number of months with pharmacy claims. Prescriptions were stratified by referring source (clinic or hospital).
Operating a next-door pharmacy involves expenses for rent and personnel, and it is profitable only if a cer-tain number of prescriptions are sold; 900 prescriptions/ mo is the threshold used by the BNHI and the medical profession in Taiwan to detect next-door pharmacies.7
Clinical Therapeutics
1226 Volume 28 Number 8
Thus, pharmacies that dispensed >900 prescriptions/mo and clinics that had >900 prescriptions/mo dispensed externally at practicing pharmacies were defined as
thriving; those with ≤900 prescriptions/mo were
de-fined as stagnant.
To investigate the concentration of business at each thriving pharmacy, we adopted the firm concentration
ratio (κ)––the economic index commonly used to
mea-sure market power.9The κ was set at 1. We
calculat-ed the proportion of prescriptions that originatcalculat-ed from each pharmacy’s largest cooperating clinic in each year. The distribution of pharmacies by 1-firm concentration ratio (CR-1) was analyzed.
We calculated the distribution of thriving clinics. Similarly, to determine the proportion of prescriptions dispensed at each clinic’s largest cooperating pharma-cy in each year, we calculated the CR-1 of these clin-ics. Finally, to determine whether each clinic with a CR-1 ≥0.99 had a close business relationship with its largest cooperating pharmacy, we calculated the CR-1 of the pharmacy.
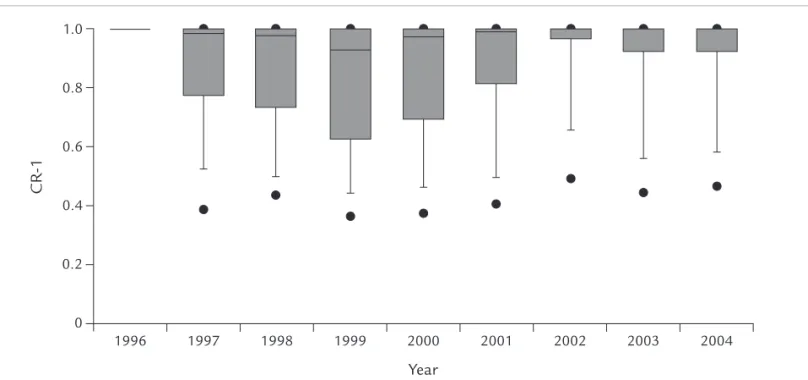
The initial calculation of data was undertaken using Perl version 5.8.7 (Perl software, http://www.perl. com). Some aggregate results were imported into an electronic database (Access 2000, Microsoft Corpora-tion, Redmond, Washington) for further processing. A graphing program (SigmaPlot version 9.0, SYSTAT Software Inc., Point Richmond, California) was used to display the distribution of CR-1 of pharmacies with a box plot, in which the boundaries of a box repre-sented the 25th and 75th percentiles; the line within
the box, the median; the lines outside the box, the 10th and 90th percentiles; and the additional dots, the 5th and 95th percentiles.
RESULTS
According to the official statistics of the BNHI, the number of practicing clinics of Western medicine in Taiwan grew from 7581 in 1995 to 8793 at the end of 2004; the number of practicing dental clinics, from 4615 to 5776; and the number of practicing pharma-cies, from 804 to 3898.4Not every facility was
estab-lished immediately after placing a contract.
Among the total 182,348,983 prescriptions pro-cessed in the current study, we were unable to identify an existing referring hospital/clinic for 193,243 (0.1%) prescriptions.
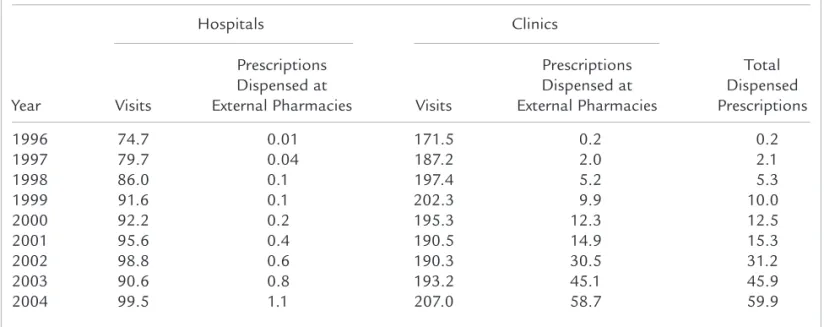
The dispensing at practicing pharmacies contracted with the BNHI in Taiwan grew rapidly in the period studied, from 226,901 prescriptions in 1996 to 59,785,039 in 2004 (Table I). Although nearly one third of ambulatory visits took place in the outpatient departments of hospitals, the majority of dispensed prescriptions at practicing pharmacies came from practicing clinics. On average, 28.3% of visits at clin-ics in 2004 resulted in 1 prescription being released and dispensed externally at a practicing pharmacy, in contrast to 1.1% of visits at hospitals.
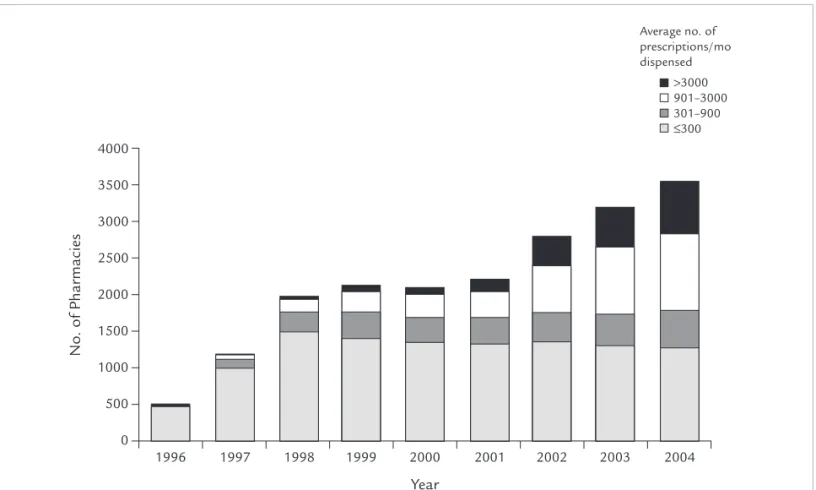
From 1997 to 2004, the number of practicing pharma-cies within the NHI grew from 481 to 3529 (Figure 1). Although the growth was attributed to the pharma-cies with thriving business, the number of pharmapharma-cies
T.-J. Chen et al.
August 2006 1227
Table I. Trend of prescriptions dispensed at practicing pharmacies. Values are expressed in millions.
Hospitals Clinics
Prescriptions Prescriptions Total
Dispensed at Dispensed at Dispensed
Year Visits External Pharmacies Visits External Pharmacies Prescriptions
1996 74.7 0.01 171.5 0.2 0.2 1997 79.7 0.04 187.2 2.0 2.1 1998 86.0 0.1 197.4 5.2 5.3 1999 91.6 0.1 202.3 9.9 10.0 2000 92.2 0.2 195.3 12.3 12.5 2001 95.6 0.4 190.5 14.9 15.3 2002 98.8 0.6 190.3 30.5 31.2 2003 90.6 0.8 193.2 45.1 45.9 2004 99.5 1.1 207.0 58.7 59.9 1225_chen_7-21 8/21/06 2:58 PM Page 1227
with stagnant business remained relatively stable (1774 [50.3%] of all BNHI-contracted pharmacies in 2004).
Of the 481 established pharmacies operating in 1996, 321 still had NHI business in 2004, of which 56 were thriving in 2004, of which 7 had a CR-1 ≥0.99 in 2004.
In pharmacies that thrived during the study period, business tended to be more concentrated after 1999, ex-cept for a relatively small variation in 2002 (Figure 2). In 2004, 77.5% (1361/1755) of thriving pharmacies had a CR-1 ≥0.90, and 59.4% (1042/1755) had a CR-1 ≥0.99.
Throughout the study period, an increasing number of clinics released their prescriptions to practicing phar-macies. Among the clinics having >900 prescriptions/ mo dispensed at external practicing pharmacies, many (1429/1655 [86.3%]) had a CR-1 ≥0.99 in 2004 (Table II). These 1429 clinics released a total of 45,299,500 prescriptions in 2004, corresponding to 75.8% of all 59,785,039 prescriptions dispensed at practicing pharmacies in that year. Among the 1429 thriving clinics with a CR-1 ≥0.99 in 2004, we found
that more than half (811) of their largest cooperating pharmacies had a CR-1 ≥0.99.
DISCUSSION
Although the physicians in South Korea took radical actions, such as general strikes, against the legislated policy to separate prescribing and dispensing prac-tices,10–12 many practicing physicians in Taiwan
seemed to circumvent the regulations by establishing ownership of a pharmacy adjacent to the clinic or hiring an on-site pharmacist. Although our study of sources of prescriptions dispensed at pharmacies in Taiwan did not directly prove the existence of next-door pharmacies, the results found that many phar-macies had a close relationship with a single clinic. The majority of prescriptions released from the clinics had to be filled at an external pharmacy. Based on the results of the present study, the policy of separating dispensing from prescribing in Taiwan did not fully succeed in promoting pharmacists’ autonomy and in-creasing the transparency and safety of prescribing.
In the present study, we found an increase in the number of practicing pharmacies within the NHI
Clinical Therapeutics 1228 Volume 28 Number 8 1000 2000 3000 0 No . of Ph a rm a cies 2004 1999 1998 1997 1996 2000 2001 2002 0 2003 Year >3000 901–3000 301–900 ≤300 4000 500 1500 2500 3500 Average no. of prescriptions/mo dispensed
Figure 1. Distribution of the pharmacies by average number of dispensed prescriptions per month.
in Taiwan. We also found the highly concentrated business of practicing pharmacies thriving after 1999. The extreme concentration of CR-1 in 2001 might have been due to the implementation of global budgeting for clinics practicing Western medi-cine in Taiwan in that year. With more constraints placed on physicians’ reimbursements, the financial
incentive of establishing a next-door pharmacy be-came greater.
Even after the implementation of the policy of sep-aration of prescribing and dispensing, the release of prescriptions from clinics to practicing pharmacies was not yet satisfactory to the society of pharmacists in Taiwan. Many clinics seemed to choose to hire an
T.-J. Chen et al. August 2006 1229 0.2 0.6 0 CR -1 2002 2001 2000 1999 1998 2003 2004 1997 1996 Year 1.0 0.4 0.8
Figure 2. Distribution of the 1-firm concentration ratios (CR-1s) among thriving pharmacies (ie, those with >900 prescriptions/mo dispensed). Solid circles indicate the 5th and 95th percentiles. The 7 pharma-cies in 1996 did not suffice for calculating the distribution.
Table II. Trend of thriving* clinics at practicing pharmacies.
Clinics with a CR-1 ≥0.99†
Clinics with a and Cooperating Pharmacy Year Total Clinics CR-1 ≥0.99† with a CR-1 ≥0.99‡
1996 9 6 6 1997 68 56 29 1998 195 152 73 1999 300 236 89 2000 349 287 127 2001 444 373 196 2002 980 871 597 2003 1396 1231 731 2004 1655 1429 811
CR-1 = 1-firm concentration ratio.
*>900 Prescriptions/mo dispensed at external pharmacies.
†Proportion of the largest dispensing pharmacy in the total released prescriptions of a clinic in 1 year.
‡Proportion of the largest prescribing clinic/hospital in the total dispensed prescriptions of a pharmacy in 1 year.
on-site pharmacist rather than release the dispensing authority to an external pharmacy. Compensation paid to physicians from the BNHI for having prescrip-tions filled externally might not equal the potential profit from selling pharmaceuticals in the clinics.
It is likely that not all thriving pharmacies are owned by physicians. On the other hand, some thriving pharma-cies with smaller CR-1s might be owned by a pharmacist or jointly owned by physicians in several neighboring clinics. Because the information about the ownership of a pharmacy is not available officially, the use of the CR-1 in this analysis was a limitation of the study.
To maintain anonymity, the NHRI database did not provide much information concerning individual health care providers, especially the addresses of the clinics. Even if the addresses of clinics and pharmacies were available, it would have been difficult to deter-mine whether a pharmacy was a next-door pharmacy, for 2 reasons: (1) proximity to a clinic is important to the practice of a pharmacy; and (2) some small com-munities can afford only 1 clinic and 1 pharmacy.
Starting January 1, 2006, the BNHI in Taiwan curtailed the prescribing bonus of a clinic and the dis-pensing bonus of a pharmacy if the clinic was thriving and both the clinic and its largest cooperating phar-macy had a CR-1 ≥0.7. The bonuses were paid out only if the managing pharmacist submitted a nota-rized affidavit indicating that he or she was the sole owner of the pharmacy.7The effect of the newer
regu-lation awaits observation.
The results of the present study seemed to show a quick adaptation by the Western medical profession in Taiwan to a new health policy. Discussions over the sep-aration of drug prescribing and dispensing should not be limited to the conflicts of interest between physicians and pharmacists. The patient’s benefit, especially the quality of pharmaceutical care, deserves foremost concern.
CONCLUSIONS
In this claims analysis in Taiwan, most prescriptions from practitioners at Western medical and dental clin-ics could be dispensed at only 1 pharmacy during the study period, suggesting that pharmacists’ profession-al autonomy and the patients’ benefit in pharmaceuti-cal care might be compromised in Taiwan.
ACKNOWLEDGMENTS
This study was supported by grant no. NSC 94-2416-H-004-026 from the National Science Council in Taiwan.
This study was based in part on data from the NHRI database provided by the BNHI, Department of Health, and managed by NHRI in Taiwan. The in-terpretation and conclusions contained herein do not represent those of the BNHI, Department of Health, or NHRI.
REFERENCES
1. Abood RR. Physician dispensing: Issues of law, legislation and social policy. Am J Law Med. 1989;14:307–352. 2. Emmerton L, Marriott J, Bessell T, et al. Pharmacists and
prescribing rights: Review of international developments.
J Pharm Pharm Sci. 2005;8:217–225.
3. Gilbert L. Dispensing doctors and prescribing pharma-cists: A South African perspective. Soc Sci Med. 1998;46: 83–95.
4. Bureau of National Health Insurance. 2004 National Health Insurance Annual Statistical Report. Taipei, Taiwan: Bureau of National Health Insurance; 2005. 5. Chou YJ, Yip WC, Lee CH, et al. Impact of separating drug
prescribing and dispensing on provider behaviour: Taiwan’s experience. Health Policy Plan. 2003;18:316–329. 6. Chen TH, Hsu MM. Disputes about the program of han-dling next-door pharmacies [in Chinese]. Taiwan Med J. 2005;48:549–550.
7. Bureau of National Health Insurance [Web site]. Avail-able at: http://www.nhi.gov.tw/information/law_detail. asp?Bulletin_ID=538. Accessed February 3, 2006. 8. National Health Research Institutes [Web site]. Available
at: http://www.nhri.org.tw/nhird/. Accessed February 3, 2006.
9. Curry B, George KD. Industrial concentration: A survey.
J Industrial Economics. 1983;31:203–255.
10. Lee EK, Malone DC. Comparison of peptic-ulcer drug use and expenditures before and after the implementation of a government policy to separate prescribing and dispens-ing practices in South Korea. Clin Ther. 2003;25:578–592. 11. Kwon S. Pharmaceutical reform and physician strikes in Korea: Separation of drug prescribing and dispensing.
Soc Sci Med. 2003;57:529–538.
12. Kim HJ, Chung W, Lee SG. Lessons from Korea’s pharma-ceutical policy reform: The separation of medical institu-tions and pharmacies for outpatient care. Health Policy. 2004;68:267–275.
Clinical Therapeutics
1230 Volume 28 Number 8
Address correspondence to: Tzeng-Ji Chen, DrMed, Department of Family
Medicine, Taipei Veterans General Hospital, No. 201, Sec. 2, Shih-Pai Road, Taipei 11217, Taiwan. E-mail: tjchen@vghtpe.gov.tw