On: 27 April 2014, At: 23:56 Publisher: Routledge
Informa Ltd Registered in England and Wales Registered Number: 1072954 Registered office: Mortimer House, 37-41 Mortimer Street, London W1T 3JH, UK
Journal of Media Economics
Publication details, including instructions for authors and subscription information: http://www.tandfonline.com/loi/hmec20
Market Competition and
Programming Diversity: A Study
on the TV Market in Taiwan
Shu-Chu Sarrina Li & Chin-Chih Chiang Published online: 17 Nov 2009.
To cite this article: Shu-Chu Sarrina Li & Chin-Chih Chiang (2001) Market Competition and Programming Diversity: A Study on the TV Market in Taiwan, Journal of Media Economics, 14:2, 105-119, DOI: 10.1207/S15327736ME1402_04
To link to this article: http://dx.doi.org/10.1207/S15327736ME1402_04
PLEASE SCROLL DOWN FOR ARTICLE
Taylor & Francis makes every effort to ensure the accuracy of all the information (the “Content”) contained in the publications on our platform. However, Taylor & Francis, our agents, and our licensors make no
representations or warranties whatsoever as to the accuracy, completeness, or suitability for any purpose of the Content. Any opinions and views
expressed in this publication are the opinions and views of the authors, and are not the views of or endorsed by Taylor & Francis. The accuracy of the Content should not be relied upon and should be independently verified with primary sources of information. Taylor and Francis shall not be liable for any losses, actions, claims, proceedings, demands, costs, expenses, damages, and other liabilities whatsoever or howsoever caused arising directly or indirectly in connection with, in relation to or arising out of the use of the Content.
This article may be used for research, teaching, and private study purposes. Any substantial or systematic reproduction, redistribution, reselling, loan, sub-licensing, systematic supply, or distribution in any form to anyone is
Market Competition and
Programming Diversity:
A Study on the TV
Market in Taiwan
Shu-Chu Sarrina Li
Institute of Communication Studies National Chiao Tung University
Chin-Chih Chiang
Doctoral Student, Graduate School of Journalism National Chenchi University
This article investigates the issue of the relation between market competition and programming diversity in Taiwan’s TV market. For more than 20 years, Taiwan’s TV market had an oligopolistic structure with 3 networks dominating the market. With the popularity of satellite TV during the 1990s, the oligopoly rapidly ended. This study examines how programming diversity was affected by the changing TV market structure in Taiwan. Programming diversity was measured by 3 methods us-ing program data from the 3 networks operatus-ing in Taiwan: vertical programmus-ing diversity, horizontal programming diversity, and prime-time programming strate-gies. The results indicate a negative relation between market competition and programming diversity. Although the market competition increased from 1986 to 1996, this study discovered that the degree of programming diversity was reduced year by year.
The relation between product innovation and market structure has long been a ma-jor concern of many media economists who think product innovation is determined by market structure. Therefore, media economists believe that to increase the rate Requests for reprints should be sent to Shu-Chu Sarrina Li, Institute of Communication Studies, Na-tional Chiao Tung University, 1001 Ta Hsueh Road, Hsinchu, Taiwan, ROC. E-mail: [email protected]
of innovation, one has to make some changes in market structure (Adams, 1993; Burnett, 1992; Davis & Walker, 1990; Peterson & Berger, 1975). However, these analysts disagree among themselves about the nature of the relation between media product innovation and market structure.
Some media economists assert there is a positive relation between oligopolistic market structures and media product innovations. In an oligopolistic market structure, a few firms control most of the market share, so there is a high degree of market concentration. These economists think that only in an oligopolistic market structure can firms have sufficient financial resources to test different products, develop new products, and pass the costs of innovation on to consumers. Thus, they hold, an oligopolistic market structure increases the rate of innovation and leads to product diversity in mass media markets (Burnett, 1992; Schumpeter, 1950).
However, other media economists see a negative relation between market concentration and product innovation. These economists argue that when a few firms dominate a market they have little incentive to innovate because what each firm strives to do is to gain the largest share of the mass market. In order to gar-ner the largest share of a market, each firm will try to manufacture products that please as many consumers as possible while offending the fewest possible. This process leads to homogeneity because the oligopolistic market structure reduces the rate of innovation, making media products less diversified. This is the oppo-site of a market with open competition between many firms. Such a market is broken up into many segments, so gaining the largest share is impossible. Under these conditions, the best strategy is to differentiate one’s products from others in order to cater to a specific niche. Therefore, a market with many competitors induces innovation and increases product diversity in the mass media market (Coser, Kadushin, & Powell, 1982; Litman, 1979; Peterson & Berger, 1975; Rothenbuhler & Dimmick, 1982; Ryan, 1985).
The dispute about the relation between market concentration and product in-novation is not yet settled by empirical data because research has not yet come up with any conclusive findings. Some studies indicate a negative relation be-tween market concentration and product innovation (Atwater, 1984; Bae, 1999; Barrett, 1995; Chan-Olmsted, 1996; De Jong & Bates, 1991; Dominick & Pearce, 1976; Everett & Everett, 1989; Grant, 1994; Hellman & Soramaki, 1994; Johnson & Wanta, 1993; Lacy, 1988; Peterson & Berger, 1975; Powers, Kristjansdottir, & Sutton, 1994; Wakshlag & Adams, 1985), although other studies show the contrary (Burnett, 1992; Hellman & Soramaki, 1985; Hvitfelt, 1994; Lacy, 1988; Lin, 1995a; McCombs, 1988). The main purpose of this study is to examine the relation between market competition and programming diver-sity in Taiwan’s TV market. Taiwan’s TV market was under rigid regulations for more than 20 years, with only three networks dominating the market. But re-cently, with the booming Asia—Pacific satellite TV industry, the situation has
been under great transformation. The earliest change was initiated by the open-ing of five Star TV channels in Asia. Star TV, based in Hong Kong, was initially a joint venture of Hong Kong’s Hutchison Whampoa conglomerate and its chairman, Ka-shing Li, but it was then sold to Rupert Murdoch’s News Corpora-tion (Chan, 1994). Star TV launched its free TV service in October 1991, with one channel broadcasting in Mandarin Chinese. At that time, many people in Taiwan had long been unsatisfied with the programs provided by the three do-mestic TV stations, so Star TV’s Chinese service became very popular on the is-land. However, the emergence of Star TV did not bring much competition into Taiwan’s domestic TV market because cable TV was not authorized in Taiwan until 1993.
The fiercest competition came after authorization, when satellite signals could directly enter homes by way of cable. In addition to Star TV, many other Chinese satellite channels targeted the Taiwan television market. These satellite TV chan-nels not only ended the domestic TV oligopoly, but also changed the legal environ-ment of Taiwan’s TV industry, which led to deregulation (Li, 1995, 1996). The increasing market competition can be seen by the decreasing audience shares of the three TV networks year by year after 1993 (United Advertising rating data, 1999).1
The changing environment of Taiwan’s TV market poses a good opportunity for researchers to examine the relation between market competition and program-ming diversity. This study investigates this issue.
LITERATURE REVIEW Market Competition and Media Diversity
The majority of the competition–diversity studies point to a positive relation be-tween mass media market competition and product diversity. The empirical studies have been applied to various media industries.
In the U.S. television industry, Dominick and Pearce (1976) examined the di-versity of network prime-time programming from 1953 to 1974 and found a pos-itive relation existing between market competition and programming diversity. Litman (1979) took a specific event in 1976, which suddenly increased the de-gree of competition among the three U.S. networks, to examine the competition–di-versity relation. The author found that both vertical and horizontal dicompetition–di-versity dramatically increased after 1976. Atwater (1984) discovered that a greater
1According to data provided by United Advertising, a rating company in Taiwan, the average
audi-ence share across the 7 years decreased by about 10%. As for the audiaudi-ence shares for the satellite—cable channels in Taiwan, the complete set of data is not available.
number of stations in a market were associated with an increase in the number of unique news stories, as well as with more time devoted to the same. Wakshlag and Adams (1985) investigated the impact of the Prime Time Access Rule on U.S. program variety from 1950 to 1982. Their study found that the regulation greatly reduced the degree of market competition in the TV industry, which in turn led to a gradual decline of program variety in network prime-time program-ming. Hellman and Soramak (1994) found that the rate of concentration in the U.S. video industry reached a peak in 1982, declined by 1986, then increased by 1990. Their data also show that competition was positively associated with the range of video content and that more choices were available for consumers during the years of a lower concentration rate.
In terms of competition–diversity studies outside the United States, Powers et al. (1994) investigated the effect of competition on Danish TV news and found that competition led not only to a greater degree of diversity in news content but also to improvements in the content of state television. Li (1999) analyzed diver-sity among the prime-time series of the three TV stations in Taiwan from 1990 to 1997. This study discovered that when the degree of market competition in-creased, the average numbers of days for a prime-time series dein-creased, the di-versity of vertical programming was significantly enhanced, and the number of actors greatly increased.
The rapid growth of the U.S. cable TV industry in the late 1980s was expected to promote diversity, and the competition–diversity relation was tested in the cable industry. For example, Chan-Olmsted (1996) found that the children’s cable chan-nels had greatly increased the degree of competition in commercial children’s tele-vision in the United States, which in turn led to a greater number of choices available for young American audiences. Barrett (1999) discovered that the exis-tence of direct cable competition in one city resulted in more local programming, better customer services, and lower prices. Bae’s (1999) study showed that the au-dience benefited from the increasing competition existing in the national all-news cable market because the product was more differentiated after competition. De Jong and Bates (1991) examined the relation between deregulation and cable pro-gram diversity and found that deregulation resulted in more channels available to the public, which in turn led to more programming diversity in the cable industry. Grant (1994) also found that the number of cable channels was positively associated with the diversity of programming.
In the popular music industry, Peterson and Berger (1975) studied competi-tion–diversity from 1948 to1973 and found that when market competition was in-tense, the number of hits was highest, the average weeks of each song on the hits list were shortest, and the diversity of lyrical themes was greatest. A later study by Rothenbuhler and Dimmick (1982) also examined the U.S. popular music indus-try, this time from 1974 to 1980. Their findings confirmed those of Peterson and Berger, discovering that years of decreased market competition were associated
with fewer producers and a reduced number of hit songs. In the radio industry, Rogers and Woodbury (1996) found that the number of formats in the United States was positively correlated with the number of radio stations.
The competition–diversity relation was also studied in the U.S. newspaper in-dustry because opinion diversity is considered critical in a democratic society. Most newspaper studies found market competition had a positive effect on content diversity (Everett & Everett, 1989; Johnson & Wanta, 1993; Lacy, 1987, 1988, 1989).
Market Concentration and Media Diversity
Though many research findings showed that market competition had a positive impact on product diversity, some studies discovered just the opposite (Burnett, 1992; Lin, 1995a, 1995b; Liu, 1997). For example, Burnett (1992) discovered that the market concentration of the U.S. record industry from 1981 to 1989 hit a historical high point, but diversity in popular music also increased substantially, so the findings of the study suggest a negative relation between market competi-tion and media diversity. Hellman and Soramaki (1985) compared market con-centration of the videocassette industry in the United States and Britain and discovered that a more concentrated market was associated with a better quality of videos, suggesting market competition had a negative effect on product con-tent. Recent studies of TV programming have also shown a negative relation be-tween market competition and product diversity. For example, Lin (1995a) analyzed a 10-year period of prime-time programs from 1980 to 1990. Compared to the 1970s, the 1980s presented great turbulence for the three TV networks because many alternative video media such as cable TV and VCRs were available. This study showed a decrease in programming diversity in the 1980s. Liu (1997) analyzed the prime-time programs of Taiwan’s three TV sta-tions from 1990 to 1996. The author discovered that programming diversity gradually reduced from 1990 to 1996. Another study investigated programming strategies employed by the three networks in the United States during the 1980s (Lin, 1995b). This research showed that with increased external competition, the networks tended to adopt more conservative strategies for programming, which in turn reduced diversity.
Studies on news content have also shown that competition has either a negative effect or no impact on news diversity. For example, Lacy (1988) studied intermedia competition including TV, cable TV, and radio on daily newspaper content and found that competition from these media did not have an observable effect on newspaper content. McCombs (1988) found that the presence of newspa-per competition in the same geographic market had no impact on content diversity. Hvitfelt (1994) examined the news content of Swedish television before and after
competition and found that TV news became more commercialized and contained less information after competition.
PURPOSE OF THE STUDY
This study examines the relation between market competition and programming diversity among Taiwan’s three TV networks. The authors believe that the com-petition–diversity relation is an important policy issue. From a policy perspec-tive, promoting diversity in the mass media performs two functions: (a) It increases consumer choices, and (b) it serves public interest by giving greater at-tention and access to various political groups and minority views (McQuail, 1992). Though most studies have shown a positive link between competition and diversity, some have indicated the opposite. This study investigates this issue and clarifies the competition–diversity relation.
METHODOLOGY Major Variables
The independent variable of the study is market competition. As stated previ-ously, 1991 was one of the critical points when Taiwan’s TV oligopoly ended. Another critical point was 1993 when cable TV was legalized. That same year, another popular Chinese satellite channel, TVBS, was launched. TVBS is a joint venture of TVB, the major TV station in Hong Kong, and ERA, a communica-tions company in Taiwan. TVB now has the largest stock of Chinese programs in the world (Li, 1996). Therefore, with the offering of Chinese programs from TVB, TVBS became very competitive in Taiwan. Using the years of 1991 and 1993 as the two critical points at which the market competition varied greatly in Taiwan, this study investigated the degree of programming diversity before and after these two watershed years.
The dependent variable, programming diversity, was measured by three meth-ods. The first method was to analyze vertical diversity of programming. According to Litman (1979), vertical diversity of programming is the degree of concentration of programming into a few types of programs. This study used this definition to measure vertical diversity by counting the number of different programs types shown by the three networks. The Hirschmann—Herfindahl Index (HHI) of con-centration was used to measure vertical programming diversity.
The second method of measuring programming diversity was horizontal diver-sity. According to Litman (1979), vertical diversity only gives information about how many different programs were provided in 1 year, but it does not show how
many options were available to the viewers in any specific time slot. Horizontal di-versity gives this information, and is thus helpful for obtaining a more accurate pic-ture of programming diversity. Using a half-hour as one unit, this study analyzed horizontal diversity of the prime-time TV programs of the three networks in Taiwan. The third method of measuring diversity was to study the strategies adopted by the three networks during the prime-time schedules. According to studies by Lin (1995b) and Tiedge and Ksobiech (1987), when there were three networks com-peting against one another, four different programming scenarios were antici-pated. The first is pure counterprogramming (PC), where one network provides a program distinctive from the other two networks. Second, blunting a counter (BC) occurs when one network duplicates one of the other two networks, when the other two are giving different programs. Third, countering a blunt (CB) happens when one network gives a different program from that of the other two networks, but those two offer the same program type. Finally pure blunting (PB) is found where a network duplicates the other two networks, when those two are offering the same type of program. According to Lin (1995b), the hierarchy of the expected payoffs of the four strategies was as follows: CB > PB > PC > BC. Among the four strate-gies, PC had the greatest programming diversity but also the greatest risks. In contrast, PB had the least programming diversity, but was the safest. An increase in the use of PC strategy suggests an increase in programming diversity, but an increase in the use of PB means a reduction.
Sampling of Programming Data
Using the 2 years of 1991 and 1993 as base years, this study selected the period from 1991 to 1996 to examine program diversity. As for the years before 1991, the year 1986 was randomly chosen for investigation. Therefore, a total of 7 years were included in the study sample. For each year, the 2nd week of each month was ran-domly selected as the sample. In case the selected week had a special holiday such as the lunar New Year, the 3rd week would be used. (This is because the networks in Taiwan usually change their typical schedules and present many special programs during holidays.) With 12 weeks analyzed in each of the 7 years, 84 weeks of each of the three networks’ programs were included. Using a program as one unit of analysis, the final sample of the study included 44,472 programs.
According to Litman, Hasegawa, Shrikhande, and Barbatsis (1994), the selec-tion of program categories for TV content analysis greatly impacts the validity of the coding, so it was important to choose the categories that accurately represent the programs shown. In Lin’s study (1995b), 26 categories of TV programming were utilized. Because some of the program types in Taiwan are different from those in the United States, this study referred to both Lin’s (1995b) work on the United States and Liu’s (1996) research conducted in Taiwan. From these two
sources, we developed 19 program categories for TV content analysis of the three networks’ programs. The 19 program categories were: (1) news reports, (2) news magazines, (3) talk or discussion, (4) educational programs, (5) women’s pro-grams, (6) cultural or artistic, (7) sports, (8) children’s (9) cartoons, (10) movies, (11) English series, (12) variety, (13) contests, (14) Mandarin series, (15) Taiwan-ese series,2(16) dramas, (17) religious, (18) travel, and (19) others.
Prime time in Taiwan begins at 19:00 (7:00 p.m.) and ends at 23:00 (11:00 p.m.) with the 20:00 to 21:00 (8:00 p.m.–9:00 p.m.) period holding the most view-ers. This hour has the greatest competition among the networks and the most ex-pensive ad prices. During this slot, the three networks have offered the same type of programming, namely various Mandarin series, and have not changed their strategy for more than 20 years. To better understand how the three networks in Taiwan compete with one another in this popular hour, these Mandarin series were further classified into 12 categories: (1) modern comedy, (2) modern love story, (3) country story, (4) ancient story, (5) late Chi dynasty story, (6) martial arts story, (7) history, (8) ancient comedy, (9) crime or police story, (10) school story, (11) imported series such as Japanese series, and (12) others.
Intercoder Reliability on Program Categories
Two sets of program categories were employed in this study. One had 19 program categories (for the overall programming of the three networks), and the other 12 program categories (representing the Mandarin hour). One research assistant coded the two sets of program categories. To assure and double-check coding reliability, another research assistant completed 10% of the coding (Wimmer & Dominick, 2000). That is, of the 44,472 programs in the final sample of the study, the second research assistant coded 10% of the sample (4,448 programs) separately. Scott’s pi index (1955) was calculated to check intercoder reliability. The pi index varied from .79 to 1.00 with a mean of .93.
FINDINGS AND DISCUSSION Amount of Airtime and Number of Programs
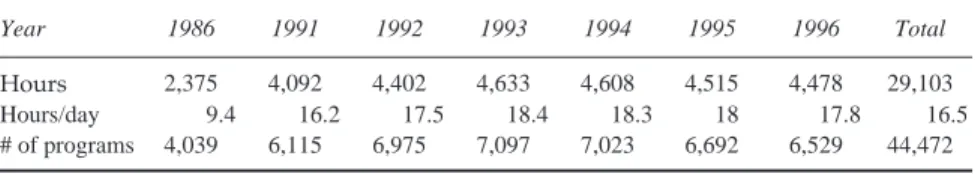
The amount of airtime refers to how many hours the three networks used to show programs in 1 day for the whole year. One way to expand or promote program
di-2Taiwanese series differ from Mandarin series in several important ways. The Taiwanese series (a)
are scheduled at either 12:30 (12:30 p.m.) or 18:30 (6:30 p.m.) on weekdays, (b) are half-hour shows, (c) use the Taiwanese language, (d) use very different actors to those in Mandarin series, and (e) over-whelmingly (about 90%) fall into the country story type in Mandarin series.
versity is by increasing the amount of program time. This study measured the amount of airtime in each of the 7 years and then compared differences among years. Table 1 contains this information, as well as the number of programs broad-cast each year. The data from Table 1 show that the hours and number of programs substantially increased from 1986 to 1991. However, from 1991 to 1996 there was less variation of broadcast hours by the networks. Prior to 1991, the three networks had very limited time for programs, but when competition increased, the networks increased their broadcasting hours.
Table 1 also shows that the number of programs aired greatly increased after 1991, but little variation was found from 1991 to 1996. Therefore, as the market competition increased, the amount of airtime and the number of programs aired rose substantially as well. However, an increase in the number of programs aired and the amount of airtime are not necessarily correlated with an increase in pro-gramming diversity.
Vertical Diversity in Programming
Vertical diversity in programming shows the distribution of programs into 19 pro-gram categories in 1 year. When propro-grams are evenly distributed into the 19 catego-ries, there is a high degree of vertical diversity; otherwise vertical diversity is low. As the programs in 1 year were more evenly distributed into the 19 categories, the HHI was lower, so the vertical diversity was higher.
The calculations on vertical diversity were as follows: 1986 (HHI = .097), 1991 (.095), 1992 (.093), 1993 (.092), 1994 (.096), 1995 (.100), and 1996 (.104). As stated before, there were two crucial moments of intense market competition in Taiwan: October 1991, when Star TV inaugurated its Chinese service, and Sep-tember 1993, when TVBS began operation. However, in terms of degree, the com-petition after 1993 was much keener than that after 1991. Vertical programming diversity increased after the market instilled minor competition. However, when the competition was too strong, it did not raise the degree of vertical diversity, but rather reduced it.
TABLE 1
Amount of Broadcast Hours and Programs For Taiwan Networks
Year 1986 1991 1992 1993 1994 1995 1996 Total
Hours 2,375 4,092 4,402 4,633 4,608 4,515 4,478 29,103
Hours/day 9.4 16.2 17.5 18.4 18.3 18 17.8 16.5
# of programs 4,039 6,115 6,975 7,097 7,023 6,692 6,529 44,472
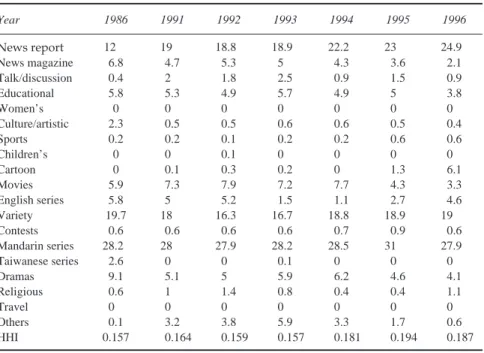
To understand vertical programming diversity, it is necessary to look at the de-gree of programming diversity in prime time. Examining prime-time (19:00–23:00 or 7:00 p.m.–11:00 pm) programming diversity may be the best in-dicator of programming diversity among the three networks in Taiwan. The HHI was again applied to calculate the degree of vertical diversity in each of the 7 years. Table 2 reports this information.
Vertical programming diversity in prime time increased after 1991. However, after 1993,vertical diversity fell substantially. Again, the most competitive time slot among the three networks in Taiwan is 20:00 to 21:00 or 8:00 p.m. to 9:00 p.m. on Monday to Friday, during which the three networks present Mandarin series. The HHI was used to measure the vertical diversity of this hour. Table 3 contains this information.
Table 3 demonstrates that the vertical diversity of this time slot tended to de-crease as market competition intensified. The overall pattern of vertical program-ming diversity for the 8 o’clock time slot decreased from 1986 to 1996. But after 1993, there was a sudden drop of the index, signaling a substantial increase in ver-tical diversity. When the oligopoly market structure disintegrated, the three net-works did become more innovative in their programming, but only for a short period of time, and then immediately went back to their usual approach. The HHI
TABLE 2
Vertical Programming Diversity for Prime Time (%)
Year 1986 1991 1992 1993 1994 1995 1996 News report 12 19 18.8 18.9 22.2 23 24.9 News magazine 6.8 4.7 5.3 5 4.3 3.6 2.1 Talk/discussion 0.4 2 1.8 2.5 0.9 1.5 0.9 Educational 5.8 5.3 4.9 5.7 4.9 5 3.8 Women’s 0 0 0 0 0 0 0 Culture/artistic 2.3 0.5 0.5 0.6 0.6 0.5 0.4 Sports 0.2 0.2 0.1 0.2 0.2 0.6 0.6 Children’s 0 0 0.1 0 0 0 0 Cartoon 0 0.1 0.3 0.2 0 1.3 6.1 Movies 5.9 7.3 7.9 7.2 7.7 4.3 3.3 English series 5.8 5 5.2 1.5 1.1 2.7 4.6 Variety 19.7 18 16.3 16.7 18.8 18.9 19 Contests 0.6 0.6 0.6 0.6 0.7 0.9 0.6 Mandarin series 28.2 28 27.9 28.2 28.5 31 27.9 Taiwanese series 2.6 0 0 0.1 0 0 0 Dramas 9.1 5.1 5 5.9 6.2 4.6 4.1 Religious 0.6 1 1.4 0.8 0.4 0.4 1.1 Travel 0 0 0 0 0 0 0 Others 0.1 3.2 3.8 5.9 3.3 1.7 0.6 HHI 0.157 0.164 0.159 0.157 0.181 0.194 0.187
scores after 1994 were much higher than before, so the three networks not only shrank to their traditional approach, but also adopted a more conservative way to handle this most competitive time slot.
Horizontal Diversity in Programming
Using 30 min as one unit of analysis, this study constructed an index of horizontal diversity for the time slots of prime time. A score of horizontal diversity was calcu-lated as follows: First, the number of different program types for each half hour was counted, so 3 means perfect diversity and 1 perfect imitation. Second, the number of prime-time slots in 1 day was divided by the number of prime-time half hours to obtain an average score of horizontal diversity. Table 4 summarizes the data of hor-izontal diversity for the prime-time programs in each of the 7 years.
Horizontal diversity decreased from 1986 to 1996. Viewers had fewer options during prime time. This data suggests that market competition did not bring higher horizontal diversity to the programming of three networks, but instead as the mar-ket became more competitive, viewers had fewer choices in the TV menu.
Prime-Time Strategies
Using a half hour as one unit, TV prime time in Taiwan was divided into eight units. For each unit, this study coded the strategy the networks were using. With each of the 7 years, this study came up with the number of each of the four
strat-TABLE 3
Vertical Programming Diversity During the 8:00–9:00 p.m. Time Period (%)
Program/Year 1986 1991 1992 1993 1994 1995 1996
Modern comedy 8.5 34.4 10.6 3.3 5.6 3.9 0
Modern love 26.1 8.9 20 14.4 3.3 9.4 11.7
Country story 6.1 8.3 27.8 0 10 42.2 49.2
Ancient story 9.1 7.2 17.8 38.9 26.7 27.8 19.6
Late Chi Dynasty 1.8 2.8 11.1 13.9 2.8 0 0
Martial arts 9.1 8.9 4.4 2.8 30.6 6.7 10.6 History 25.5 13.3 8.3 8.3 5.6 4.4 9 Ancient comedy 0 12.8 0 10 0 0 0 Crime 2.4 3.3 0 5.6 5.6 0 0 School 0 0 0 0 2.2 5.6 0 Imported series 0 0 0 2.8 7.8 0 0 Others 11.5 0 0 0 0 0 0 H I 0.175 0.182 0.181 0.214 0.193 0.275 0.315
egies employed, then using these numbers, a Pearson product–moment correla-tion was applied to measure the relacorrela-tion between the use of the four strategies and the audience share over the 7 years. The Taiwanese networks’ audience shares were provided by a research company in Taiwan (United Advertising’s rating data, 1999). Table 5 summarizes the results of the Pearson product–moment correlation.
Two of the four strategies were significantly correlated with the audience shares. The two strategies were PC, which induced the greatest diversity into pro-gramming, and PB, which had the least. The PC strategy had a positive relation with audience shares, indicating that as the audience shares decreased from 1986 to 1996, the three networks were less likely to use PC. As the market became more competitive, the networks were more conservative, so competition led to less pro-gramming diversity. Another significant relation shown was the relation between the PB strategy and audience shares. PB was negatively correlated with audience shares, indicating that with the decreasing audience shares from 1986 to 1996, the networks were more likely to use PB. Again, the PB strategy had the least diversity for programming, therefore, this negative relation between the use of PB and audi-ence shares again confirmed that market competition did not bring diversity into programming but, rather, reduced it.
CONCLUSIONS
This study found a negative relation between market competition and program-ming diversity. With the market competition increasing from 1986 to 1996, the data show that the degree of programming diversity was reduced year by year.
TABLE 4
Horizontal Diversity for Prime Time
Year 1986 1991 1992 1993 1994 1995 1996
Options per half-hour 2.13 2.12 2.07 1.97 1.83 1.80 1.82
TABLE 5
Relationships Between Prime-Time Strategies and Audience Shares
Strategy
PC BC CB PB
No. of strategies 1570 1053 355 1726
Audience shares (r) .8700* .1786 –.6926 –.9014*
*p < .01.
Though this study found that with increasing competition the three networks would sometimes become more innovative in programming, this situation was rare and lasted only a short time. Most of the time, the three networks became more conservative and duplicated one another’s programs, so the increasing market competition during the 1990s witnessed decreasing programming diver-sity in Taiwan’s three networks.
This finding contradicts most of the competition–diversity studies, but is con-gruent with Lin’s study (1995a). Lin’s explanations for the negative competi-tion–diversity relation found in the United States apply to Taiwan. When encountering drastic competition during the 1990s, the three networks in Taiwan, rather than experimenting with more program formats to maintain their audiences, appeared to have instead gone back to the basics, leaving highly formatted pro-grams to cable TV. The three networks did not try to match the depth of program-ming provided by theme channels. Instead, the networks offered types of programs with which they had a proven record of success. Furthermore, the networks were cautious with respect to program input costs. Experimenting with new program formats usually costs more money and carries some risks, so the networks became more conservative in the production of programming under intense market compe-tition. The networks tried to produce programs that had previously been proven successful and popular. The preferred strategy was to duplicate program types that had succeeded in the past, explaining why the programming diversity of Taiwan’s three networks decreased in the 1990s.
From the findings of the study, it may not be so beneficial for consumers to have an openly competitive market because fewer programming options may be-come available with increasing market competition. However, it should be noted that this study only investigated the diversity of the three networks’ programming. It may be that if all available programs, including those from satellite–cable TV stations, are taken into consideration, the overall programming diversity may have increased greatly after many competitors entered the market. This topic would be an interesting field for further research. Although this study found a negative rela-tion between market competirela-tion and programming diversity of Taiwan’s three TV networks, it would be premature to conclude that competition leads to less pro-gramming diversity in a market because this study did not take all the market play-ers into consideration.
ACKNOWLEDGMENTS
This study was partially supported by the National Science Council of Taiwan. The authors thank the two anonymous reviewers for their useful suggestions on improving the earlier version of this article.
An earlier version of this article was presented at the 1998 annual meeting of the International Communication Association, Jerusalem, Israel.
REFERENCES
Adams, W. J. (1993). Program scheduling strategies and their relationship to new program renewal rates and rating changes. Journal of Broadcasting & Electronic Media, 37, 465–474.
Atwater, T. (1984). Product differentiation in local TV news. Journalism Quarterly, 61, 757–762. Bae, H. S. (1999). Product differentiation in cable programming: The case in the cable national all-news
networks. Journal of Media Economics, 12, 265–277.
Barrett, M. (1995). Direct competition in cable television delivery: A case study of Paragould, Arkansas.
Journal of Media Economics, 8(3), 77–93.
Burnett, R. (1992). The implications of ownership changes on concentration and diversity in the phonogram industry. Communication Research, 19, 749–769.
Chan, J. M. (1994). National responses and accessibility to Star TV in Asia. Journal of Communication,
44(3), 112–131.
Chan-Olmsted, S. M. (1996). From Sesame Street to Wall Street: An analysis of market competition in commercial children’s television. Journal of Broadcasting & Electronic Media, 40(1), 30–44. Coser, L., Kadushin, C., & Powell, W. (1982). Books: The culture and commerce of publishing.
Chi-cago: University of Chicago Press.
Davis, D. M., & Walker, J. R. (1990). Countering the new media: The resurgence of share maintenance in primetime network television. Journal of Broadcasting & Electronic Media, 34, 487–493. De Jong, A. S., & Bates, B. J. (1991). Channel diversity in cable television. Journal of Broadcasting &
Electronic Media, 35, 159–166.
Dominick, J. R., & Pearce, M. (1976). Trends in network prime-time programming. Journal of
Commu-nication, 26(1), 70–80.
Everett, S. C., & Everett, S. E. (1989). How readers and advertisers benefit from local newspaper com-petition. Journalism Quarterly, 66, 76–79.
Grant, A. E.(1994). The promise fulfilled? An empirical analysis of program diversity on television.
Journal of Media Economics, 7(1), 51–64.
Hellman, H., & Soramaki, M. (1985). Economic concentration in the videocassette industry: A cultural comparison. Journal of Communication, 35(3), 122–134.
Hellman, H., & Soramaki, M. (1994). Competition and content in the U.S. video market. Journal of
Me-dia Economics, 7(1), 29–49
Hvitfelt, H. (1994). The commercialization of the evening news: Changes in narrative technique in Swedish TV news. The Nordicom Review of Mass Communication Research, 9(2), 33–41. Johnson, T. J., & Wanta, W. (1993). Newspaper competition and message diversity in urban market.
Mass Communication Review, 20(3/4), 136–146.
Lacy, S. (1987). The effects of intracity competition on daily newspaper content. Journalism Quarterly,
64, 281–290.
Lacy, S. (1988). The impact of intercity competition on daily newspaper content. Journalism Quarterly,
65, 399–406.
Lacy, S. (1989). A model of demand for news: Impact of competition on newspaper content. Journalism
Quarterly, 66, 40–48, 128.
Li, S. S. (1995). Satellite TV: Programming & advertising. Public Opinion Research Quarterly, 193(2), 45–67.
Li, S. S. (1996). Upgrading cable TV industry and its relation with regulations and government policies.
Journal of Radio & Television Studies, 2(4), 25–44.
Li, S. S. (1999). Market competition and media performance: Examining primetime series in Taiwan.
Asian Journal of Communication, 9(2), 1–16.
Lin, C. A. (1995a). Diversity of network prime-time program formats during the 1980s. Journal of
Me-dia Economics, 8(4), 17–28.
Lin, C. A. (1995b). Network prime-time programming strategies in the 1980s. Journal of Broadcasting
& Electronic Media, 39, 482–495.
Litman, B. (1979). The television networks, competition and program diversity. Journal of
Broadcast-ing, 23, 393–409.
Litman, B., Hasegawa, K., Shrikhande, S., & Barbatsis, G. (1994). Measuring diversity in U. S. televi-sion programming, Studies in Broadcasting, 30(3), 131–153.
Liu, C. C. (1996). The cycles of program types and patterns: A study on TV programming in Taiwan. Pa-per presented at the meeting of Communication Ecology, National Chung Cheng University, Chia Yi, Taiwan, ROC.
Liu, Y. L. (1997). Multiple TV channels and their audiences. Taipei, Taiwan: Shyr-Ying.
McCombs, M. (1988). Effect of monopoly in Cleveland on diversity of newspaper content. Journalism
Quarterly, 65, 740–744.
McQuail, D. (1992). Media performance: Mass communication and the public interest. Newbury Park, CA: Sage.
Peterson, R. A., & Berger, D. G. (1975). Cycles in symbol production: The case of popular music.
Amer-ican Sociological Review, 40(1), 158–173.
Powers, A., Kristjansdottir, H., & Sutton, H. (1994). Competition in Danish television news. Journal of
Media Economics, 7(4), 21–30.
Rogers, R. P., & Woodbury, J. R. (1996). Market structure, program diversity, and radio audience size.
Contemporary Economic Policy, 14(1), 81–91.
Rothenbuhler, E. W., & Dimmick, J. W. (1982). Popular music: Concentration and diversity in the in-dustry, 1974–1980. Journal of Communication, 32(4), 143–149.
Ryan, J. (1985). The production of culture in the music industry. New York: University Press of Amer-ica.
Schumpeter, J. (1950). Capitalism, socialism and democracy. New York: Harper & Row.
Scott, W. A. (1955). Reliability of content analysis: The case of nominal scale coding. Public Opinion
Quarterly, 19, 321–325.
Tiedge, J. T., & Ksobiech, K. J. (1987). Counterprogramming primetime network television. Journal of
Broadcasting & Electronic Media, 31(1), 41–55.
Wakshlag, J., & Adams, W. J. (1985). Trends in program variety and the Prime Time Access Rule.
Jour-nal of Broadcasting & Electronic Media, 29, 23–34.
Wimmer, R. D., & Dominick, J. R. (2000). Mass media research: An introduction. Belmont, CA: Wadsworth.