行政院國家科學委員會專題研究計畫 成果報告
系統層級之多核心嵌入式系統發展與驗證環境--子計畫
三:多核心嵌入式系統效能與耗能分析監測與改善(2/2)
研究成果報告(完整版)
計 畫 類 別 : 整合型 計 畫 編 號 : NSC 98-2220-E-009-013- 執 行 期 間 : 98 年 08 月 01 日至 99 年 09 月 30 日 執 行 單 位 : 國立交通大學資訊工程學系(所) 計 畫 主 持 人 : 曹孝櫟 計畫參與人員: 碩士班研究生-兼任助理人員:楊弘偉 碩士班研究生-兼任助理人員:張安順 博士班研究生-兼任助理人員:陳建臻 博士班研究生-兼任助理人員:黃承威 報 告 附 件 : 國外研究心得報告 處 理 方 式 : 本計畫可公開查詢中 華 民 國 100 年 01 月 03 日
Table of Contents
Table of Contents ... I 摘要... II Abstract ... II
1. Introduction ... 1
2. Design and Implementation of SEProf ... 2
2.1. Power Table Association and Power Configuration Setting ... 4
2.2. Energy Estimation ... 5
2.3. Data Structures ... 8
3. Case Study: ARM11 MPCore Processor ... 10
3.1. Experimental Environment ... 10 3.2. Experimental Results ... 10 3.2.1. VFS Experiment... 11 3.2.2. DVS Experiment ... 13 4. Conclusions ... 16 References ... 16 Project Self-Assessment... 17
摘要
近年來隨著嵌入式系統晶片功能越益強大,嵌入式系統晶片也漸漸朝向複雜之多核心設計以提升 效能、降低耗能與成本。然而傳統多核心嵌入式系統晶片設計方法及工具多半針對已完成之系統晶片 進行效能與耗能的評估,對於設計初期或設計的過程中所能得到的效能與耗能參數所知有限,也無法 有效的在設計中期或初期,偵測出多核心嵌入式系統晶片可能遭遇的軟硬體效能與耗能問題。因此本 子計畫的主要目的在於設計多核心嵌入式系統晶片之效能與耗能分析與監測軟硬體擴充模組以及工具, 以協助多核心嵌入式系統晶片與軟體設計者,事先掌握多核心嵌入式系統晶片硬體與軟體的效能與耗 能特性,進而在軟、硬體設計層面加以改進。 本子計畫規劃以兩年時間研究多核心嵌入式系統晶片之效能與耗能分析、監測與提升技術,計畫 第一年我們提出並實作完成了一種以硬體協助且適用於多核心嵌入式系統的效能與耗能評估工具 REALprof,其提供程式執行時期硬體事件的監控,並藉此推算出元件耗能,其可避免軟體取樣 (Sampling)所造成的額外負擔,以便能呈現系統原始的行為與特性。在第二年中,考量耗電管理機制日 益普及,本子計畫實作出一套高階的軟體耗能評估工具 SEProf,它提供多執行緒軟體執行於多核心系 統的耗能評估,並可以依據系統的耗電管理狀態調整耗能評估,目前 SEProf 實作於 ARM11 MPCore 處理器平台上並搭配 Linux 2.6.19,實驗結果顯示此工具能夠提供高精準度且低負擔之耗能評估結果。Abstract
Multi-core embedded systems and system on chips (SoCs) which achieve a higher performance and a better cost- and energy-efficiency than single-core embedded systems become more and more popular recently. Unfortunately, conventional approaches for optimizing performance and energy consumption of multi-core SoCs rely on fine tuning after the hardware (H/W) and software (S/W) are completely developed. It is very difficult for system and software engineers to identify potential H/W and S/W performance and power consumption problems while the system is being developed.
In this project, performance and power consumption profiling and monitoring hardware and software extensions and tools for multi-core embedded systems and SoCs are proposed. The tools closely work together with the proposed performance and energy profiling hardware and software components which provide the performance and power consumption monitoring and profiling of multi-core SoCs, and facilitate system and software designers to diagnose performance and power consumption problems and bottlenecks while the system is being developed. In the first year, we propose and realize a hardware-assisted performance and energy evaluation tool, called REALprof, for a multi-core embedded system. It provides hardware monitor for runtime programs, and uses these monitor information to estimate the system energy consumption without introducing extra software sampling overhead. In the second year, since power management has become common in embedded systems, this project presents a high-level energy profiling tool, called SEProf, that estimates the energy consumption of an multi-core embedded system running multi-thread software and an operating system (OS) that supports power management functions. This project implements the proposed SEProf in Linux 2.6.19 and evaluates its performance on an ARM11 MPCore processor. Experimental results demonstrate that the proposed tool can provide accurate energy profiling results with a low profiling overhead.
1. Introduction
Energy efficiency has become one of the most important issues in the design of multi-core embedded systems, especially for battery-operated devices such as mobile phones. To evaluate the energy efficiency of an embedded system, accurate energy profiling tools are required. Previous studies on the energy profiling of embedded software adopt measurement-based and model-based approaches. Measurement-based approaches, such as PowerScope [3], directly measure the power consumption of an embedded system using an oscilloscope or a digital multi-meter, and profiling software runs on the target system to monitor system activities. This approach analyzes the energy consumption of the embedded software by combining the measurement data and software logs. However, the sampling rate of the profiling software restricts the analysis granularity of a measurement-based tool, and it is expensive to set up a high-resolution measurement environment. Synchronizing the measurement data on the meter and the system activities on the target is also a challenge because the metering and profiling software run on different machines.
The other approach to profile the energy consumption of an embedded system is based on power models. Model-based tools estimate the energy consumption of embedded systems by monitoring the occurrences of representative events during system execution, along with the energy weights of these events. Researchers have proposed a number of power models at the architecture level, instruction level, basic block level, and function level. Wattch [4] adopted an architecture-level power model that was integrated into the SimpleScalar simulator [21]. Wattch modeled the power consumption of the primary units of an embedded processor, e.g., functional units and caches, and monitored the number of accesses to these units to estimate the energy consumption of embedded software [5]. Unlike architecture-level power models, instruction-level models [6][7][8][9] divide a processor’s instruction set into a number of classes according to the average power consumption of each instruction execution. These tools can determine the energy consumption information of a program by accumulating the number of executed instructions for each class. Tan et al. proposed EMSIM [10][11], based on the instruction-level power model presented in [7] to further support per-task and function-level energy estimation in an embedded Linux environment.
Although architecture-level and instruction-level model approaches can achieve accurate results, they require a lot of time to collect the necessary information for energy estimation. This is particularly true for embedded systems running complicated software such as multi-thread programs and multi-tasking operating systems (OSs). System designers may want to know the power consumption of the embedded system quickly so that they can adjust power management strategies to achieve better energy efficiency. As a result, researchers have proposed several high-level energy profiling tools that compromise between the profiling accuracy and the profiling overhead. High-level tools may estimate the power consumption of an embedded system at the basic block level [6][12] and function level [13][14]. The power consumption of basic blocks and functions can be determined by direct power measurement or low level power models. High-level energy profiling tools run directly on the target platform along with the embedded software, and collect critical execution information to estimate the power consumption of all running software. Tiwari et al. [6] built a base energy cost for basic blocks of the target program. The energy consumption of the program can be evaluated by accumulating the number of times that each basic block is executed multiplied by its base energy cost. Another basic-block power analysis was proposed in [12]. This approach groups consecutive basic blocks in the target program together, and derives the energy weight of each group using regression analysis. Qu et al. [13] presented a function-level power analysis. In this approach, a database, or power data bank, stores the
average power and execution times of library functions and basic instructions. This method evaluates the energy consumption of a program through the number of times that each function is invoked multiplied by its average power and execution time recorded in the power data bank. Another function-level power analysis tool proposed in [14] is a software energy estimation tool for heterogeneous dual-core processor. This function-level power model measures the average power consumption of different digital signal processing (DSP) algorithms in advance and stores the data in an energy library. The energy consumption of DSP algorithms can be calculated by multiplying the execution time of each DSP algorithm by its average power in the energy library.
Unfortunately, these high-level tools do not consider the power management functions usually supported by modern embedded processors. Embedded processors, and especially those designed for battery-operated devices, are sensitive to power consumption, and provide sophisticated operating modes, voltages, and frequencies [1][2][18]. Operating systems (OSs) can use the power management features of the embedded processors to achieve dynamic power management functions, optimizing the energy efficiency of the embedded system. Without considering the operating modes, voltages, and frequencies of an embedded processor and the dynamic power management functions of an OS, software energy profiling results become inaccurate. As a result, system designers are limited in their ability to evaluate the power management strategies on the embedded system.
This project presents a high-level energy-profiling tool called SEProf. This tool supports multi-thread software and OS enabling dynamic power management functions such as different idle mode, suspend mode, and dynamic voltage and frequency scaling, etc. The proposed tool supports different granularities of energy profiling on embedded software, allowing designers to control the tradeoff between profiling overhead and accuracy. The proposed SEProf was implemented in Linux 2.6.19 to evaluate its accuracy and efficiency. Experimental results show that the average energy estimation error of using SEProf is less than 4%, and the overhead introduced by SEProf is less than 1%.
The rest of this report is organized as follows. Section 2 descirbes the design and implementation of the proposed tool, SEProf. Section 3 presents a case study based on an ARM11 MPCore processor and experimental results. Section 4 provides some conclusions.
2. Design and Implementation of SEProf
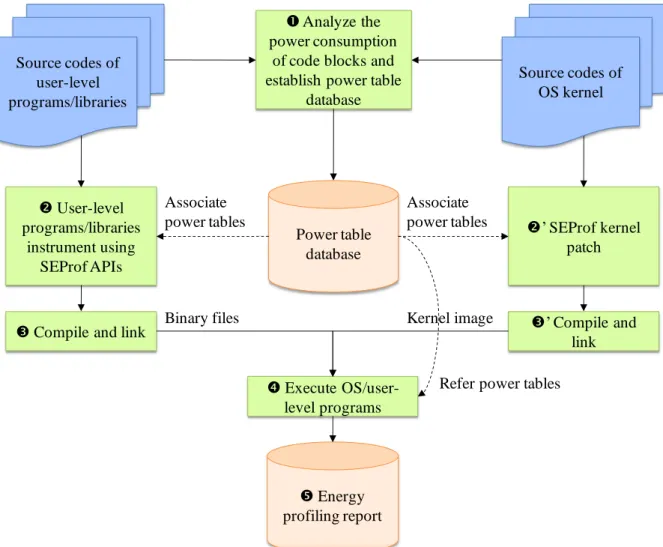
Fig. 1 provides an overview of the proposed energy-profiling tool, SEProf. Before profiling embedded software, SEProf develops a power table database for the target embedded processor in Step . This power
table database is a collection of power tables that SEProf uses to estimate the power consumption of the
processor, and can be built via measurement-based tools or lower level model-based tools. A power table records the average power consumption required for the processor to execute a code block. A code block represents a sequence of instructions, such as a basic block, a function, or a sequence of basic blocks in OS or applications. The granularity of code blocks that influences the profiling accuracy and the overhead is a configurable parameter in SEProf. Fine-grain power tables generally achieve better accuracy, but suffer from greater profiling overhead than coarse-grain power tables. However, experimental results show that for RISC processors it is possible to derive accurate energy estimation results using the proper design of coarse-grain power tables.
Since the goal of SEProf is to estimate the energy consumption of a processor enabling power management functions, a power table can consist of more than one power consumption value. Each value represents the average power consumption of a code block executed under a specific CPU power configuration. A CPU power configuration represents a combination of a specific operating power mode, voltage, and frequency of the processor. Each core in a multi-core processor may have its own power configuraion. Once the embedded OS activates the dynamic power management functions, it changes CPU power configuration, and SEProf ensures that the proper power consumption value is used for each processor core.
After establishing the power table database in Step , SEProf inserts codes to user-level embedded software in Step according to the desired granularity of code blocks. For example, if a user desires granularity at the function level, the user must build power tables based on each function. SEProf then inserts codes in the user-level software to associate the power tables before entering the corresponding functions, and to disassociate them when leaving these functions. The instrumented codes tell SEProf which power table is associated with the running code block. The instrumentation in the OS kernel is similar to user-level software, and the OS kernel code blocks must associate kernel power tables. Therefore, Step ’ in Fig. 1 shows that the OS kernel is patched. After Step and Step ’, Step and Step ’ compile the OS kernel and the user-level programs. In Step , SEProf runs the program on the target embedded system, and stores the estimated energy consumption results in the kernel space. Users can access the results through SEProf application programming interfaces (APIs) in Step .
Fig. 1. Overview of SEProf and its operating steps.
Analyze the power consumption
of code blocks and establish power table
database Power table database User-level programs/libraries instrument using SEProf APIs ’ SEProf kernel patch Associate power tables Associate power tables Source codes of user-level programs/libraries Source codes of OS kernel
Compile and link ’ Compile and
link
Execute OS/user-level programs
Binary files Kernel image
Energy profiling report
2.1. Power Table Association and Power Configuration Setting
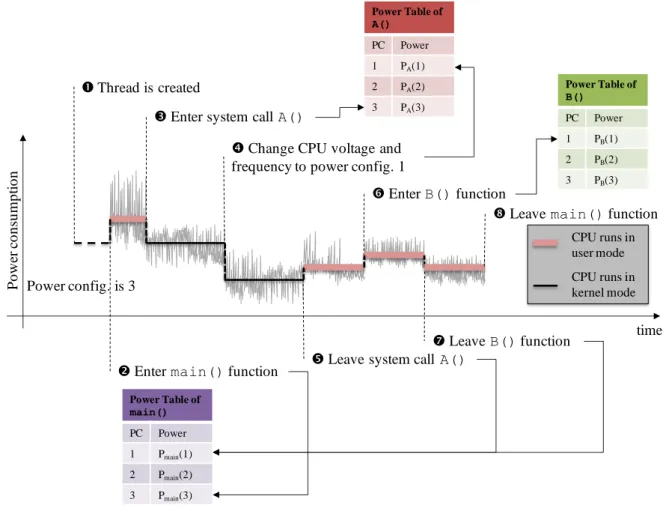
User-level programs and OS kernel can associate and disassociate power tables through SEProf APIs upon entering and leaving code blocks. The association and disassociation operations must be coupled. If a power table is associated, the power table will be used to estimate the average power consumption of the executing software. On the contrary, if a power table is disassociated, the average power consumption is estimated based on the power table, which was previously associated. Fig. 2 shows an example of using power tables in SEProf. Assume that function-level power tables have been built, and the embedded processor supports three different CPU power configurations. For the ease of illustration, this example omits several detailed procedures before entering the main() function of the program. In Step , the CPU operates at the maximum speed in power configuration 3, and executes kernel codes to fork a thread, called T. SEProf initiates internal data structures for energy profiling at this stage, and associates the power tables of thread T’s parent with thread T. In Step , thread T enters its main function, and SEProf associates thread T with the power table of main(), Pmain(3). Pmain(3) denotes the CPU power consumption of running the main() function under CPU power configuration 3. This power table is used to estimate the power consumption in the following operations until thread T invokes a system call, say A(), in Step . SEProf then associates the power table of A()and refers to the power table of A(). If the OS detects the CPU is underutilized in Step , the OS changes the CPU power configuration from 3 to 1 to reduce energy consumption. SEProf detects this event, and changes the referred power consumption value from PA(3) to PA(1) at this stage. In Step , thread
T finishes the system call, and returns to the user space. The power table of A() is disassociated so that the
power table of main()is used again. In Step , thread T enters a user-level function, say B(). As in Step , the power table of B() and the CPU power configuration 1, i.e. PB(1), is used. In Step and Step , the thread leaves the functions B()and main(), respectively. When thread T is terminated, SEProf keeps its energy consumption profile in the kernel space, and users can access the results through SEProf APIs.
Fig. 2. An example of using power tables and power configurations in SEProf.
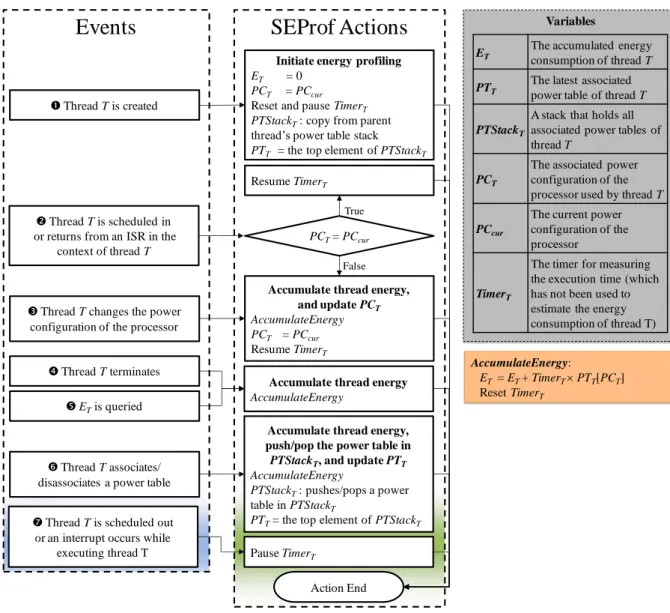
2.2. Energy Estimation
Fig. 3 presents a flowchart of the proposed SEProf in calculating the energy consumption of a thread. When a thread, named T, is created, SEProf initiates the energy profiling data structures for the thread shown as Event in Fig. 3 occurs. The initialization procedure resets ET, the accumulated energy consumption of
thread T. The power configuration of the processor used by thread T, PCT, is set to the current power
configuration of the processor, PCcur. The timer for measuring the execution time (which has not been used to
estimate the energy consumption of thread T), TimerT, is set to zero and paused. The power table stack of
thread T, PTStackT, which holds all associated power tables of thread T, is copied from that of thread T’s
parent, and the latest associated power table of thread T, PTT, is pushed to the stack PTStackT. When thread T
is scheduled (Event ), SEProf checks whether the CPU power configuration has been modified or not by comparing the thread T’s associated power configuration PCT with the current one PCcur. If the power
configuration is the same, SEProf resumes TimerT to measure the execution time of thread T. However, if the
OS or other threads change the power configuration, SEProf accumulates the energy consumption of thread T during the execution period measured by TimerT using ET = ET + TimerT PTT[PCT], where PTT[PCT] looks
up the average power consumption of the processor operating at power configuration PCT in power table PTT.
After accumulating the energy consumption, SEProf updates the power configuration PCT to the current one
PCcur, and resets TimerT to accumulate the next execution period of thread T.
P o w er c o n su m p ti o n time
Enter main() function Enter system call A()
Change CPU voltage and frequency to power config. 1
Leave system call A() Enter B() function PC: power configuration Power Table of A() PC Power 1 PA(1) 2 PA(2) 3 PA(3) Power Table of B() PC Power 1 PB(1) 2 PB(2) 3 PB(3) Leave B() function CPU runs in user mode CPU runs in kernel mode Power Table of main() PC Power 1 Pmain(1) 2 Pmain(2) 3 Pmain(3)
Leave main() function Thread is created
Four other events also trigger SEProf to accumulate the energy consumption of thread T. The first one is when thread T changes the CPU power configuration, PCcur, indicated by Event . The second one is when
thread T terminates (Event ). The third one is when ET is queried by thread T or other threads (Event ),
and the last one is when thread T associates or disassociates a power table (Event ). If thread T associates a new power table in Event , the new power table becomes PTT, and it is pushed into PTStackT after
performing the energy estimation procedure. Conversely, if thread T disassociates a power table in Event , the disassociating power table is used to estimate the energy consumption, and then popped up from PTStackT.
The power table that appears on the top of the stack after removing the dissociating one becomes PTT. When
thread T is scheduled out, as shown in Event , SEProf pauses TimerT to stop counting the execution time of
thread T.
In summary, SEProf accumulates the energy consumption of a thread when one of the following four events occurs.
(1) A thread associates or disassociates a power table. When a thread associates or disassociates a power table, it implies a change in the reference average power consumption of the embedded processor. Therefore, SEProf must calculate the energy consumption of the accumulated execution time and update the power table.
(2) The power configuration of the embedded processor is changed. When the CPU power configuration of an embedded processor changes, the power consumption of the processor also changes. Hence, SEProf must calculate the energy consumption of the accumulated execution time using the associated power configuration of the thread.
(3) The total energy consumption of a thread is queried. If a user queries the total energy consumption of a thread, the energy consumption of the thread must be updated before returning the energy profiling results to the user.
(4) A thread ends. When a thread terminates, the energy consumption of the thread during the last execution period is added to the total energy consumption of the thread. This is the last time that SEProf accumulates the energy consumption of the thread.
Since the OS may execute ISRs that are not a part of thread T when thread T is scheduled, SEProf could separate the energy consumption of the thread and that of ISRs by pausing TimerT when an interrupt occurs
(Event ), and resuming the timer when CPU returns from an ISR (Event ). However, the experiments in this report did not separate these events because the runtime of ISRs is negligible.
Fig. 3. Energy estimation flowchart of SEProf.
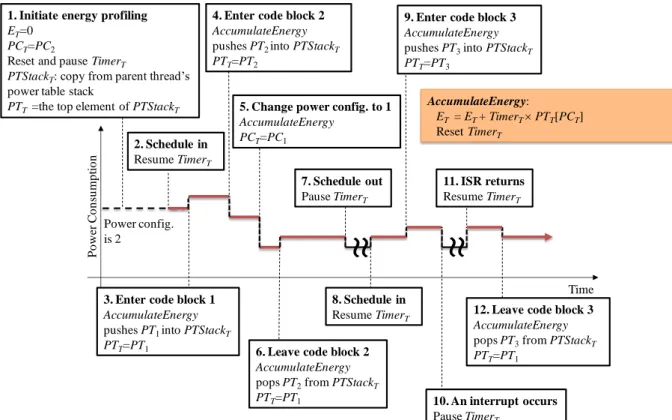
Fig. 4 shows an example of energy estimation using SEProf. When a thread, say T, is created, the data structures of the thread energy profiling are initiated in Step 1. In Step 2, thread T is scheduled and TimerT
starts to accumulate the execution time of the thread. In Step 3, thread T enters code block 1 and associates with the power table PT1. Since the power table has changed, SEProf calculates the energy consumption of thread T during the period from Step 2 to Step 3, resets TimerT, pushes PT1 into PTStackT, and sets PTT to PT1. In Step 4, thread T enters code block 2, and associates with the power table PT2. SEProf accumulates the energy consumption during the period from Step 3 to Step 4, pushes PT2 into PTStackT, and sets PTT to PT2. In Step 5, thread T changes the CPU power configuration from 2 to 1. SEProf accumulates the energy consumption of thread T, and sets PCT to PC1. In Step 6, thread T leaves code block 2, and returns to code block 1. SEProf accumulates the energy consumption during the period from Step 5 to Step 6, pops PT2 from
PTStackT, and sets PTT to the power table of code block 1. In Step 7, thread T is scheduled out so that the
runtime measurement is paused. In Step 8, thread T is scheduled again. SEProf resumes TimerT. In Step 9,
thread T enters code block 3. SEProf accumulates the energy consumption during the period from Step 6 to Step 7 and Step 8 to Step 9. Afterward, SEProf pushes PT3 into PTStackT, and sets PTT to PT3. Because an interrupt occurs in Step 10, the execution time measurement is paused until returning from the ISR in Step 11. Finally, in Step 12, thread T completes the execution of code block 3, and returns to code block 1. SEProf accumulates the energy consumption during the period from Step 9 to Step 10 and Step 11 to Step 12.
SEProf Actions
Events
Pause TimerT
Thread T is scheduled out or an interrupt occurs while
executing thread T Thread T terminates
ETis queried
PCT= PCcur
Thread T is scheduled in or returns from an ISR in the
context of thread T
Resume TimerT
False Thread T is created
Initiate energy profiling
ET = 0 PCT = PCcur
Reset and pause TimerT PTStackT: copy from parent
thread’s power table stack
PTT = the top element of PTStackT
Action End True
Thread T changes the power configuration of the processor
Variables ET
The accumulated energy consumption of thread T
PTT
The latest associated power table of thread T
PTStackT
A stack that holds all associated power tables of thread T
PCT
The associated power configuration of the processor used by thread T
PCcur
The current power configuration of the processor
TimerT
The timer for measuring the execution time (which has not been used to estimate the energy consumption of thread T)
Thread T associates/ disassociates a power table
Accumulate thread energy, and update PCT
AccumulateEnergy PCT = PCcur
Resume TimerT
Accumulate thread energy, push/pop the power table in PTStackT, and update PTT
AccumulateEnergy
PTStackT: pushes/pops a power
table in PTStackT
PTT= the top element of PTStackT
Accumulate thread energy
AccumulateEnergy
AccumulateEnergy:
ET = ET+ TimerTPTT[PCT]
Fig. 4. An example of energy estimation using SEProf.
2.3. Data Structures
Seprof maintains three primary data structures in kernel space to support thread-based energy estimation of embedded processors enabling power management functions, as Fig. 5 shows. The following section describes these data structures:
(1) User-level program power table database. A user-level program power table database consists of the power tables of the program that are used by all threads running the same program/library. All user-level power table databases are copied into the kernel space when a thread starts running, and are referenced through indexes.
(2) A kernel power table database. A kernel power table database contains all kernel-level power tables. It is built in the OS kernel and shared among all threads on the system.
(3) A per-thread SEProf data structure in the kernel space. This data structure holds the latest associated power table, a timer variable, a power table stack, an associated power configuration, and an accumulated energy consumption of the thread.
Fig. 5 shows how SEProf maintains the power table stack. When a thread enters a new code block where a power table is associated, it pushes the associated power table into its power table stack. On the other hand, when the thread leaves the code block where the power table is disassociated, the power table is popped out from the stack. Fig. 5 shows that when the thread enters code block i, j, and k, the power tables of the three code blocks are linked in the power table stack.
P o w er C o n su m p ti o n Time
3. Enter code block 1
AccumulateEnergy
pushes PT1 into PTStackT PTT=PT1
5. Change power config. to 1
AccumulateEnergy PCT=PC1
9. Enter code block 3
AccumulateEnergy
pushes PT3into PTStackT PTT=PT3 Power config. is 2 7. Schedule out Pause TimerT
~
~
~ ~
12. Leave code block 3
AccumulateEnergy
pops PT3from PTStackT PTT=PT1
8. Schedule in
Resume TimerT
4. Enter code block 2
AccumulateEnergy
pushes PT2into PTStackT PTT=PT2
1. Initiate energy profiling
ET=0 PCT=PC2
Reset and pause TimerT
PTStackT: copy from parent thread’s
power table stack
PTT =the top element of PTStackT
11. ISR returns
Resume TimerT
6. Leave code block 2
AccumulateEnergy
pops PT2from PTStackT
PTT=PT1 10. An interrupt occurs Pause TimerT AccumulateEnergy: ET = ET+ TimerTPTT[PCT] Reset TimerT 2. Schedule in Resume TimerT
Fig. 5. Data structures maintained by SEProf
Per-user program power table database SEProf per-thread
data structure
Power table associations
Thread
User Space
Kernel Space
Task
structure
Power Table i Power Table j Power Table k The latest associatedpower table (PT)
Code block i j k
SEProf global data structure
Kernel power table database Runtime for energy
estimation (Timer) Accumulated thread
Energy (E) Power Table Stack
(PTStack) Associated power configuration (PC) Power table database
Power table disassociations
Kernel power table
database
Current Position
3. Case Study: ARM11 MPCore Processor
To verify the design of SEPorf and evaluate its accuracy, SEProf was implemented in Linux on an ARM11 MPCore processor [15]. Section 3.1 and 3.2 describe the experimental environment and results .
3.1. Experimental Environment
The experimental platform was a Core Tile, CT11MPCore [16], with an ARM11 MPCore test chip stacked on the top of a RealView Emulation Baseboard [17]. This platform provided both voltage and frequency scaling functions and hardware support for measuring the voltage and current consumed by the processor. This platform made it possible to build a power table database and verify the estimation error easily. The voltage level of the ARM11 MPCore processor could be changed by writing values to a digital to analog converter (DAC) on the CT11MPCore, and the voltage and current of the processor were measured and monitored in runtime by accessing analog to digital converter (ADC) registers. The default voltage supplied to the ARM11 MPCore processor was 1.2 V, with an adjustment range of ±0.25V. The clock rate of the processor could also be changed by configuring the phase-locked loop (PLL) on the CT11MPCore. In these experiments, the DAC and PLL were used to scale the voltage and the frequency of the ARM11 MPCore processor, respectively, and the ADC was used to measure the processor’s power consumption.A 24 MHz clock on the Emulation Baseboard was used for time measurement. The time resolution is 41.7 ns.
SEProf was integrated into Linux kernel 2.6.19 with a modified OProfile [19] to build power table databases. OProfile is a system-wide profiler for Linux systems that uses statistical sampling. OProfile can be used to profile Linux kernels, shared libraries, and applications. Originally, OProfile samples the context and program counter (PC) value of the running task on each sampling interrupt, but the experiments extended it to sample the power consumption of the processor as well. The sampling rate of OProfile was set to 1 kHz, assuming that a power sample could represent the average power consumption during a sampling period.
Four testing programs were used throughout the experiment. The first three were CG, FT, and IS applications from the OpenMP Implementation of NAS Parallel Benchmarks (NPB) (Version 3.3) [20]. CG computes an approximation to the smallest eigenvalue of a matrix using a conjugate gradient method. FT performs the time integration of a three-dimensional partial differential equation using the Fast Fourier Transform. IS sorts integers using the bucket sort. The last testing program, FileRW, is an I/O intensive application written by the authors. It is a simple application that writes and reads a 30MB file through a network file system (NFS).
3.2. Experimental Results
This report includes two separate experiments because the ARM11 MPCore cannot dynamically change the frequency of the processor. The first one is a voltage and frequency scaling (VFS) experiment, and the second one is a dynamic voltage scaling (DVS) experiment. In the VFS experiment, both the voltage and the frequency of the ARM11 MPCore processor were scaled at the beginning of the experiment and remained the same throughout the experiment. In the DVS experiment, the voltage of the ARM11 MPCore processor was scaled dynamically and periodically.
3.2.1. VFS Experiment
The VFS experiment selected five power configurations for the ARM11 MPCore processor, and configured the processor to operate under one of five power configurations during the experiment. As Table 1 shows, each power configuration represents a combination of voltage and frequency levels for the processor. In the power analysis stage, only one MP11 CPU was active during the experiment to map the measured power consumption back to the embedded software. The remaining three CPUs were not initialized. After analyzing the power consumption of the embedded software using the patched OProfile, the seven power table databases shown in
Table 2 were built for six applications and the Linux kernel. Each power table database contained only one power table, and each power table consisted of five average power consumptions. The power table of each application was associated with SEProf at the beginning of the application, and disassociated at the end. All six applications shared the same kernel power table, vmlinux. In this setup, the kernel power table is associated when a thread calls a system call, and disassociated when the thread returns from the system call. It is also associated with threads that have no dedicate power table databases.
Table 3 depicts the energy estimation results of the testing programs generated by SEProf. The energy and time spent on executing application itself and calling system calls were separated to better examine the accuracy of the power estimation results. Table 3 shows that, in many cases, the average power consumption of the application was slightly lower than that of the average power consumption in
Table 2. This is because the parent threads of the testing programs have no dedicated power table databases, so they associate with the kernel power table, vmlinux, which has the lowest average power. When the threads running the testing programs are forked, they associate with the kernel power table copied from their parent threads until they associate with their own power tables.
Table 1. Power configurations of the ARM11 MPCore processor used in the VFS experiment.
Table 2. Power tables used in the VFS experiment.
Power Configuration Voltage (V) Frequency (MHz)
1 0.95 140 2 1.01 168 3 1.08 196 4 1.14 224 5 1.2 252 Power Configuration Average Power (mW)
busybox cg.W ft.W is.W FileRW oprofiled vmlinux
1 260 249 258 246 246 264 236
2 352 335 349 334 330 359 320
3 460 438 458 438 431 470 419
4 589 559 586 560 565 602 537
Table 3. Energy estimation results of the testing programs generated by SEProf.
Table 4 verifies the accuracy of the power estimation results for VFS experiments. OProfile was modified to sample the measured power of the ARM11 MPCore and compare it with the estimated power provided by SEProf for each sampling interrupt. Table 4 shows the mean absolute power estimation error of the four testing programs and an overall period. The overall period began when the init process executed command scripts for system startup, and ended when all testing programs terminated. It represents the execution of Linux kernel and applications including the testing programs and the other programs without dedicated power databases. These results show that the power estimation error using SEProf was quite low. In most cases, the average estimation error was less than 2% and the standard deviation of the estimation error was less than 2%.
Power
Configuration Application Name
Average Power (mW)
Energy Decompositions
Application System Call/Kernel
Average Power (mW) Average Power (mW)
1 cg.W 249 249 236 ft.W 258 258 236 is.W 246 246 236 FileRW 236 237 236 2 cg.W 335 335 320 ft.W 349 349 320 is.W 334 334 320 FileRW 320 321 320 3 cg.W 438 438 419 ft.W 458 458 419 is.W 438 438 419 FileRW 419 421 419 4 cg.W 559 559 537 ft.W 586 586 537 is.W 560 560 537 FileRW 537 540 537 5 cg.W 696 696 668 ft.W 731 731 668 is.W 701 701 668 FileRW 668 672 668
Table 4. Power estimation error in the VFS experiment.
3.2.2. DVS Experiment
As in the VFS experiment, the DVS experiment selected five power configurations for the ARM11 MPCore processor, and activated only one MP11 CPU. However, the clock frequency of the processor operating at each power configuration was the same as in Table 5, and the voltage of the processor varied at runtime. Seven power tables were built for the applications and the Linux kernel, respectively, as Table 6 shows.
Table 5. Power configurations of the ARM11 MPCore processor used in the DVS experiment.
Power Configuration Application Name / Overall Number of Samples (1ms/sample) Average Absolute
Estimation Error Standard Deviation
1 cg.W 227,437 0.54% 1.10% ft.W 70,929 1.17% 1.42% is.W 34,767 0.82% 0.74% FileRW 16,935 1.96% 1.40% Overall 392,000 0.87% 1.38% 2 cg.W 203,952 0.50% 1.13% ft.W 61,413 1.30% 1.52% is.W 30,003 0.75% 0.72% FileRW 15,836 1.91% 1.40% Overall 346,787 0.87% 1.46% 3 cg.W 188,774 0.51% 1.10% ft.W 54,521 1.55% 1.63% is.W 26,756 0.75% 0.68% FileRW 14,838 1.67% 1.35% Overall 315,333 0.92% 1.48% 4 cg.W 176,394 0.50% 1.05% ft.W 49,043 1.70% 1.76% is.W 24,308 0.79% 0.61% FileRW 14,004 1.60% 1.18% Overall 291,048 0.95% 1.52% 5 cg.W 167,235 0.59% 0.95% ft.W 43,609 1.68% 1.66% is.W 22,380 0.78% 0.67% FileRW 13,467 1.35% 1.10% Overall 272,056 0.99% 1.47%
Power Configuration Voltage (V) Frequency (MHz)
1 0.95 140
2 1.01 140
3 1.08 140
4 1.14 140
Table 6. Power tables used in the DVS experiment.
In the DVS experiment, the voltage of the processor was periodically scaled at three different time intervals: 100 ms, 1 s, and 10 s. The power configuration of the processor was increased by one at each time interval. If the power configuration of the processor reached five, it was set to one in the next time interval. Fig. 6 shows an example of DVS and its power consumption. In this example, two lines show the measured and the estimated power consumption during the execution of the IS application. Because the DVS interval was set to 100 ms in this example, the power consumption of the processor varied every 100 ms. Fig. 6 shows that the estimated power consumption was very close to the measured one. The estimated power consumption occasionally drops, but the measured one does not. This is because that the thread that executed the IS application was scheduled out during that period, and another thread which associated with a different power table was scheduled in. If the newly scheduled thread had a lower average power consumption, then a drop appears in the figure. Since the measured power consumption read from the ADC is updated every 5 ms, the drop of the real power consumption cannot be detected if the newly scheduled thread is scheduled out within the ADC update period.
Fig. 6. The measured and the estimated power consumption during the execution of is.W.
200000 250000 300000 350000 400000 450000 0 500 1000 1500 2000 2500 3000 3500 4000 4500 5000 5500 6000 6500 7000 7500 8000 P o w e r ( u W) Time (ms)
Mea sured Power
200000 250000 300000 350000 400000 450000 0 500 1000 1500 2000 2500 3000 3500 4000 4500 5000 5500 6000 6500 7000 7500 8000 P o w e r ( u W) Time (ms)
Estima ted Power
Power Configuration
Average Power (uW)
busybox cg.W ft.W is.W FileRW oprofiled vmlinux
1 260 249 258 246 246 264 236
2 298 284 295 282 282 302 271
3 339 322 336 321 330 344 309
4 382 362 378 363 370 388 349
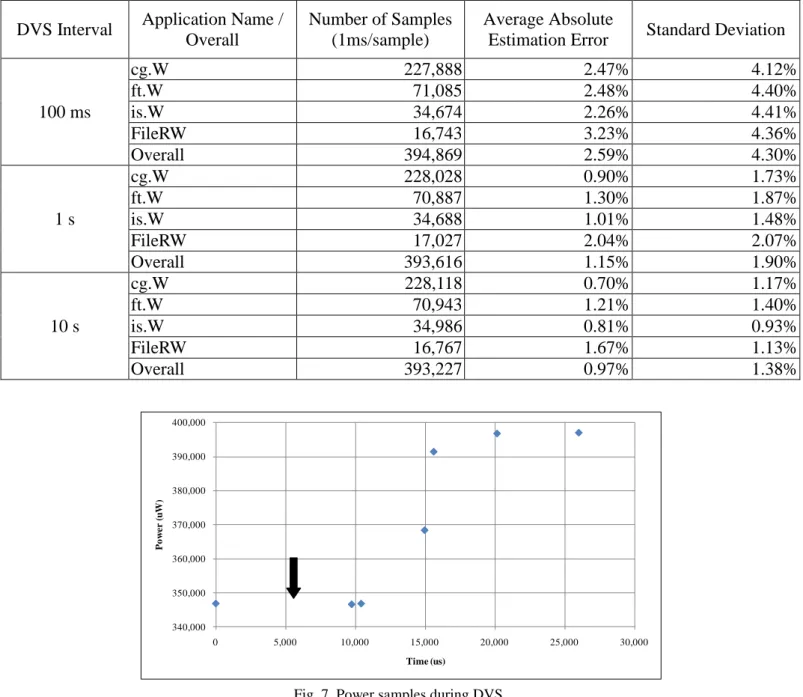
Table 7 presents the power estimation error in the DVS experiment. The average absolute estimation error and the standard deviation of the error increased as the DVS interval decreased. This is because the power consumption of the processor does not change immediately after a new value is written to the DAC, and the power consumption of the processor after changing voltages is unable to be read from the ADC immediately. Fig. 7 illustrates this using seven power samples taken from the ADC during the period that the voltage level of the processor is scaling. The arrow in Fig. 7 indicates the time that the new voltage level is written to the DAC. SEProf updates the power configuration of the processor at this point, but the power consumption of the processor does not change immediately. Instead, it becomes stable, and can be read form ADC 10 ms later. Consequently, the power consumption difference between the measured values and the estimated values during this period increases the average estimation error and the standard deviation of the error.
Table 7. Power estimation error in DVS experiment.
Fig. 7. Power samples during DVS.
The last experiment measured the performance overhead introduced by SEProf in the DVS experiment. For all cases, SEProf introduced less than 1% overhead over an unmodified Linux kernel, even when the DVS interval was 100 ms. 340,000 350,000 360,000 370,000 380,000 390,000 400,000 0 5,000 10,000 15,000 20,000 25,000 30,000 P o w e r ( u W) Time (us)
DVS Interval Application Name / Overall
Number of Samples (1ms/sample)
Average Absolute
Estimation Error Standard Deviation
100 ms cg.W 227,888 2.47% 4.12% ft.W 71,085 2.48% 4.40% is.W 34,674 2.26% 4.41% FileRW 16,743 3.23% 4.36% Overall 394,869 2.59% 4.30% 1 s cg.W 228,028 0.90% 1.73% ft.W 70,887 1.30% 1.87% is.W 34,688 1.01% 1.48% FileRW 17,027 2.04% 2.07% Overall 393,616 1.15% 1.90% 10 s cg.W 228,118 0.70% 1.17% ft.W 70,943 1.21% 1.40% is.W 34,986 0.81% 0.93% FileRW 16,767 1.67% 1.13% Overall 393,227 0.97% 1.38%
4. Conclusions
This project proposes and implements a high-level energy profiling tool called SEProf. SEProf estimates the energy consumption of each thread by maintaining a power table stack for each thread and tracking the power configurations of embedded processors in runtime. This makes SEProf suitable for energy estimation on multi-core embedded systems with power management functions. The experiments in this report implemented SEProf in Linux kernel 2.6.19, and conducted a number of experiments on an ARM11 MPCore processor. VFS results show that the average power estimation error using SEProf was within 2% and the standard deviation of the estimation error was within 2%. DVS results indicate that the average power estimation error was within 4%, and the standard deviation of the estimation error was within 5% when the DVS interval was 100 ms. The performance overhead introduced by SEProf in DVS experiment was less than 1%.
References
[1] K. Choi, R. Soma, and M. Pedram, "Fine-Grained Dynamic Voltage and Frequency Scaling for Precise Energy and Performance Tradeoff Based on the Ratio of Off-Chip Access to On-Chip Computation Times," IEEE Transactions on Computer-Aided Design of Integrated Circuits and Systems, vol. 24, NO. 1, January 2005.
[2] C. Isci, A. Buyuktosunoglu, C.-Y. Cher, P. Bose, and M. Martonosi, "An Analysis of Efficient Multi-Core Global Power Management Policies: Maximizing Performance for a Given Power Budget, " the 39th Annual IEEE/ACM International Symposium on Microarchitecture (MICRO), 2006.
[3] J. Flinn and M. Satyanarayanan, "PowerScope: A Tool for Profiling the Energy Usage of Mobile Applications," in Proceedings of the Second IEEE Workshop on Mobile Computer Systems and Applications (WMCSA), 1999.
[4] D. Brooks, V. Tiwari, and M. Martonosi, "Wattch: A Framework for Architectural-Level Power Analysis and Optimizations," 27th International Symposium on Computer Architecture (ISCA-27), June 2000. [5] M. Monchiero, R. Canal, and A. Gonzalez, "Power/Performance/Thermal Design-Space Exploration for
Multicore Architectures," IEEE Transactions on Parallel and Distributed Systems, Vol. 19, No. 5, May 2008.
[6] V. Tiwari, S. Malik, and A. Wolfe, "Power analysis of embedded software: A first step towards software power minimization," IEEE Transactions on Very Large Scale Integration (VLSI) Systems, Vol. 2, Issue 4, pp. 437-445, Dec. 1994.
[7] A. Sinha and A. P. Chandrakasan, "Jouletrack - a web based tool for software energy profiling," in Proceedings of the Design Automation Conference (DAC), 2001.
[8] H. Blume, D. Becker, L. Rotenberg, M. Botteck, J. Brakensiek, and T.G. Noll, "Hybrid functional- and instruction-level power modeling for embedded and heterogeneous processor architectures," Journal of Systems Architecture, Vol. 53, Issue 10, pp. 689–702, 2007.
[9] H. Blume, J.v. Livonius, L. Rotenberg, T.G. Noll, H. Bothe, and J. Brakensiek, "Performance and Power Analysis of Parallelized Implementations on an MPCore Multiprocessor Platform," International Conference on Embedded Computer Systems: Architectures, Modeling and Simulation (IC-SAMOS), 2007.
[10] T. K. Tan, A. Raghunathan, and N. K. Jha, "EMSIM: An energy simulation framework for an embedded operating system," in Proceedings of IEEE International Symposium on Circuit & Systems, pages 464–467, May 2002.
[11] T. K. Tan, A. Raghunathan, and N. K. Jha, "A simulation framework for energy consumption analysis of OS-driven embedded applications," IEEE Transactions on Computer-Aided Design of Integrated Circuits and Systems, 22(9) 1284-1294, Sept. 2003.
[12] T. K. Tan, A. Raghunathan, G. Lakshminarayana, and N. K. Jha. "High-level software energy macro-modeling," in Proceedings of Design Automation Conference, June 2001.
[13] G. Qu, N. Kawabe, K. Usami, and M. Potkonjak, “Function-level power estimation methodology for microprocessors,”in Proceedings of Design Automation Conference (DAC), pp. 810–813, 2000.
[14] C.-H. Hsu, J.-J. Chen, and S.-L. Tsao, "Evaluation and Modeling of Power Consumption of a Heterogeneous Dual-Core Processor," in the 13th International Conference on Parallel and Distributed Systems (ICPADS), Hsinchu, Taiwan, Dec. 2007.
[15] "ARM11 MPCore Processor Revision r1p0 Technical Reference Manual," ARM, Feb. 2008. [16] "Core Tile for ARM11 MPCore HBI-0146 User Guide," ARM, September 2006.
[17] "RealView™ Emulation Baseboard HBI-0140 Rev D User Guide," ARM, Oct. 2007.
[18] R. Kumar, K. I. Farkas, N. P. Jouppi, P. Ranganathan, and D. M. Tullsen, "Single-ISA Heterogeneous Multi-Core Architectures: The Potential for Processor Power Reduction," in Proceedings of the 36th International Symposium on Microarchitecture (MICRO), Dec. 2003.
[19] J. Levon, "OProfile Internals," http://oprofile.sourceforge.net/doc/internals/index.html, 2003.
[20] H. Jin, M. Frumkin, and J. Yan, "The OpenMP Implementation of NAS Parallel Benchmarks and Its Performance," NAS Technical Report NAS-99-011, NASA Ames Research Center, Oct. 1999.
[21] D. Burger and T. M. Austin, "The SimpleScalar Tool Set," Version 2.0, Computer Architecture News, pp. 13-25, Jun. 1997.
[22] REALProf, http://of.openfoundry.org/projects/1399
[23] Jian-Jhen Chen, Shiao-Li Tsao, and Meng-Ru Lin, “A High-Level Software Energy Profiling Tool for Embedded Processors,” The Third Asia Pacific Embedded Systems Education and Research Conference, Singapore, Dec 2009.
[24] Jian-Jhen Chen, Shiao-Li Tsao, and Meng-Ru Lin, “SEProf: A High-Level Software Energy Profiling Tool for an Embedded System with Dynamic Power Management Functions,” in preparation, 2009.
[25] Jyun-Wei Lin and Shiao-Li Tsao, “Hardware-Assisted Performance/Energy Evaluation Tool for Multi-core Embedded System,” in preparation, 2009.
Project Self-Assessment
We have released the beta version of the REALProf tool on Open Foundry [22]. Also, we have one conference paper which has been accepted [23] and two journal papers [24][25] which are under preparation based on the results of this project.
國科會補助專題研究計畫項下赴國外(或大陸地區)出差或
研習心得報告
日期:2010 年 12 月 31 日一、 國外(大陸)研究過程
本計畫產出之嵌入式軟體耗電評估工具以及相關研究成果受瑞士聯邦理 工大學資訊工程系 Prof. Juerg Gutknecht 與其研究團隊負責人 Dr. Dennis Majoe 的高度肯定,因此邀約於 8/12 至 9/30 訪問蘇黎世瑞士聯邦理工大學(由 對方負擔住宿費用),進行計畫合作之討論,與實質合作之系統整合設計研 究,此外亦進行未來的研究合作提案,預計將本計畫之研發成果應用於該研 究團隊之歐盟 FP7 研究計畫 OPTIMI (http://www.optimiproject.eu/)之穿戴式 感應器裝置之上,用以評估該穿戴式感應器裝置之軟體耗電行為並透過本計 畫工具加以改善。二、 研究成果
The project I mainly involved during this visit is the embedded multi-core system project in Prof. Jürg Gutknecht's group. The project goals are to propose and develop system programming models and languages for data streaming applications based on reconfigurable embedded multi-core systems. Prof. Jürg Gutknecht and his group proposed a language called System Oberon to facilitate designers in developing embedded systems including hardware and software. Designers first describe their systems using System Oberon language, System Oberon compiler can generate
計畫編 號 NSC 98-2220-E-009-013 計畫名 稱 系統層級之多核心嵌入式系統發展與驗證環境--子計畫三:多核 心嵌入式系統效能與耗能分析監測與改善(2/2) 出國人 員姓名 曹孝櫟 服務機 構及職 稱 交通大學資訊工程系副教授 出國時 間 99 年 8 月 12 日 至 99 年 9 月 30 日 出國地 點 瑞士蘇黎世
efficient multi-core hardware for running the application, and multi-thread software running on top of the multi-core processor. The hardware descriptions and configurations generated by System Oberon compiler are further processed by the hardware synthesis tool, e.g. Xilinx ISE. The hardware synthesis tool can generate the hardware on an FPGA board. Figure 1 shows the design flow of System Oberon and FPGA-based embedded multi-core system. Electrocardiography (ECG) was used as an example to verify the concept and design flow of System Oberon.
Figure 1. System Oberon and its design flow for FPGA-based embedded multi-core (Figure source: Lisa Liu and Oleksii Morozov, “A Process-Oriented Streaming System
Design Paradigm for FPGA,” submitted for publication).
The power consumption is an important issue for an embedded multi-core system. One of the benefits for using System Oberon is because the compiler can produce efficient hardware for running the application program. For example, the interconnection bus between CPU cores, and shared memory buffer between CPU cores are optimized by System Oberon. However, current System Oberon can generate the hardware without power management functions, and the CPU cores always operate at the maximal speed. In the multi-core system, CPU cores execute processes in parallel and sometime they communicate with each other for coordinating the tasks and data. Without precisely managing the tasks on each CPU core, the communication between CPU cores, the operating speeds and voltages of CPU cores, the CPU cores may consume extra power during the execution. Figure 2 (a) illustrates an example that the system wastes power if all CPU cores operate at the maximal and the same speed. Therefore, during this visit, I worked with Prof. Jürg
Gutknecht and his group to improve the energy efficiency of the system generated by System Oberon language. In the enhanced System Oberon, designers could specify the power consumption requirements when they develop their systems. The compiler can generate the necessary hardware to optimize the energy efficiency of the embedded multi-core system. For example, the designer provides the energy requirement information in System Oberon program. Then, the compiler generates the hardware with power management functions, and software utilizing these hardware power management features to minimize the power consumption of the system. Figure 2 (b) gives an example.
(a) (b)
Figure 2. Reducing power consumption of an embedded multi-core system through hardware and software power management functions.
time CPU1 CPU2 CPU3 CPU4 CPU5
Tasks Power consumption
2ms CPU1 CPU2 CPU3 CPU4 CPU5
Figure 3. Low-power hardware extension based on System Oberon.
Figure 3 and Figure 4 illustrate our proposed low-power enhancements based on System Oberon. Figure 3 shows that a designer can specify the performance or energy requirement of the systems in System Oberon language. After the designer provides the information, System Oberon compiler generates the necessary low-power hardware and/or additional power management hardware into the hardware platform. For example, in Figure 3, the designer added the low-power attribute in the system description. The compiler automatically integrates the power management hardware components into the original hardware designs. Then, the designer is able to use power management functions when they develop their energy-aware applications based on System Oberon. Figure 4 gives an example that designer can use power management functions such as sleep and idle in their programs. Moreover, the busy-waiting functions are automatically translated to the sleep-wakeup version which consumes much less power when the designer specifies the low-power attribute in the System Oberon program.
Low power attributes and performance/power requirements
Pow er m an age r clk clk gclk clken FIFO FIFO T h rou gh ou tbu s /regi ster FIFO/IO status BUFGCE
Figure 4. Low-power software extension based on System Oberon.
During the three-month visit, we not only enhanced System Oberon to support energy-aware program development, but also prototyped the proposed concepts in System Oberon language, System Oberon compiler, and the CPU hardware called TRM (Tiny Register Machine). We used the ECG application to verify our designs and compare the performance in terms of energy consumption before and after applying our proposed energy-aware features. To evaluate the power consumption, we established a power consumption evaluation platform shown in Figure 5. We used the platform to measure and evaluate the power consumption of the ECG multi-core embedded system. Figure 6 shows the experimental results. Compared with the full-connected multi-core embedded system, the system generated by System Oberon significantly reduces the power consumption because the unnecessary interconnection bus and buffer are avoided. The ECG multi-core embedded system generated by our energy-aware System Oberon can further reduce 45% power consumption.
BEGIN LOOP y := a+b; RS232.SendInteger(y); RS232.SendEnd; SYSTEM.PUT(ledAdr, y); RECEIVE(in, a, PMConfig); END; END TestTRM2. resettimer(PMConfig .T)
REPEAT UNTIL checkreceive(in, a) Or timerexpire() IF timerexpire() THEN stoptimer() Idle END RECEIVE(in, a); BEGIN LOOP y := a+b; RS232.SendInteger(y); RS232.SendEnd; SYSTEM.PUT(ledAdr, y); IDLE; RECEIVE(in, a); END; END TestTRM2.
Low power attributes and performance/power requirements
Figure 5. Architecture and demonstration of the power consumption evaluation platform.
Figure 6. Performance evaluation of the proposed low-power improvement.
The system level design environment is very important to embedded system development. System Oberon provides a convenient language for designers to describe their system architecture, hardware configurations, software functions and procedures. System Oberon compiler can produce efficient hardware and software for the application. Our low-power and power management enhancement based on System Oberon further provide language level support for designers to specify their energy and performance requirements. Therefore, the development of energy-aware
Power supply ML505 board Agilent U1253B DC power connector +O )-- + + -AC power PC IR-USB
Low power version
ECG: process 500 samples per second
0.54502
XPower simulation
Estimated results based on physical measurement
system and software become possible based on System Oberon design flow. Our prototype and preliminary experimental results demonstrate that the proposed enhancement can significantly reduce the power consumption of the ECG application by 45%.
The colleagues in Prof. Jürg Gutknecht’s group are further improving the system and collecting more experimental results. We are working together in preparing a joint research paper which will be submitted to a conference or journal.
三、 建議與後續合作
Figure 7. Prof. Jürg Gutknecht, his group and me.
This is a very successful visit. My research on energy-aware computing is a system-wide research topic, and requires the knowledge and support across a wide spectrum of computer systems. Due to limit research resources I had in Taiwan, I usually have to focus on a specific point in a system and fail to evaluate the design from a system perspective. Also, I usually have to consider the design and evaluation of the proposed ideas and technologies into separated hardware and software platforms. On the other hand, Prof. Jürg Gutknecht and his group have built entire embedded multi-core systems including hardware, system software, and application software by themselves. Therefore, we could be able to research our low-power designs from a system point of view, and realize and evaluate hardware and software designs in the real system. I do learn a lot from cooperating with Prof. Jürg Gutknecht and his group members.
Prof. Jürg Gutknecht and his group have worked on programming languages, compilers, run-time systems, operating systems, and hardware designs for years, and have outstanding achievements. They want to consider power consumption issues in their research and therefore invite me for a visit. Power consumption is regarded as a critical problem of information and communication technology (ICT) infrastructure in the next decade. Reducing the electrical needs of computer systems becomes the most important task for computer scientists and engineers, and has recently attracted
considerable interest in both academia and industry. During this visit, I also do bring new ideas, give talks, and share my experiences and research results in reducing the power consumption of computer systems to the group. We not only jointly proposed the new low-power ideas for the existing projects, but also prototyped and evaluated the proposed systems in a real environment. The experimental results demonstrate we could significantly reduce the power consumption of the systems. Moreover, I help the group to establish the power consumption evaluation platform so that they can continue the low-power research and development after I am back to Taiwan.
I was invited to join the annual retreat of Prof. Jürg Gutknecht's group in Sept. 24 to Sept. 25, 2010. During the meetings, we all agree that we had very successful cooperation and had fruitful research results in this visit. This visit has mutual benefits to both of our groups. We also concluded we should continue our cooperation and further extend the cooperation between two groups. Research cooperation has been arranged and they are currently on-going. They are:
(1) FP7 project cooperation: Prof. Jürg Gutknecht has involved in an FP7 project,
called Online Predictive Tools for Intervention in Mental Illness (OPTIMI). His group is to build a wearable device for monitoring patients’ physiology data. The wearable device is now operated by batteries but will be operated by harvested energy sources such as solar energy, thermal energy, kinetic energy, etc. The power consumption issue is one of the most challenging issues for the device design. My team has worked on power management middleware and run-time support for energy-aware software which is a critical software component for the FP7 OPTIMI project. Therefore, Prof. Jürg Gutknecht and FP7 OPTIMI project coordinator invited me to join the project so that we could contribute our power management middleware to the project. (see below letters of intention)
Figure 8. Letters of intention for joining FP7 OPTIMI project.
Based on the discussion, I then proposed a project under join research projects agreement between Switzerland/SNSF and Taiwan /NSC scientific cooperation. The project is just approved and granted by National Science Council in Taiwan. Based on this joint project, we will continue our cooperation effort and further extend our cooperation in area of power management framework for wearable devices and energy scavenging sensors.
(2) New FP7 project on green datacenters: Prof. Jürg Gutknecht invited me to
visit Microsoft Research Cambridge in UK in Sept. 28, 2010. During the visit, we had an intensive discussion on the area of power management issues in datacenters, and found a very good synergy between Prof. Jürg Gutknecht's group in ETH Zurich, Microsoft Research Cambridge and my group in National Chiao Tung University in Taiwan. We thus decided to work on a new proposal under FP7. The draft project title is SPREAD: Scalable Predictably Robust Energy Aware Datacenter. The overall objective is to define, develop and evaluate and model a scalable methodology for the on-going deployment of energy aware datacenters. We are currently preparing the proposal and plan to submit the proposal next year.
國科會補助計畫衍生研發成果推廣資料表
日期:2011/01/03國科會補助計畫
計畫名稱: 子計畫三:多核心嵌入式系統效能與耗能分析監測與改善(2/2) 計畫主持人: 曹孝櫟 計畫編號: 98-2220-E-009-013- 學門領域: 晶片科技計畫--整合型學術研究 計畫無研發成果推廣資料
98 年度專題研究計畫研究成果彙整表
計畫主持人:曹孝櫟 計畫編號: 98-2220-E-009-013-計畫名稱:系統層級之多核心嵌入式系統發展與驗證環境--子計畫三:多核心嵌入式系統效能與耗能 分析監測與改善(2/2) 量化 成果項目 實際已達成 數(被接受 或已發表) 預期總達成 數(含實際 已達成數) 本計畫實 際貢獻百 分比 單位 備註(質 化 說 明:如 數 個 計 畫 共 同 成 果 、 成 果 列 為 該 期 刊 之 封 面 故 事 ... 等) 期刊論文 0 0 50% 研究報告/技術報告 0 0 50% 研討會論文 0 0 50% 篇 論文著作 專書 0 0 100% 申請中件數 0 0 100% 專利 已獲得件數 0 0 100% 件 件數 0 0 100% 件 技術移轉 權利金 0 0 100% 千元 碩士生 2 2 100% 博士生 2 2 100% 博士後研究員 0 0 100% 國內 參與計畫人力 (本國籍) 專任助理 0 0 100% 人次 期刊論文 2 2 50%1. Shiao-Li Tsao and Chung-Huei
Huang, 'A Survey of Energy Efficient MAC Protocols for IEEE
802.11 WLAN, '
accepted, Computer Communications, 2010. (SCI, EI) 2. Shiao-Li Tsao, You-Lin Chen, and Chia-Hsiang Chang, 'Evaluation of Scan and Association Process for Real-Time Communication in Mobile WiMAX,' accepted by IEEE Transactions on Wireless Communications, 2010. (SCI, EI) 國外 論文著作 研究報告/技術報告 0 0 100% 篇
研討會論文 1 1 50%
1. Shiao-Li Tsao and Shih-Yung Lee, 'Evaluating the Energy Efficiency of TCP Transmission over a WiMAX Network,' IEEE International Conference on Computer Communication Networks (ICCCN 2010), 2010 專書 0 0 100% 章/本 申請中件數 0 0 100% 專利 已獲得件數 0 0 100% 件 件數 0 0 100% 件 技術移轉 權利金 0 0 100% 千元 碩士生 0 0 100% 博士生 0 0 100% 博士後研究員 0 0 100% 參與計畫人力 (外國籍) 專任助理 0 0 100% 人次 其他成果