L
Journal of Alloys and Compounds 339 (2002) 162–166
www.elsevier.com / locate / jallcom
Transformation temperatures and second phases in Ti–Ni–Si ternary shape
memory alloys with Si#2 at.%
a b ,
*
cS.F. Hsieh , S.K. Wu
, H.C. Lin
a
Department of Mold and Die Engineering, National Kaohsiung University of Applied Science, Kaohsiung, Taiwan 807 b
Department of Materials Science and Engineering, National Taiwan University, Taipei, Taiwan 106 c
Department of Materials Science, Feng Chia University, Taichung, Taiwan 407 Received 3 September 2001; accepted 13 November 2001
Abstract
Effects of Si on transformation temperatures and second phases in Ti502xNi Si , Ti Ni50 x 50 502xSi and Ti Nix 51 492xSi shape memoryx
alloys (SMAs) with x51, 2 at.% are investigated. Three different second-phase particles located at grain boundaries are observed. They are x -phase particles (Ti Ni Si ), l -phase particles (Ti Ni Si ) and Ti (Ni, Si) particles. In addition to the formation of second phases,5 4 1 1 2 3 1 2
a small amount of Si remained in solid solution in the matrix of Ti–Ni–Si ternary SMAs. Experimental results show that, in the matrix, the effects of Ni1Si in combination on transformation temperatures of Ti–Ni–Si ternary SMAs are similar to Ni effects on those of as-quenched TiNi binary SMAs. 2002 Elsevier Science B.V. All rights reserved.
Keywords: Transition metal compounds; Metallography; Thermal analysis; Phase transition
1. Introduction clinic martensite, R is the rhombohedral premartensite and
B19 is the orthorhombic premartensite. It is well known Among many shape memory alloys (SMAs), TiNi alloys that a small deviation from stoichiometry in TiNi SMAs are the most feasible from the point of view of application can give rise to significant precipitation of second phases in both shape memory effect (SME) and pseudoelasticity [13,14]. This in turn affects both the strength of the alloy (PE). It has been confirmed that the properties of TiNi and its shape memory effect. To our knowledge, trans-SMAs can be affected by various thermal–mechanical formation behavior and precipitated second phases in Ti– treatments, such as thermal cycling [1], aging [2,3] and Ni–Si ternary SMAs with small amounts of Si have not cold rolling [4]. Furthermore, the addition of a third been reported yet. The purpose of the present study is to element to replace Ni and / or Ti has a substantial effect on investigate the effect of substituted Si on transformation phase transformation behavior of TiNi alloys. The starting temperatures of Ti502xNi Si ,50 x Ti Ni50 502xSix and temperature of martensitic transformation, Ms, of TiNi Ti Ni51 492xSi alloys with x51–2 at.%. The precipitatedx
binary alloys decreases following the substitution of Ni second phases in these alloys are also discussed. with V, Cr, Mn, Fe or Co elements [5–7], but increases
remarkably following the substitution of Ni with Au, Pd or
Pt in amounts not less than 15–20 at.% [8–10]. At the 2. Experimental same time, the martensitic transformation sequence can
also be affected by the addition of a third element, such The conventional tungsten arc melting technique was that the B2→B199 sequence of Ti Ni50 50 SMA changes to employed to prepare Ti502xNi Si , Ti Ni50 x 50 502xSix and B2→R→B199 in Ti Ni Fe50 47 3 alloy [7], but to Ti Ni51 492xSi alloys with x51, 2 at.%, i.e. Ti Ni Si ,x 49 50 1
B2→B19→B199 in Ti Ni Cu50 40 10 alloy [11,12]. Here, B2 Ti Ni Si , Ti Ni Si , Ti Ni Si , Ti Ni Si48 50 2 50 49 1 50 48 2 51 48 1 and is the parent austenite of TiNi SMA, B199 is the mono- Ti Ni Si alloys. The as-melted buttons were homogen-51 47 2
ized at 950 8C for 72 h and then furnace cooled. The buttons were cut into several plates with a low speed *Corresponding author. Tel.: 7846; fax:
1886-2-2363-diamond saw, sealed in evacuated quartz tubes, annealed at 4562.
E-mail address: [email protected] (S.K. Wu). 900 8C for 2 h and then quenched in water with the tube 0925-8388 / 02 / $ – see front matter 2002 Elsevier Science B.V. All rights reserved.
intact. DSC measurements were made with a Dupont 9990 20 kV and the software for quantification is the XM-86PAC
thermal analyzer equipped with a quantitative scanning quantitative analysis program. system 910 DSC cell for controlled heating and cooling
runs on samples encapsulated in an aluminum pan and
operated in N atmosphere. The running temperature range2 3. Results and discussion was from 2100 to 200 8C with a heating and cooling rate
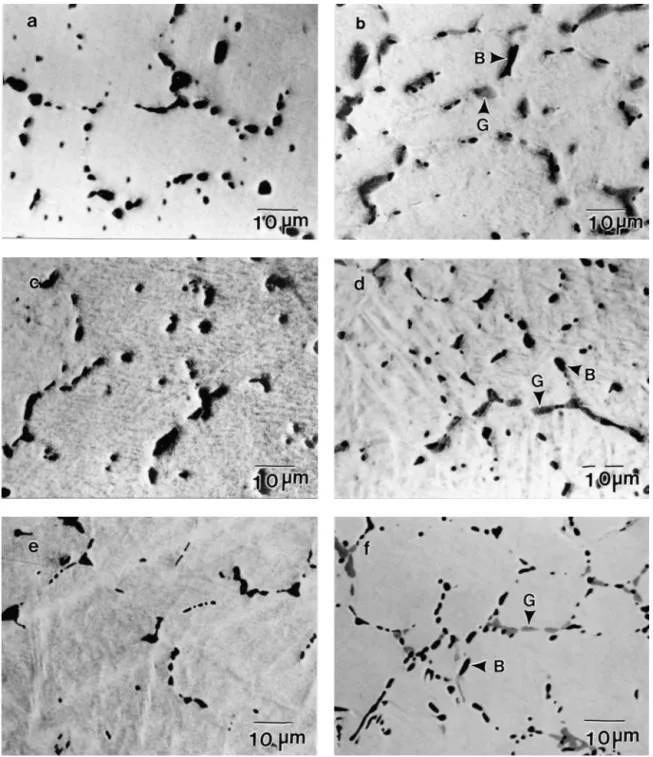
of 10 8C / min. A quantitative analysis of the chemical Fig. 1(a)–(f) show the EPMA backscattering electron composition of alloys was performed by using a Joel images (BEIs) of homogenized Ti Ni Si , Ti Ni Si ,49 50 1 48 50 2
JXA-8600SX electron probe microanalyzer (EPMA) Ti Ni Si , Ti Ni Si , Ti Ni Si50 49 1 50 48 2 51 48 1 and Ti Ni Si51 47 2
equipped with a wavelength dispersive X-ray spectrometer alloys, respectively. There are three different contrast areas (WDS) analysis system. The operating voltage of EPMA is that can be observed in Ti Ni Si , Ti Ni Si48 50 2 50 48 2 and
Fig. 1. EPMA backscattering electron images (BEIs) of the 950 8C homogenized (a) Ti Ni Si , (b) Ti Ni Si , (c) Ti Ni Si , (d) Ti Ni Si , (e)49 50 1 48 50 2 50 49 1 50 48 2 Ti Ni Si and (f) Ti Ni Si alloys. In (b), (d) and (f), B and G indicate the black and gray particles, respectively.51 48 1 51 47 2
Ti Ni Si51 47 2 alloys, including the gray matrix, the black Fig. 2 shows the experimental results of DSC measure-particles and the gray measure-particles, as shown in Fig. 1(b), (d) ments for homogenized Ti Ni Si , Ti Ni Si48 50 2 50 48 2 and and (f). However, only black particles located around the Ti Ni Si51 47 2 alloys. The peak temperatures M* and A* grain boundaries appear in Fig. 1(a), (c) and (e) of (including Ms, Mf, As and Af points) appearing in Fig. 2 Ti Ni Si , Ti Ni Si49 50 1 50 49 1 and Ti Ni Si51 48 1 alloys, respec- are associated with the forward and reverse martensitic tively. The chemical compositions of the matrix and transformation of B2↔B199, respectively [16]. DSC second-phase particles determined by WDS of EPMA are curves for Ti Ni Si , Ti Ni Si and Ti Ni Si alloys49 50 1 50 49 1 51 48 1
given in Table 1. The data given in Table 1 are the are similar to those of Fig. 2 and thus are omitted. All DSC averages taken of at least five tests for each area with the results of M*, A* and Ms temperatures are listed in Table errors. The ratios R5Ti /(Ni1Si) of the matrix and 2. From Tables 1 and 2, transformation peak temperatures, second-phase particles are also calculated in Table 1. M* and A*, versus the R ratio of the matrix are plotted and Based on 750 and 1000 8C Ti–Ni–Si ternary phase dia- shown in Fig. 3. From Fig. 3, it is clear that transformation grams [15], WDS chemical analysis and backscattering peak temperatures increase with the increase in the R ratio electron characteristics of EPMA image, Table 1 indicates up to 1.01 and then gradually levels off when the R ratio is that all the matrix in Fig. 1 is TiNi SMA containing a more than 1.01. It is well known that Ms temperature small amount of Si in solid solution. The amount of Si in increases with the increasing Ti / Ni ratio in as-quenched solid solution in the matrix increases with the increasing TiNi binary alloys [3,14]. This behavior is also shown in amount of Si substituted in TiNiSi ternary SMAs. The Fig. 3. From the results of Fig. 3 and Tables 1 and 2, it can black particles are the x phase (Ti Ni Si )5 4 1 in be deduced that the Ms temperature of an equiatomic TiNi Ti502xNi Si and Ti Ni50 x 50 502xSi alloys with x51, 2 at.%,x binary alloy is about 60 8C, but for Ti Ni Si alloy and49 50 1
but they are Ti (Ni, Si) phase in Ti-rich Ti Ni2 51 492xSix Ti Ni Si alloys, the Ms temperature becomes approxi-48 50 2
alloys with x51, 2 at.%. The gray particles are the l1 mately 224 and 247 8C, respectively, which lie between phase (Ti Ni Si ) in Ti Ni Si and Ti Ni Si alloys,2 3 1 48 50 2 50 48 2 the Ms temperatures of as-quenched Ti49.4Ni50.6 alloy, but they are x phase in Ti Ni Si alloy. According to51 47 2 Ti / Ni50.976, 221 8C [3] and the 295 8C of as-quenched Table 1, the composition of the x phase (Ti Ni Si )5 4 1 Ti Ni49 51 alloy, Ti / Ni50.961 [2]. According to Table 1, appearing in Fig. 1 is in the range of 50–55 at.% Ti and the R ratio of the matrix of Ti Ni Si and Ti Ni Si49 50 1 48 50 2
12–15 at.% Si and that of l phase (Ti Ni Si ) is in the1 2 3 1 alloys are 0.972 and 0.967, respectively, which also fall in range of 33–35 at.% Ti and 16–19 at.% Si. the range of 0.961–0.976. This fact implies that the effect
Table 1
Compositional analyses by EPMA of Ti502xNi Si , T Ni50 x 50 502xSi and Ti Nix 51 492xSi alloys with x 51, 2 at.% homogenized at 950 8C for 72 hx
Alloys Ti Ni Si Ti /(Si1Ni) Remark
(at.%) (at.%) (at.%) R ratio
Ti Ni Si49 50 1 M 49.2960.15 50.5460.16 0.1760.06 0.972 Matrix B 50.3560.26 36.2760.30 13.3860.21 – x-Phase G – – – – – Ti Ni Si48 50 2 M 49.1760.16 50.3760.18 0.4660.08 0.967 Matrix B 50.0860.21 36.6160.27 13.3160.24 x-Phase G 35.2560.24 47.4360.30 17.3260.16 – l -Phase1 Ti Ni Si50 49 1 M 50.2760.13 49.2860.15 0.4560.07 1.011 Matrix B 50.5360.25 36.5060.23 12.9760.26 – x-Phase G – – – – – Ti Ni Si50 48 2 M 50.3260.16 48.7660.21 0.9260.12 1.013 Matrix B 50.4760.30 35.3160.25 14.2260.20 – x-Phase G 35.4760.20 47.0560.20 17.4860.16 – l -Phase1 Ti Ni Si51 48 1 M 51.0660.20 48.7260.18 0.2260.06 1.043 Matrix B 66.3960.27 32.1460.25 1.4760.18 1.980 Ti (Ni1Si)2 G – – – – – Ti Ni Si51 47 2 M 51.2160.18 47.9660.20 0.8360.10 1.050 Matrix B 67.3160.25 31.3760.27 1.3260.17 2.059 Ti (Ni1Si)2 G 50.1260.21 34.4960.24 15.3960.23 – x-Phase
Fig. 3. Transformation temperatures of A* and M* versus R ratio for Ti502xNi Si , Ti Ni50 x 50 502xSi and Ti Nix 51 492xSi alloys. The Ms tempera-x ture versus Ti / Ni ratio for TiNi binary alloys is also indicated.
a role similar to Ni atoms rather than Ti atoms in TiNi Fig. 2. DSC curves of as-annealed Ti Ni Si , Ti Ni Si48 50 2 50 48 2 and
Ti Ni Si51 47 2 alloys. M* and A* are peak temperatures of forward and binary alloys. This characteristic is further confirmed by reverse martensitic transformation, respectively. the remarkable consistency in the curves of Fig. 3 in which Ti / Ni ratio is used in as-quenched TiNi binary alloys, but Ti /(Ni1Si) ratio is used in TiNiSi ternary alloys. of Ti / Ni ratio on the transformation temperature of TiNi
binary SMAs is similar to the effect of R ratio on that of Ti Ni Si and Ti Ni Si SMAs. The same transforma-49 50 1 48 50 2
4. Conclusion tion characteristics can also be found in Ti Ni Si ,50 49 1
Ti Ni Si , Ti Ni Si and Ti Ni Si alloys. For ex-50 48 2 51 48 1 51 47 2
The TiNi matrix can dissolve a small amount of Si in ample, the R ratio of the matrix in Ti Ni Si51 47 2 alloy is
solid solution, along with three different second phases about 1.05, as shown in Table 1, which is nearly equal to
which were observed in homogenized Ti502xNi Si ,50 x
the ratio Ti / Ni of Ti Ni51 49 alloy. The peak temperatures
Ti Ni50 502xSi and Ti Nix 51 492xSi alloys with x 51, 2 at.%.x
A* and M* of Ti Ni Si alloy shown in Fig. 2 are nearly51 47 2
These are x -phase particles (Ti Ni Si ), l -phase particles5 4 1 1
equal to those of as-quenched Ti Ni51 49 alloy [13]. The
(Ti Ni Si ) and Ti (Ni, Si) particles. DSC results show2 3 1 2
above fact suggests that the small amount of Si in solid
that the transformation temperatures for homogenized solution in Ti502xNi Si , Ti Ni50 x 50 502xSi and Ti Nix 51 492xSix
Ti502xNi Si , Ti Ni50 x 50 502xSix and Ti Ni51 492xSix alloys alloys has an equivalent effect in increasing Ni in TiNi
with x 51, 2 at.% increase with the increasing R ratio binary alloys. In other words, the substituted Si atoms play
(R5Ti /(Ni1Si)) of the matrix. We suggest that the Ni1Si effects on transformation temperatures of Ti–Ni–Si ternary alloys are similar to Ni effects on those of as-quenched TiNi binary alloys. According to this point of view, Table 2
Ti Ni Si alloys with x 51, 2 at.% are similar to DSC data of M*, A* and Ms transformation temperatures of 51 492x x
Ti502xNi Si , T Ni50 x 50 502xSi and Ti Nix 51 492xSi alloys with x 51, 2 at.%x Ti-rich TiNi SMAs. They have Ti (Ni, Si) second phases2 when x 51 at.% and have Ti (Ni, Si) and x -phase particles
Alloys M* (8C) Ms (8C) A* (8C) 2
when x 52 at.%. At the same time, Ti502xNi Si50 x and
Ti Ni Si49 50 1 230 224 4
Ti Ni50 502xSi alloys with x 51, 2 at.% can be regarded asx
Ti Ni Si48 50 2 253 247 215
Ni-rich or near equiatomic TiNi SMAs. They only have
Ti Ni Si50 49 1 61 73 106
Ti Ni Si50 48 2 68 76 108 x-phase particles as the second phase when x51 at.%, and
Ti Ni Si51 48 1 70 79 111 have x -phase and l -phase particles when x 52 at.%.
1
Ti Ni Si51 47 2 74 84 114 Experimental results also show that Ti Ni Si alloy
[5] K.H. Eckelmeyer, Script. Metall. 10 (1976) 667. which behaved similarly to Ti Ni50 50 SMA has the greatest
[6] T. Honma, M. Matsumoto, Y. Shugo, M. Nishida, I. Yamazaki, in: H. amount of Si in solid solution in the matrix.
Kimura, O. Izumi (Eds.), Proceedings 4th International Conference on Titanium ’80, AIME, Warrendale, PA, 1980, p. 1455.
[7] C.M. Hwang, M. Meichle, M.B. Salamon, C.M. Wayman, Phil.
Acknowledgements Mag. 47A (1983) 177.
[8] S.K. Wu, C.M. Wayman, Metallography 20 (1987) 359.
[9] Y.C. Lo, S.K. Wu, C.M. Wayman, Script. Metall. 24 (1990) 1571. The authors are pleased to acknowledge the financial
[10] P.G. Lindqist, C.M. Wayman, in: T.W. Duering, K.N. Melton, D. support provided for this research by the National Science Stockel, C.M. Wayman (Eds.), Engineering Aspects of Shape Council (NSC), Republic of China under Grant NSC Memory Alloys, Butterworth Heinemann, London, 1990, p. 58. 89-2216-E151-010 and NSC 88-2216-E002-013. [11] Y. Nakata, T. Tadaki, K. Shimizu, Mater. Trans., JIM 32 (1991)
1120.
[12] T. Nam, T. Saburi, Y. Kawamura, K. Shimizu, Mater. Trans., JIM 31 (1990) 262.
References [13] M. Nishida, C.M. Wayman, T. Honma, Metall. Trans. 17A (1986)
1505.
[1] S. Miyazaki, Y. Igo, K. Otsuka, Acta Metall. 34 (1986) 2045. [14] H.C. Lin, S.K. Wu, J.C. Lin, Mater. Chem. Phys. 37 (1994) 184. [2] S.K. Wu, H.C. Lin, T.S. Chou, Script. Metall. 23 (1989) 2043. [15] P. Villars, A. Prince, H. Okamoto, in: Handbook of Ternary Alloy [3] M. Nishida, T. Honma, Script. Metall. 18 (1984) 1293. Phase Diagrams, Vol. 10, ASM International, Pittsburgh, USA, 1995, [4] H.C. Lin, S.K. Wu, T.S. Chou, H.P. Kao, Acta Metall. 39 (1991) p. 13026.