行政院國家科學委員會專題研究計畫 成果報告
新化學鍍活化液合成與電化學特性之研究(II)(第 2 年)
研究成果報告(完整版)
計 畫 類 別 : 個別型 計 畫 編 號 : NSC 98-2221-E-151-033-MY2 執 行 期 間 : 99 年 08 月 01 日至 100 年 07 月 31 日 執 行 單 位 : 國立高雄應用科技大學化學工程與材料工程系 計 畫 主 持 人 : 李建良 報 告 附 件 : 出席國際會議研究心得報告及發表論文 處 理 方 式 : 本計畫涉及專利或其他智慧財產權,2 年後可公開查詢中 華 民 國 100 年 09 月 17 日
行政院國家科學委員會補助專題研究計畫
■ 成 果 報 告
□期中進度報告
新化學鍍活化液合成與電化學特性之研究(Ⅱ)
計畫類別:■個別型計畫 □整合型計畫
計畫編號: NSC 98-2221-E-151-033-MY2
執行期間: 98 年 8 月 1 日至 100 年 7 月 31 日
執行機構及系所:國立高雄應用科技大學 化學工程與材料工程系
計畫主持人:李建良
共同主持人:
計畫參與人員:碩士班研究生- 吳振中、張坤全、許秋美、許嘉傑、邱雪萍
陳致豪、楊昊霖、黃俊翰
成果報告類型(依經費核定清單規定繳交):□精簡報告 ■完整報告
本計畫除繳交成果報告外,另須繳交以下出國心得報告:
□赴國外出差或研習心得報告
□赴大陸地區出差或研習心得報告
■出席國際學術會議心得報告
□國際合作研究計畫國外研究報告
處理方式:
除列管計畫及下列情形者外,得立即公開查詢
□涉及專利或其他智慧財產權,□一年■二年後可公開查詢
中 華 民 國 100 年 8 月 1 日
Abstract
1. Synthesis of Highly Active Ag/Pd Nanorings for Activating Electroless Copper Deposition
A new and simple method for preparing Ag/Pdnanorings is reported. Energy-dispersive X-ray element
mapping results showed a random distribution of Ag and Pd atoms over the nanoring, indicating that the nanorings were made of an alloy of Ag and Pd. These nanorings were then successfully used as catalysts in electroless copper deposition. Results of quartz crystal microbalance measurements revealed that the catalytic activity of prepared Ag/Pd nanorings was better than that of monometallic Ag and Pd nanoparticles.
2. Porous Ag-Pd Triangle Nanoplates with Tunable Alloy Ratio for Catalyzing Electroless Copper Deposition
Porous triangular Ag-Pd nanoplates of various bimetallic ratios were prepared by a galvanic
displacement reaction in which Pd(OAc)2 reacted with Ag nanoplates. In order to reduce the interaction of
free hexadecyltrimethylammonium bromide (CTAB) with the synthesized Ag-Pd nanoplates during this reaction, Ag nanoplate/CTAB solution was precipitated by high-speed centrifugation before synthesizing the porous bimetallic nanotemplates. The kinetics of electroless copper deposition (ECD) catalyzed by these bimetallic nanoplates are analyzed by using a quartz crystal microbalance (QCM). The results reveal that Ag18Pd1 nanoplates show better catalytic activity than Ag18Pd1.5 and Ag18Pd2 nanoplates. Further, the
catalytic activity of the porous nanoplates in the ECD bath can be controlled by varying their alloy ratios.
3. Electrochemical synthesis of Pd–NiO nanoparticles in water-in-oil microemulsions for activating electroless Ni deposition
Dispersions of Pd–NiO nanoparticles were electrochemically synthesized in a water-in-oil microemulsion, with fine control by appropriate adjustment of the concentration ratio of H2O to surfactant. The feasibility
of using these Pd–NiO nanoparticles as a new activator for electroless Ni deposition (END) was examined. In this study, fast electroless deposition was achieved using Pd–NiO nanoparticles as a catalyst. A systematic study of the deposition kinetics and the mass activity by electrochemical quartz-crystal microgravimetry indicated that adding NiO to active colloids can shorten the induction time, and that reducing the particle diameter can accelerate END reactions because steady-state deposition is achieved more quickly.
目錄
Abstract...I
目錄... II
1. Synthesis of Highly Active Ag/Pd Nanorings for Activating Electroless Copper Deposition... 1
1.1 Introduction... 1
1.2 Experimental ... 1
1.3 Results and discussion ... 2
1.4 Conclusion ... 5
1.5 Acknowledgement ... 5
1.6 References ... 5
2. Porous Ag-Pd Triangle Nanoplates with Tunable Alloy Ratio for Catalyzing Electroless Copper Deposition ... 7
2.1 Introduction... 7
2.2 Experimental ... 7
2.3 Results and discussion ... 8
2.4 Conclusion ... 12
2.5 Acknowledgement ... 12
2.6 References ... 12
3. Electrochemical synthesis of Pd–NiO nanoparticles in water-in-oil microemulsions ... 13
for activating electroless Ni deposition... 13
3.1 Introduction... 13
3.2 Experimental ... 14
3.3 Results and discussion ... 15
3.4 Conclusion ... 21
3.5 Acknowledgements ... 21
1. Synthesis of Highly Active Ag/Pd Nanorings for Activating Electroless Copper
Deposition
1.1 Introduction
Metallic nanoparticles of different shapes have the potential to be used as catalysts in organic 1-3 and electrochemical reactions 1,4. For example, Pt nanoparticles of various shapes (size: 5 nm) are used as catalysts in the electron-transfer reactions between [Fe(CN)6]3– and S2O32– 5. Transmission electron
microscopy (TEM) analysis shows that the percentage of atoms located at the corners and edges in tetrahedral, cubic, and truncated octahedral Pt nanocrystal are approximately 35%, 13%, and 6% of the total number of surface atoms, respectively. The catalytic rate constants increase exponentially with the percentage of corner and edge atoms 5. The other reaction involved shape-dependent catalysis is hydrogenation reaction. The conversion percentages of ethylene to ethane in the presence of cubic, cuboctahedral, and porous Pt nanoparticles as catalysts are compared, and it is found that the porous nanoparticles are more active than the cubic and cuboctahedral nanoparticles 6. Metal nanoparticles are often used as catalysts in electrochemical reactions. Ag nanowires 7 show excellent catalytic activities and go toward the four electron oxygen reduction path, which can enhance significantly the working efficiency of the fuel cell. Hollow Ag/Pd nanoshells have been found to show unique catalytic activities when used as catalysts for electroless copper deposition (ECD) 8,9. ECD has gained considerable significance in the field of nanocircuits 10. The mechanism underlying ECD involves activation, which is a catalytic reaction triggered by active colloids on the surface of the substrates dipped into the electroless bath 11,12. The active catalyst acts as an electron carrier for the transfer of electrons from the reducing agent to the copper ions. Hence, the structure and composition of the catalyst can alter the deposition rate and reaction kinetics 13. In a previous study, the authors prepared spherical Pd nanoparticles and used them as activators for ECD 11,13,14. Additionally, for the electroless reaction, the authors synthesized solid nanocatalysts with Pd-rich shells from a Ag/Pd alloy by adding Ag particles to the microstructures of Pd nanoparticles; the nanocatalysts thus prepared showed enhanced catalytic activity 15.
In the present study, Ag/Pd nanorings were prepared via a displacement reaction; in this reaction, a small amount of palladium acetate (Pd(OAc)2) dissolved in acetate acid (CH3COOH) was allowed to galvanically
react with Ag nanoparticles. A small amount of the deposited Pd alloyed with Ag. The displacement process resulted in the formation of bimetallic nanorings. Energy-dispersive X-ray (EDX) element mapping was employed to measure the relative atomic distribution of Ag to Pd in the microstructure of the synthesized nanoring. The synthesized Ag/Pd nanorings were used as activators for ECD. Ag/Pd nanorings, pure Pd, and Ag nanoparticles were used as catalysts, and their effects on the kinetics of ECD were compared using results from quartz crystal microbalance (QCM) measurements.
1.2 Experimental
Ag/Pd nanorings were prepared in the following manner: initially, 25 μmoles of silver nitrate was gradually dissolved in 3 ml of a neutral aqueous solution of 0.1 M sodium n-dodecyl sulphate (SDS). Approximately 25 μl of 0.1 M NaBH4 was added dropwise to the abovementioned solution in order to
reduce the Ag ions to metallic Ag. The solution temperature was maintained at 30 °C. After 10 min, Ag nanoparticles were obtained. Approximately 2.496 mg of Pd(OAc)2 was gradually dissolved in 1 ml of pure
CH3COOH to afford an acidic Pd2+ solution, which was used for the subsequent galvanic displacement
reaction. Approximately 50 µl of this solution was added to 3 ml of a well-stirred solution of Ag nanotemplates at a constant temperature of 30 °C. After 70 min, the dispersed nanorings were collected. For a fair comparison of the catalytic properties, Ag and Pd nanoparticles were produced by the reduction of 25 μmoles of Ag ions and 0.56 μmoles of Pd ions, respectively, in 0.1 M SDS solution (3 ml).
The prepared nanoparticle solutions were placed on a carbon-coated copper grid and allowed to dry naturally; the characteristic shape and composition of the nanorings were then analyzed by a TEM (JEOL JEM-3000F) and EDX element mapping. X-ray diffraction (XRD) patterns of the prepared Ag/Pd nanorings were obtained using XRD spectroscopy (Shimadzu XD-3A apparatus equipped with a Cu anode).
The prepared Ag/Pd nanorings and solid Ag and Pd nanoparticles were then used as activators for ECD. In order to reduce the interaction of free SDS with the obtained nanoparticles during the ECD reaction, 1 ml of the nanoparticle solution was precipitated by high-speed centrifugation (15000 rpm) and redispersed in 1 ml of H2O; this process helped eliminate the free SDS. The electroless bath for the QCM measurements was
prepared from 0.44 M formaldehyde, 0.1 M EDTA, and 0.05 M CuSO4. The pH of the electroless bath was
adjusted to 12.3 using NaOH powder. Prior to the measurements, the electroless baths were maintained at 30 °C and bubbled with N2 for 15 min. The working electrode used for the QCM (Seiko EG&G QCA922)
measurement was prepared by coating 0.159 cm2 of the Au surface of the QCM substrate with a uniform layer comprising of the nanoparticle solution (2 µl). Au was sputtered on both sides of a Ti film (thickness: 10 nm) in the QCM substrate (Seiko EG&G QA20-A9M-Au), which was connected to an oscillator manufactured in-house. A Luggin capillary filled with saturated KCl solution separated the reference electrode (Hg/Hg2Cl2)
from the compartment that housed the electrolyte solution.
1.3 Results and discussion
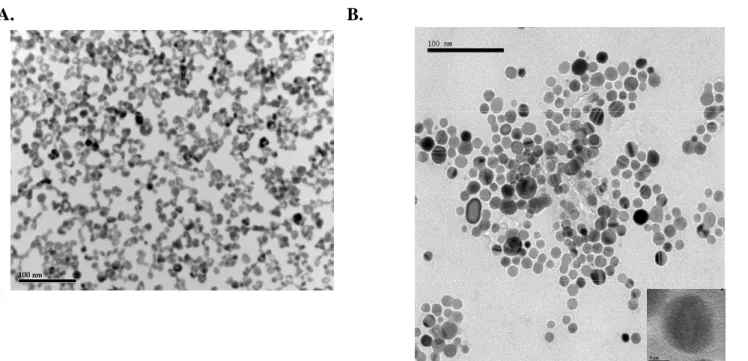
Figure 1A shows a typical TEM image of the morphorlogy of the as-synthesized nanomaterials. The nanorings were formed after Pd(OAc)2 was displaced with Ag nanoparticles, whose TEM image is shown in
Figure 1B. The TEM observations showed that Ag/Pd nanorings were successfully prepared by using the proposed method.
Figure 2 shows the XRD spectra of the prepared nanorings. The four peaks at 38.72°, 44.65°, 65.18°, and 78.18° were assigned to (111), (200), (220), and (311) diffraction planes, respectively, of the face-centered cubic (fcc) structure. The (111) diffraction peak of the Ag/Pd nanorings prepared by the displacement method was located between the (111) diffraction peaks of Ag and Pd in the standard spectrum. However, discrete and independent Ag and Pd peaks were not observed in the spectra of the nanorings. This implied that the nanorings prepared by using the proposed method were made of an alloy of Ag and Pd.
A. B.
. .
Figure 1. (A) TEM image of Ag/Pd nanorings prepared by this displacement reaction. (B) TEM image of Ag nanoparticles (the insert: high resolution TEM image).
30 40 50 60 70 80 220 200 111 Pd In te nsit y ( a rb itr a l unit ) 2-Theta (degrees) 088-2335 311 220 200 111 Ag 87-0597 78.188 65.176 44.653 38.718 Nanoring
Figure 2. XRD pattern of Ag/Pd nanorings, and standard XRD patterns of Ag and Pd.
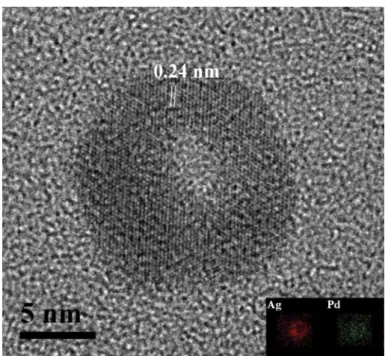
Additional supporting information on composition architecture and atomic distribution of the nanorings was obtained by the EDX element mapping. The inset image in Figure 3 presents the EDX patterns obtained from the element mapping of the nanorings while the high-resolution TEM (HR-TEM) image of the nanorings
(Fig. 3) was captured. Two signals with uniform distribution were obtained from the nanomaterials, and these were identified to be due to Ag and Pd. The exact composition and alloy components of the synthesized nanorings were thus determined.
HR-TEM was employed to provide deeper insights into the mechanism underying the formation of the Ag/Pd nanorings. Figure 3 shows a HR-TEM image in which the value of one lattice fringe spacing was detected to be approximately 0. 24 nm. This value was slightly lower than the lattice fringe spacing of the Ag (100) face. The deposition of Au on Ag nanoparticles during the displacement reaction 16 occurred initially and preferentially on high-energy {100} facets, and simultaneously, Ag dissoluted from the {111} facets. The Au atoms depsoited on the {100} facets quickly alloyed with the underlying Ag atoms. The alloy composition was obtained by EDX element mapping; from the EDX results, the atomic distribution in the nanoring was found to be uniform. The low lattice spacing of 0. 24 nm corresponding to the Ag (100) plane was plausibly due to alloy formation between Pd and Ag.
Figure 3. High resolution TEM image, and element mapping EDX patterns of Ag/Pd nanorings
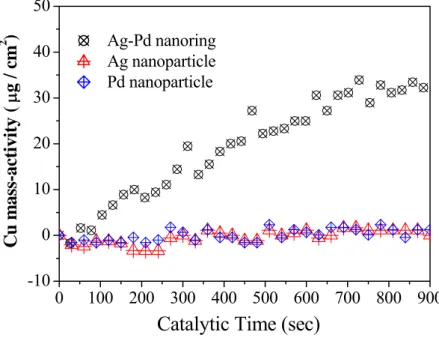
The prepared Ag/Pd nanorings were tested for their effectiveness as activators for ECD. Figure 4 shows a comparison of the results of QCM analyses carried out after in situ measurement of the catalytic activities of the Ag/Pd nanorings and the Ag and Pd nanoparticles in ECD. The deposition rates shown in Fig. 4 were recalculated from the changes in the electrode frequency by using Sauerbrey’s equation 11. Ag nanoparticles and Pd nanoparticles were found to be inactive for ECD.
The average ECD deposition rate observed during the preparation of the Ag/Pd nanorings was approximately 0.0357 μg⋅cm-2⋅s-1. The catalytic activity of the nanocatalysts was calculated from to the
following relation:
catalytic activity = deposition rate/(weight of the alloy catalyst).
Here, the weight of the Ag/Pd nanorings used as catalysts on the QCM electrode was estimated to be approximately 8 μg. The catalytic activity of the nanorings was 4.46 × 10⁻³ cm-2⋅s-1, thereby indicating that the
nanorings prepared by the proposed method can be successfully employed as catalysts for ECD. The enhanced activity was plausibly from an increase on the reactive area of the nanoring with a pore.
0 100 200 300 400 500 600 700 800 900 -10 0 10 20 30 40 50 Ag-Pd nanoring Ag nanoparticle Pd nanoparticle C u m a ss -acti v ity ( μ g / cm 2 )
Catalytic Time (sec)
Figure 4. Comparative QCM curves of ECD kinetic catalyzed with Ag-Pd nanorings, Ag nanoparticles, and Pd nanoparticles.
1.4 Conclusion
Ag/Pdnanorings were successfully prepared by a galvanic displacement reaction, in which a small amount of Pd(OAc)2 dissolved in CH3COOH was allowed to react slowly with previously synthesized Ag nanoparticles,
which acted as templates. The EDX element mapping showed that the prepared nanorings were alloys of Ag and Pd; these nanorings showed better catalytic activity for ECD than did Ag and Pd nanoparticles. These Ag/Pd nanorings thus constitute a novel class of catalysts for ECD.
1.5 Acknowledgement
The authors would like to thank the National Science Council of the Republic of China, Taiwan, for financially supporting this research under Contract No. NSC 98-2221-E-151-033-MY2.
1.6 References
1 Y. J. Xiong, B. Wiley, and Y. N. Xia, Angew. Chem.-Int. Edit. 46, 7157 (2007). 2 R. Xu, D. S. Wang, J. T. Zhang, and Y. D. Li, Chem.- Asian J. 1, 888 (2006). 3 A. R. Tao, S. Habas, and P. D. Yang, Small 4, 310 (2008).
4 N. Tian, Z. Y. Zhou, S. G. Sun, Y. Ding, and Z. L. Wang, Science 316, 732 (2007). 5 R. Narayanan and M. A. El-Sayed, J. Phys. Chem. B 108, 5726 (2004).
6 K. M. Bratlie, H. Lee, K. Komvopoulos, P. D. Yang, and G. A. Somorjai, Nano Lett. 7, 3097 (2007). 7 K. Ni, L. Chen, and G. X. Lu, Electrochem. Commun. 10, 1027 (2008).
8 C. L. Lee, C. M. Tseng, S. C. Wu, R. B. Wu, and K. R. Yang, Electrochim. Acta 53, 5905 (2008). 9 C. L. Lee, C. M. Tseng, S. C. Wu, and R. B. Wu, Electrochem. Solid State Lett. 11, D27 (2008).
10 H. Akahoshi, M. Kawamoto, T. Itabashi, O. Miura, A. Takahashi, S. Kobayashi, M. Miyazaki, T.
Mutoh, M. Wajima, and T. Ishimaru, Ieee Trans. Compon. Packaging Manufacturing Technol. A 18, 127 (1995).
11 C. L. Lee, Y. C. Huang, and L. C. Kuo, J. Solid State Electrochem. 11, 639 (2007).
12 C. L. Ma, W. C. Ye, X. Z. Shi, Y. L. Chang, Y. Chen, and C. M. Wang, Appl. Surf. Sci. 255, 3713
(2009).
13 C. L. Lee, Y. C. Huang, C. C. Wan, Y. Y. Wang, Y. J. Ju, L. C. Kuo, and J. C. Oung, J. Electrochem. Soc. 152, C520 (2005).
14 C. L. Lee and Y. C. Huang, Electrochem. Solid State Lett. 9, C196 (2006). 15 C. L. Lee, Y. C. Huang, and L. C. Kuo, Electrochem. Commun. 8, 1021 (2006).
2.
Porous Ag-Pd Triangle Nanoplates with Tunable Alloy Ratio for Catalyzing
Electroless Copper Deposition
2.1 Introduction
Electroless copper deposition (ECD) has gained considerable importance in view of the advancement in the circuit industry [1–3]. ECD is frequently used to deposit conductive copper on an insulating substrate. Activation, which is a catalytic reaction, is induced by active colloids present on the surface of substrates that are dipped into the ECD bath. An active catalyst acts as an electron carrier and transfers electrons from the reducer to the metal ions. Accordingly, the structure and composition of the activator can influence the deposition rate and the reaction kinetics [4–9]. Porous metallic nanoparticles are promising candidates for catalysis [10, 11]. In a previous study, the present authors prepared mesoporous Pd nanoparticles by chemical reduction and used these nanoparticles as activators for ECD [4, 12]. The activity of Ag-Pd alloy nanocatalysts with Pd-rich shells is improved when Ag is added to the microstructure of Pd nanoparticles [13]. In addition, large triangular Ag-Pd nanoplates show unique chemical characterization when they catalyzed ECD bath [14]. In this study, porous Ag-Pd triangular nanoplates with three alloy ratios were synthesized by a galvanic displacement reaction in which Ag triangular nanoplates reacted with Pd ions. These Ag-Pdnanoplates were then used as potential ECD activators. Quartz crystal microbalance (QCM) measurements were used to compare the ECD activities of (1) three Ag-Pd nanoplates with different compositions, (2) Ag nanoplates, and (3) Pd nanoparticles.
2.2 Experimental
Triangular Ag-Pd nanoplates with different compositions were prepared as follows. Initially, 0.05 ml of 0.05 M AgNO3 aqueous solution was added to 10 ml of 2.5 × 10⁻⁴ M aqueous sodium citrate solution. Then,
0.025 ml of 0.1 M NaBH4 was gradually added to a stirred solution of sodium citrate and AgNO3; a light
yellow Ag seed solution was obtained. Then, 1 ml of 0.05 M AgNO3 was added to 200 ml of 0.1 M
hexadecyltrimethylammonium bromide (CTAB). Next, 10 ml of 0.1 M ascorbic acid and 0.182 ml of the prepared Ag seed solution were slowly added to the aqueous solution of CTAB. Finally, 0.8 ml of 2 M NaOH aqueous solution was added to this CTAB solution to synthesize Ag triangular nanotemplates. A 200-ml solution containing the triangular Ag nanoplates synthesized earlier was precipitated by centrifugation at 4,000 rpm and redispersed in 30 ml of deionized water; this was done to reduce the interaction of free CTAB with the synthesized Ag-Pd nanoplates. Then, to prepare Ag18Pd1 nanoplates, ~1.25 mg of Pd(OAc)2 slowly
dissolved in 1 ml of pure acetic acid to obtain 5.56 × 10⁻³ M Pd2+ solution for the galvanic displacement reaction. At a fixed controlled temperature of 60°C, ~50 µl of 5.56 × 10⁻³ M Pd(OAc)2 (2.78 × 10⁻⁷ moles)
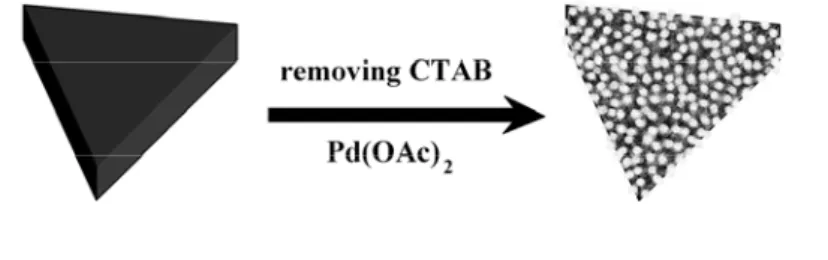
solution was added to 3 ml of a stirred solution of Ag nanoplates that did not contain free CTAB. Porous Ag-Pd nanoplates with an Ag–Pd molar ratio of 18:1 were obtained after 60 min. The pathway for this displacement synthesis is shown in Figure 1. Ag18Pd1.5 or Ag18Pd2 nanoplates can be obtained by using 50 µl
of Pd(OAc)2 solution with concentrations of 8.33 × 10⁻³ M (4.17 × 10⁻⁷ moles) and 1.112 × 10⁻² M (5.56 × 10⁻⁷
moles), respectively. Ag-Pd nanoplates were dipped onto the copper grid that was covered with a carbon film and dried naturally. The characteristic size and shape of the nanoplates were observed under a high-resolution transmission electron microscope (HRTEM; JEOL JEM-3000F) and with an energy-dispersive X-ray (EDX) spectroscope.
Figure 1. Schematic illustration of porous Ag-Pd nanoplates.
The synthesized Ag18Pd1, Ag18Pd1.5, and Ag18Pd2 nanoplates were then used as activators in ECD. The
ECD bath for the electrochemical QCM experiment contained 0.44 M formaldehyde, 0.1 M EDTA, and 0.05 M CuSO4 and its pH value was adjusted to 12.3 by adding white NaOH powder. The electrochemical
experiments were carried out in the ECD bath; the temperature of the bath was set at 30°C and it was bubbled with N2 for 15 min before performing the measurements. For QCM (SEIKO QCA922) experiment,
the working electrode was prepared by coating the 0.159 cm2 Au surface of the QCM substrate with a 3 µl solution of Ag-Pd nanoplatesuniformly. The QCM substrate (SEIKO EG&G QA20-A9M-Au) had a 100 Å titanium film on both sides, and the film was sputtered with gold. The substrate was connected to a homemade oscillator. The reference electrode (Hg/Hg2Cl2) was separated from the main solution
compartment by a Luggin capillary filled with saturated KCl solution.
For performing linear sweep voltammetry (LSV) measurements, 2 mg of Ag/Pd dry powder was dispersed in 0.5 ml of water. 30 µl of the resulting solution was dropped onto a glassy carbon electrode (GCE) with a surface area of 0.07 cm2 and heated at 40°C to evaporate the water. In order to prevent the catalyst from falling into the electrolyte during measurement, the GCE was rinsed with 30 µl 5wt% Nafion solution and heated at 40°C for 20 min. LSV anodic curves were measured by using a potentiostat (Autolab PGATAT30). A three-electrode cell comprising a GCE working electrode, a Pt counter electrode, and an Hg/Hg2Cl2 reference electrode was used for LSV measurements. The experiment was conducted at a scan rate
of 50 mV/s in an anodic bath, which contained 0.44 M formaldehyde and 0.1 M EDTA in an aqueous solution with pH 12.3.
2.3 Results and discussion
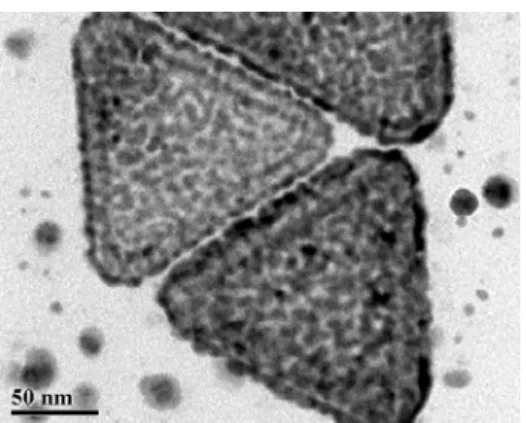
Figures 2A–2C show high-resolution TEM images of the Ag-Pd nanoplates prepared by the galvanic displacement method. From these images, it can be inferred that porous Ag-Pd nanoplates are obtained when different concentrations of Pd2+ are incorporated into Ag nanotemplates; this process is shown in Fig. 2D. A. B.
C. D.
Figure 2. TEM images of porous triangular Ag/Pd and Ag nanoplates: (A) Ag18Pd2 nanoplate, (B) Ag18Pd1.5 nanoplate,
(C) Ag18Pd1 nanoplate, and (D) triangular Ag nanotemplate.
EDX spectroscopy analyses of the porous nanoplates yielded information on the architecture. Fig. 3 shows the line-scan EDX spectrum obtained from the EDX analysis of a single Ag18Pd1 nanoplate. The two
strong random signals in the EDX spectrum were attributed to Pd and Ag. This indicates that the porous nanoplate prepared by this method has a mixed-alloy structure.
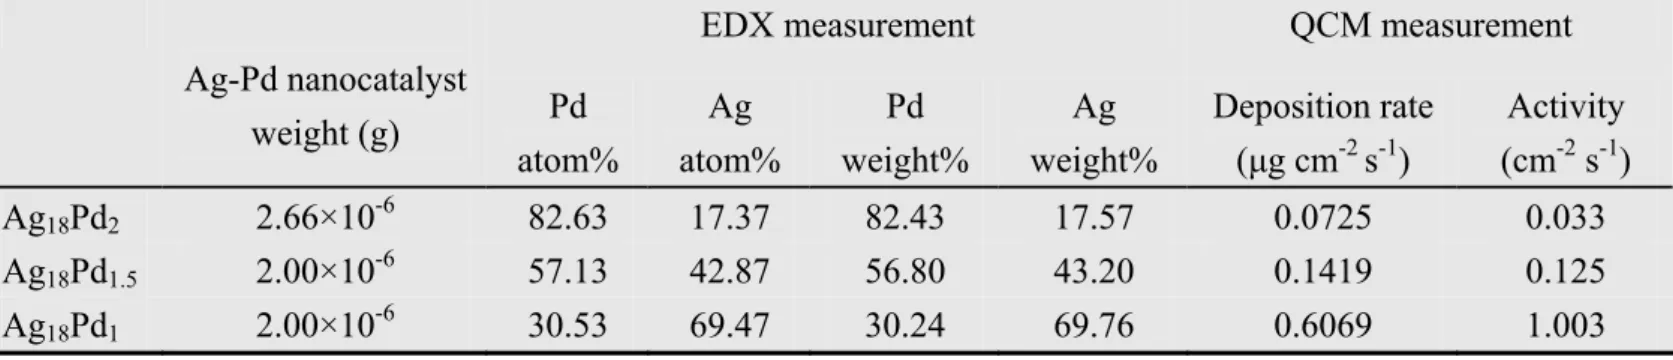
EDX measurement QCM measurement Ag-Pd nanocatalyst weight (g) Pd atom% Ag atom% Pd weight% Ag weight% Deposition rate (μg cm-2 s-1) Activity (cm-2 s-1) Ag18Pd2 2.66×10⁻⁶ 82.63 17.37 82.43 17.57 0.0725 0.033 Ag18Pd1.5 2.00×10⁻⁶ 57.13 42.87 56.80 43.20 0.1419 0.125 Ag18Pd1 2.00×10⁻⁶ 30.53 69.47 30.24 69.76 0.6069 1.003
Figure 3. Line-scan EDX spectrum of a single Ag18Pd1 nanoplate.
Table 1 summarizes the results of EDX analyses for nanoplates with various alloy ratios. The Pd content determined from the EDX analyses of Ag18Pd1, Ag18Pd1.5, and Ag18Pd2 nanoplates was 30.24, 56.80, and
82.43%, respectively, while the Ag content was 69.76, 43.20, and 17.57%, respectively. The results of the EDX analyses indicated that the amount of Pd in the nanoplates increases with an increase in the concentration of the
Pd2+ solution added during the synthesis of the nanoplate.
Table 1. EDX and QCM data of porous Ag18Pd2, Ag18Pd1.5, andAg18Pd1 nanoplates.
The porous Ag-Pd nanoplates were tested for use as activators in ECD. Figure 3 shows a comparison of the results of QCM analyses carried out after the in situ measurement of the catalytic activities of the Ag-Pd and Ag nanoplates and the Pd nanoparticles in the ECD bath. The deposition rates shown in Fig. 4 were recalculated by considering the changes in the electrode frequency by using the Sauerbrey equation [12]. The results of these calculations are listed in Table 1.
Pd nanoparticles obtained by the reduction of a 1.823 × 10⁻⁴ M solution of Pd ions were found to be
inactive during ECD. Further, as shown in Fig. 4, Ag nanoplates were inert in the electroless copper bath. The average ECD deposition rates were approximately 0.0725 μg⋅cm-2⋅s-1, 0.1419 μg⋅cm-2⋅s-1, and
0.6069μg⋅cm-2⋅s-1 when porous Ag-Pd nanoplates were prepared by using Pd2+ solutions of concentrations
0 100 200 300 400 500 -25 0 25 50 75 100 125 150
Catalysis time (s)
C
o
pper
m
a
ss density
(
μg /
cm
2)
Ag18Pd2 nanoplate Ag18Pd1.5 nanoplate Ag18Pd1 nanoplate Pd nanoparticle Ag nanoplateFigure 4. Comparative QCM curves of ECD catalyzed by porous Ag-Pd nanoplates, Ag nanoplates, and Pd nanoparticles.
From these values, we inferred that porous Ag-Pd nanoplates can be successfully used as a catalyst in ECD. Note that the electroless deposition rate and the catalytic activity of the nanoplates increased linearly with a decrease in the concentration of the Pd2+ solution used in the synthesis of the nanoplates. The catalytic activity of the nanocatalyst was calculated using the following formula:
Catalytic activity = deposition rate/(catalyst weight × Pd content in weight%)
Here, the Pd content was determined from the EDX analyses; the values listed in Table 1. The catalytic activities of the Ag18Pd2 and Ag18Pd1.5 nanoplates were 0.033 cm-2⋅s-1 and 0.125 cm-2⋅s-1, respectively. The
activity of the Ag18Pd1 nanoplate was 1.003 cm-2⋅s-1. Note that the order of the activities was as follows:
Ag18Pd1 nanoplate > Ag18Pd1.5 nanoplate > Ag18Pd2 nanoplate. This indicated that the Ag18Pd1 nanoplate
would have the maximum catalytic power in the ECD reaction.
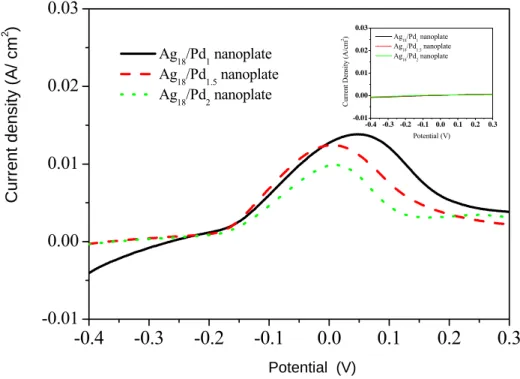
LSV measurements were performed to study the activity of Ag/Pd nanoplates in ECD in detail. Figure 5 shows the current-potential (I-E) curves for the oxidation of formaldehyde in the anodic bath. Firstly, as shown in the insert, all prepared Ag/Pd nanoplates showed inert activities in the alkaline NaOH solution. In the anodic bath with formaldehyde, oxidation was observed to have a starting potential of approximately -0.175 V. The oxidation current density increased slowly with the potential, and we observed a diffusion-limited current at approximately 0.02 V. The oxidation current density of formaldehyde in the ECD bath increased in the following order: Ag18Pd1 nanoplate > Ag18Pd1.5 nanoplate > Ag18Pd2 nanoplate. These
LSV results show that the high activity of Ag18Pd1 nanoplate was due to its high tendency to oxidize
-0.4 -0.3 -0.2 -0.1 0.0 0.1 0.2 0.3 -0.01 0.00 0.01 0.02 0.03 -0.4 -0.3 -0.2 -0.1 0.0 0.1 0.2 0.3 -0.01 0.00 0.01 0.02 0.03 C urrent D en si ty (A/ cm 2) Potential (V) Ag18/Pd1 nanoplate Ag18/Pd1.5 nanoplate Ag18/Pd2 nanoplate Curr e nt density ( A / cm 2 ) Potential (V) Ag18/Pd1 nanoplate Ag18/Pd1.5 nanoplate Ag18/Pd2 nanoplate
Figure 5. LSV curves of formaldehyde oxidation catalyzed by Ag/Pd nanoplates (insert: LSV curves of Ag/Pd nanoplates in NaOH solution.)
2.4 Conclusion
In conclusion, porous Ag-Pd nanoplates with different alloy ratios were prepared by a galvanic displacement reaction in which the added Pd(OAc)2 slowly reacted with the prepared Ag nanoplates as
templates. The catalytic activity of the triangular Ag-Pd nanoplates in ECD was observed by considering nanoplates with different alloy ratios. From QCM and LSV measurements, the Ag18Pd1 nanoplate was found
to have the maximum ECD activity and oxidation power for formaldehyde.
2.5 Acknowledgement
The authors would like to thank the National Science Council of the Republic of China, Taiwan, for financially supporting this research under Contract No. NSC 98-2221-E-151-033-MY2.
2.6 References
[1] S. Busato, A. Belloli, P. Ermanni, Inkjet printing of palladium catalyst patterns on polyimide film for electroless copper plating, Sens. Actuator B-Chem. 123 (2007) 840.
[2] K. Cheng, M.H. Yang, W.W.W. Chiu, C.Y. Huang, J. Chang, T.F. Ying, Y. Yang, Ink-jet printing, self-assembled polyelectrolytes, and electroless plating: Low cost fabrication of circuits on a flexible substrate at room temperature, Macromol. Rapid Commun. 26 (2005) 247.
[3] S. Olivier, T. Decorps, M. Bernard, P.H. Haumesser, G. Passemard, Physical investigation of the impact of electrolessly deposited self-aligned caps on insulation of copper interconnects, Microelectron. Eng. 85 (2008) 2051.
[4] C.L. Lee, Y.C. Huang, C.C. Wan, Y.Y. Wang, Y.J. Ju, L.C. Kuo, J.C. Oung, Synthesis of hydrophilic and hydrophobic Pd nanoparticles with in situ generated reducing agent and their application as activator for
electroless copper and nickel depositions, J. Electrochem. Soc. 152 (2005) C520.
[5] S. Gottesfeld, J. Beery, M. Paffett, M. Hollander, C. Maggiore, On the anodic-oxidation of formaldehyde during the electroless copper plating process, J. Electrochem. Soc. 133 (1986) 1344.
[6] J.F. Hamilton, R.C. Baetzold, Catalysis by small metal clusters, Science 205 (1979) 1213.
[7] I. Ohno, O. Wakabayashi, S. Haruyama, Anodic-oxidation of reductants in electroless plating, J. Electrochem. Soc. 132 (1985) 2323.
[8] R. Sard, Nucleation, growth, and structure of electroless copper deposits, J. Electrochem. Soc. 117 (1970) 864.
[9] J. Vandenmeerakker, On the mechanism of electroless plating 1. oxidation of formaldehyde at different electrode surfaces, J. App. Electrochem. 11 (1981) 387.
[10] H. Kang, Y. Jun, J.I. Park, K.B. Lee, J. Cheon, Synthesis of porous palladium superlattice nanoballs and nanowires, Chem. Mater. 12 (2000) 3530.
[11] H. Li, H. Lin, S.H. Xie, W.L. Dai, M.H. Qiao, Y.F. Lu, H.X. Li, Ordered mesoporous Ni nanowires with enhanced hydrogenation activity prepared by electroless plating on functionalized SBA-15, Chem.Mater. 20 (2008) 3936.
[12] C.L. Lee, Y.C. Huang, L.C. Kuo, Catalytic effect of Pd nanoparticles on electroless copper deposition, J. Solid State Electrochem. 11 (2007) 639.
[13] C.L. Lee, Y.C. Huang, L.C. Kuo, High catalytic potential of Ag/Pd nanoparticles from self-regulated reduction method on electroless Ni deposition, Electrochem. Commun. 8 (2006) 1021.
[14] C.L. Lee, C.M. Tseng, S.C. Wu, R.B. Wu, K.R. Yang, Activation of Ag/Pd triangular nanoshells with different sizes on depositing electrolessly copper, Electrochim. Acta 53 (2008) 5905.
3. Electrochemical synthesis of Pd–NiO nanoparticles in water-in-oil microemulsions
for activating electroless Ni deposition
3.1 Introduction
Electroless Ni–P deposition (END) is an important surface treatment in industry because it gives excellent protection against corrosion, hardness, and wear resistance 1, 2. Although several factors, such as the composition of the deposition solution 2-4 and the choice of ligand 5-7, affect the performance of an electroless process, the activation step is a key factor in controlling the rate and mechanism of electroless deposition8. The catalytic reaction is activated by an active colloid on the surface of a substrate dipped in an electroless deposition bath. The active catalyst is an electron carrier and transfers electrons from the reducer to the metal ions. The catalyzed metal is thus deposited on the active colloid 9, 10. In END, the initial activation step is
catalysis of an active colloid toward hypophosphite 11, 12; hypophosphite is a reducing agent for Ni2+ in END baths. In this anodic process, the bond between the H radical and the hypophosphite radical is first broken by an energy above the activation energy of 17.7 kcal mol-1 12. In comparison, the activation energy for metal reduction by a cathodic pathway is 6.5–7.5 kcal mol-1 12. The formed hypophosphite radical is then oxidized to yield phosphate, releasing an electron for Ni reduction. Simultaneously, the H radicals produced in the first step can form H2 gas by recombination 12. The choice of active colloid therefore plays an important role in
oxidation of NaH2PO2, using various bulk electrodes in an anodic END bath, as being Au < Ni < Pd < Co 13.
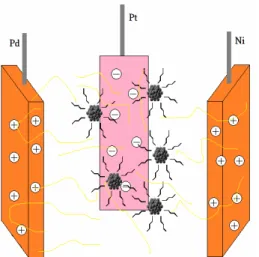
Along with Pd, Ni and Ni species in various oxidation states could possibly be used as an efficient and inexpensive catalyst for the END process in industry. In an earlier study, we prepared spherical Pd nanoparticles and used them as END activators 14. In this investigation, Pd–NiO nanoparticles with Pd- and NiO-enriched surfaces are synthesized using an electroreduction reaction in a water-in-oil microemulsion, in which Pd and Ni foils act simultaneously as anodes, and Pt foil is used as a cathode, in a tetrahydrofuran (THF) electrolyte containing a constant concentration of tetra-n-octylammonium bromide (TOAB) micelles and different trace amounts of H2O. By varying the concentration ratio of trace H2O to TOAB
([H2O]/[TOAB]) in the THF electrolyte, the micellar size can be altered, and Pd–NiO nanoparticles of
different sizes can be obtained. To investigate potential applications, the prepared Pd–NiO nanoparticles are used as potential END catalysts. Electrochemical quartz-crystal microgravimetry (EQCM) is used to study the deposition kinetics.
3.2 Experimental
Electrochemical preparation of Pd–NiO nanoparticles in water-in-oil microemulsions.
First, the electrolyte for this reaction was prepared. Approximately 0.546 g of TOAB white powder was dissolved in 10 mL of THF in a beaker. Then, 40 µL of distilled H2O was added to the THF solution. The
[H2O]/[TOAB] ratio was maintained at ~2.22. After stirring for 10 min, the electrolyte solution was ready. In
the electrochemical synthesis reaction, Pd foil (3 cm × 1 cm × 0.1 cm) and Ni foil (3 cm × 1 cm × 0.1 cm) were both used as the anode. Pt foil (3 cm × 1 cm × 0.1 cm) acted as the cathode. As shown in Fig. 1, when a constant current of 50 mA was passed through the solution at 35 °C for 50 min, dispersed Pd–NiO nanoparticles protected by TOAB were obtained. Using the same electrodes, applied current, and preparation time, larger Pd–NiO nanoparticles were prepared by increasing the [H2O]/[TOAB] ratio to 5.56; in contrast,
smaller nanoparticles were obtained when an electrolyte containing no distilled H2O ([H2O]/[TOAB] = 0) was
used. The characteristic morphologies and sizes of the prepared Pd–NiO nanoparticles were determined by transmission electron microscopy (TEM; FEI EO Tecnai F20 G2 MAT S-TWIN Field Emission Gun, FEI, Eindhoven, the Netherlands). The THF solution containing Pd–NiO nanoparticles was percolated to obtain a black powder, which was dried for 24 h before being subjected to X-ray photoelectron spectroscopy (XPS; Kratos Axis Ultra DLD) and X-ray diffraction analysis (XRD, Shimadzu XD-3A, Cu anode, Shimadzu, Kyoto, Japan).
and Ni foil in a H2O/TOAB/THF microemulsion.
Electrochemical measurement of activator.
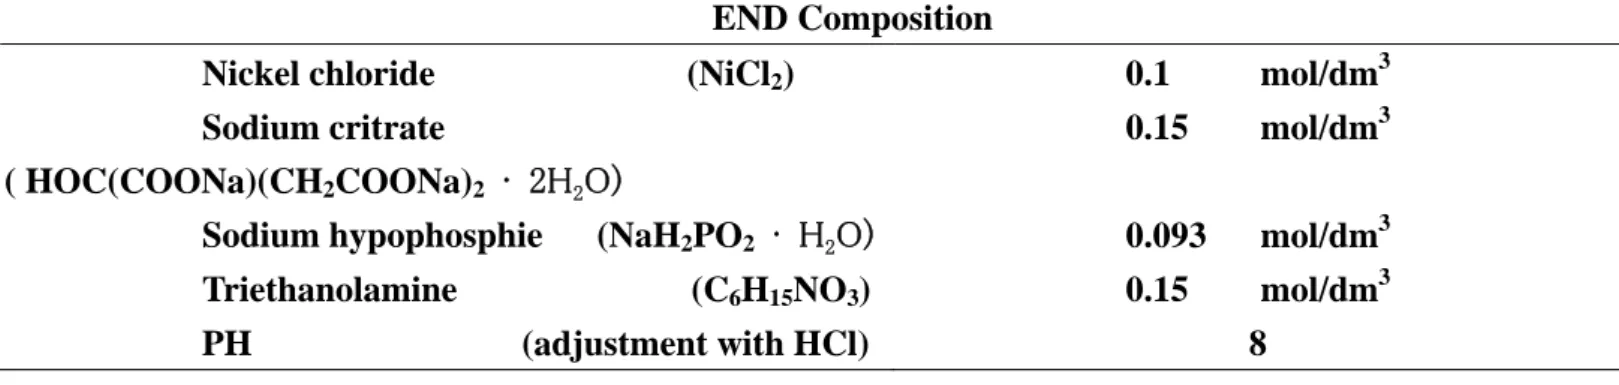
The synthesized Pd–NiO nanoparticles of different sizes were then used as END activators. The bath compositions for all the electrochemical experiments are shown in Table 1 and have been reported elsewhere
14, 15. The electrochemical experiments were carried out in baths controlled at 85 °C and N
2 gas was bubbled
through the solutions for 15 min prior to the measurements.
END Composition
Nickel chloride (NiCl2) 0.1 mol/dm3 Sodium critrate
( HOC(COONa)(CH2COONa)2 · 2H2O)
0.15 mol/dm3
Sodium hypophosphie (NaH2PO2 · H2O) 0.093 mol/dm3
Triethanolamine (C6H15NO3) 0.15 mol/dm3 PH (adjustment with HCl) 8
Table 1. The bath compositions of END.
For the kinetics experiments, an EQCM instrument consisting of a potentiostat (Autolab PGSTAT30, Metrohm Autolab, Runcorn, UK) and a quartz-crystal microbalance (QCM; SEIKO QCA 922, Seiko, Chiba, Japan) was used. The working electrode was prepared by applying 3 µL of a solution of the active Pd–NiO colloid uniformly on a 0.159 cm2 Au surface on the QCM substrate. The solutions were prepared using [H2O]/[TOAB] = 0 and 3.96 µg of alloy catalyst; [H2O]/[TOAB] = 2.22 and 8.22 µg of alloy catalyst; and
[H2O]/[TOAB] = 5.56 and 48.36 µg of alloy catalyst. The QCM substrate (SEIKO EG&G QA20-A9M-Au,
Seiko, Chiba, Japan) was sputtered on both sides with Au on top of a Ti film of thickness 100 Å, and was connected to a laboratory-built oscillator. The reference electrode (Hg/Hg2Cl2) was separated from the main
solution compartment by a Luggin capillary, which was filled with saturated KCl solution.
3.3 Results and discussion
Figure 2A presents a clear TEM image of the nanoparticles prepared in the THF electrolyte with [H2O]/[TOAB] = 0 as described in the experimental section. This figure demonstrates that ultrafine
nanoparticles were successfully prepared via this double-anode reaction, in which both Pd and Ni were used as anodes and inert Pt was used as the cathode in a water-in-oil microemulsion.
Figure 2. TEM images of Pd–NiO nanoparticles prepared in microemulsions with different [H2O]/[TOAB] ratios. (A) [H2O]/[TOAB]=0;(B) [H2O]/[TOAB]=2.22; and (C) [H2O]/[TOAB] = 5.56.
Typically, nanoparticles aggregate easily because of the attractive van der Waals forces between the particles. In this study, a dispersed distribution of these nanoparticles was observed on a carbon film on a Cu grid, even if magnetic Ni was a possible component. This indicates that the TOAB acts as a protecting agent for the particles, and can bond with particle surfaces and effectively separate the particles. The diameters of these nanoparticles were calculated on the basis of the TEM measurements, and the results are shown in Fig. 3A. The size distribution, which was narrow, was from 1.9 nm to 4.3 nm; the average diameter was 2.9 nm. The electrochemical synthesis of dispersed metal nanoparticles using a related strategy was first reported by Reetz and his group 16. They prepared 2.5–3.5-nm Pd–Ni nanoparticles of different alloy ratios by adjusting the applied-current density in a double-anode cell 17. It should be noted that in this investigation, the size of the prepared nanoparticles can be controlled by the [H2O]/[TOAB] ratio.
A. B.
2 4 6 8 10 12 0 5 10 15 20 25 30 35 40 Mean 5.6 nm Diameter (nm) Nu mb er s 16 C. 2 4 6 8 10 12 0 10 60 30 40 50 20 iameter (nm) Mean 2.9 nm Nu mb er s D2
4
6
8
10
12
0
5
10
15
20
25
30
35
40
Mean
7.5 nm
Numb
ers
Figure 3. The calculated diameters of Pd–NiO nanoparticles prepared in microemulsions with different [H2O]/[TOAB] ratios. (A) [H2O]/[TOAB] = 0; (B) [H2O]/[TOAB] = 2.22; and (C) [H2O]/[TOAB] = 5.56.
Figs. 2B and 2C show the TEM images of the nanoparticles prepared in microemulsions with [H2O]/[TOAB] ratios of 2.22 and 5.56, respectively. Comparison of these TEM images with that of Pd–NiO
nanoparticles prepared in pure THF solution (Fig. 2A) shows that larger nanoparticles were obtained with increasing [H2O]/[TOAB] values and that their shapes did not alter significantly. The corresponding sizes are
show in Figs. 3B and 3C. The sizes of the nanoparticles prepared in electrolytes with [H2O]/[TOAB] = 2.22
and 5.56 were 5.6 nm and 7.51 nm, respectively. The water-in-oil microemulsion approach has often been used to synthesize metal nanoparticles chemically 18. Reducing agents, including aqueous N2H4 and NaBH4,
in micelles were percolated into other micelles containing metal salts. A chemical reduction reaction therefore occurred and metal nanoparticles grew 18. In this study, in contrast, nanoparticles were successfully prepared via electrochemical reduction by the passage of a reducing current. As the [H2O]/[TOAB] value increased
from 0 to 5.56, the response in the cell voltage decreased from 499 V to 83 V. This decreased overpotential plausibly led to an increase in the size and in the yield of the prepared nanoparticles. Additionally, an increase in [H2O]/[TOAB] can prop up the micelles and further increase their core sizes. This is the other reason to
increase the nanoparticles’ size.
XRD analysis of the prepared nanoparticles yields information on the composition architecture. Figure 4 presents XRD spectra of the prepared 2.9-nm, 5.6-nm, and 7.5-nm nanoparticles. The diffraction peaks in all three cases are obtained at the same locations, i.e., between those of Pd (JCPDS No. 89-4897) and those of NiO (JCPDS No. 78-0643). This indicates that the nanoparticles prepared using this electrochemical method consist of a Pd–NiO alloy. Three peaks located at 39.81°, 46.35°, and 67.68° detected from dry powders of particles of diameter 7.5 nm are respectively assigned to the (111), (200), and (220) diffraction planes of the face-centred cubic (fcc) structure. It is worth noting that comparison with the standard spectra of Pd and NiO shows that the diffraction peaks of the Pd–NiO nanoparticles prepared by the electrochemical method were located close to those of Pd, indicating Pd-rich nanoparticles. The two peaks located at 33.5° and 59.97° indicate Pd oxidation. XPS analysis of the prepared nanoparticles yields further information on Pd and Pd oxidation. The inset in Fig. 4 shows XPS between 330 eV and 350 eV for the 5.6-nm nanoparticles.
30 40 50 60 70 80 330 335 340 345 350 5000 6000 7000 8000 9000 10000 11000 3d2/3 334.47 336.86 339.81 342.22 In te n si ty (C o u n ts ) Energy(eV) 3d2/5 2-Theta/degrees Pd/NiO Pd/NiO Pd/NiO PdO 2.9 nm 5.6 nm 7.5 nm PdO Intensit y/ a. u. (222) (311) (220) (200) (111) NiO 78-0643 (220) (200) (111) Pd 89-4897
Figure 4. XRD spectra of Pd–NiO nanoparticles of size 2.9 nm, 5.6 nm, and 7.5 nm. (Inset: XPS for Pd in 5.6-nm Pd–NiO nanoparticles.)
Two pairs of peaks, for Pd 3d5/2 and 3d2/, were obtained. For 3d5/2, the peak at 334.47 eV is assigned to
metallic Pd, and the other, located at 336.86 eV, is assigned to the oxidized state. These results are consistent with those in the literature for Pd metal and oxidized Pd 19. The significant difference in the peak area of Pd and that of PdO supports the composition of the dark nanoparticles being metallic Pd with trace oxidation. XPS was also used to confirm the existence of NiO. Figs. 5A, 5B, and 5C show the XPS from 840 nm to 890 nm for nanoparticles of size 2.9 nm, 5.6 nm, and 7.5 nm, respectively. The peak at 853.7 eV for 2P3/2 in all
three cases indicates that these nanoparticles were composed of two chemical states, i.e., Ni and NiO, consistent with the standard spectrum of Ni in NiO 20. This strongly suggests that the prepared nanoparticles are Pd–NiO nanoparticles. The XPS results were used to measure the elemental ratios of Pd to Ni (RPd/Ni)for
the prepared nanoparticles in all three cases. The RPd/Ni values were approximately 0.49, 0.36, and 0.39 for the
2.9-nm, 5.6-nm, and 7.5-nm nanoparticles, respectively. This indicates that the amount of Ni in the nanoparticles was slightly improved by increasing [H2O]/[TOAB]. Two pairs of peaks, for Pd 3d5/2 and 3d2/,
were obtained. For 3d5/2, the peak at 334.47 eV is assigned to metallic Pd, and the other, located at 336.86 eV,
oxidized Pd 19. The significant difference in the peak area of Pd and that of PdO supports the composition of the dark nanoparticles being metallic Pd with trace oxidation. XPS was also used to confirm the existence of NiO. Figs. 5A, 5B, and 5C show the XPS from 840 nm to 890 nm for nanoparticles of size 2.9 nm, 5.6 nm, and 7.5 nm, respectively. The peak at 853.7 eV for 2P3/2 in all three cases indicates that these nanoparticles
were composed of two chemical states, i.e., Ni and NiO, consistent with the standard spectrum of Ni in NiO 20. This strongly suggests that the prepared nanoparticles are Pd–NiO nanoparticles. The XPS results were used to measure the elemental ratios of Pd to Ni (RPd/Ni)for the prepared nanoparticles in all three cases. The RPd/Ni
values were approximately 0.49, 0.36, and 0.39 for the 2.9-nm, 5.6-nm, and 7.5-nm nanoparticles, respectively. This indicates that the amount of Ni in the nanoparticles was slightly improved by increasing [H2O]/[TOAB].
A. B.
C.
C.
Figure 5. XPS for Ni in Pd–NiO nanoparticles of size 2.9 nm, 5.6 nm, and 7.5 nm.
We then tested the feasibility of using the prepared Pd–NiO nanoparticles for END. It is worth noting that the activities of the prepared Pd–NiO nanoparticles are remarkable and higher than that of Pd nanoparticles in the early stages of END. An EQCM was used to measure the effect of catalyst alloyed using
840 850 860 870 880 890 500 550 600 650 700 750 800 2p1/2 In te rsi ty (C PS) 2p3/2 Ni in NiO
Binding energy (eV) 840 850 860 870 880 890
400 420 440 460 480 500 540 520 2p1/2 In te rsi ty (C PS) 2p3/2 Ni in NiO
Binding energy (eV)
840 850 860 870 880 890 400 420 440 460 480 500 520 540 2p1/2 Intersity (CPS) 2p3/2 Ni in NiO
NiO on the deposition kinetics. Fig. 6 shows the EQCM results; these results reflect the deposition rate in terms of open-circuit potential and oscillation frequency in END activated with the 2.9-nm, 5.6-nm, and 7.5-nm Pd–NiO nanoparticles. The results are summarized in Table 2.
-0.8 -0.6 -0.4 -0.2 0.0 0 20 40 60 80 100 120 0 20 40 60 0 20 40 60
(A)
2.9 nm
5.6 nm
7.5 nm
Ac tiv ity (1/c m 2 ) F ren q u en cy ch a n g e ( −Δ f / 1 e 3 Hz ) Po tentia l ( V )(C)
Time (sec)(B)
Figure 6. EQCM analyses of deposition kinetics of END catalyzed by Pd–NiO nanoparticles of size 2.9 nm, 5.6 nm, and 7.5 nm. Mean Size (nm) RPd/Ni Induction Period (sec) Mixed Potential (V) Deposition Rate (µg cm-2s-1) Catalystic Weight in 3µl Microemulsion (µg) Mass Activity (cm-2s-1) 2.9 0.49 17 -0.8 7.3 × 10⁻² 3.96 1.84 × 10⁻² 5.6 0.36 8 -0.82 10.6 × 10⁻² 8.22 1.28 × 10⁻² 7.5 0.39 2 -0.79 15.7 × 10⁻² 48.36 0.32 × 10⁻²
Table 2. The summary of END kinetic analyzed by EQCM.
In general, there is an induction period, which is the time necessary to reach the mixed potential at which steady-state metal deposition occurs 21. The reaction occurring in the induction period is a non-steady-state process. For END, in our earlier study, an induction time approaching 500 s was needed when Pd
nanoparticles were used as the catalyst 14. In contrast, for the Pd–NiO nanoparticles with RPd/Ni 0.49 prepared
in this experiment, a short induction time of around 17 s was needed to reach a mixed potential (-0.8 V), as observed in Fig. 6A, indicating that the END reaction can be triggered at an early stage when Ni is added to the Pd-based active catalyst.
In theory, the amount of Cu deposited is sensitive to frequency changes, as expressed by Sauerbrey’s equation 22 2 0 2F FA m − Δ = Δ μρ
where Δm (µg cm-2) is the increased mass after deposition, ΔF is the frequency change, F0 is the starting
frequency, A is the area of the Au substrate (0.159 cm2), μ is the shear modulus of quartz (2.947 × 10¹¹ g cm-1 s-2), and ρ is the density of quartz (2.648 g cm-3). Based on Sauerbrey’s equation, the deposition rates using different Pd–NiO nanocatalysts can be calculated. The obtained deposition rate (Fig. 6B) over the used catalyst weight is the mass activity, as shown in Fig. 6C. The calculated results are summarized in Table 2. Another surprising finding is that the electroless kinetics is influenced not only by the addition of NiO, but also by the diameter of the Pd–NiO nanoparticles. The addition of NiO shortened the induction time. A small catalyst size enhanced the slope of the active curve. For instance, for 2.9 nm, the slope increased after the induction period. As shown in Table 2, the mass activities of the 5.6-nm and 7.5-nm nanoparticles were 1.28 × 10⁻² cm-2 s-1, and 0.32 × 10⁻² cm-2 s-1, respectively. For the 2.9-nm nanoparticles, the mass activity was 1.84 × 10⁻² cm- 2s-1. In our previous study, based on the same bath composition, Pd nanoparticles were inactive around 500 s before triggering the END reaction 14. In this study, the Pd–NiO activator showed significant activity within 130 s and started at 20 s, as observed in Fig. 6C. A comparison of the mass activities of systems with various Pd–NiO nanoparticles indicates that the activity increases with decreasing nanoparticle size. The mass activity is the activity per surface atom. In general, for smaller nanoparticles, the surface atoms are coordinated by less core atoms. The surface atoms on the smaller nanoparticles thus show higher activity in catalysis. In this study, 2.9 nm nanoparticles showed the maximum activity in mass activity, indicating the higher activity per surface atom. This is probably because the surface atoms on the very fine particles become the dominant factor.
3.4 Conclusion
We have developed a novel method for the electrochemical preparation of Pd–NiO nanoparticles in a water-in-oil microemulsion, namely H2O/TOAB/THF. The size of the prepared nanoparticles was controlled
using the [H2O]/[TOAB] concentration ratio. In this study, the prepared Pd–NiO nanoparticles were
successfully used as active colloids for END. The electroless kinetics is influenced not only by the addition of NiO, but also by the diameter of the Pd–NiO nanoparticles. Adding Ni to active colloids can shorten the induction time. The alloy particle size can accelerate END reactions because steady-state deposition is achieved more quickly.
3.5 Acknowledgements
The authors would like to thank the National Science Council of the Republic of China, Taiwan, for financially supporting this research under Contract No. NSC 98-2221-E-151-033-MY2.
3.6 References
1 G. O. Mallory, and J. B. Hajdu, Electroless Plating: Fundamentals And Applications, Orlando (1990). 2 R. L. Zeller, and L. Salvati, Corrosion , 50, 457 (1994).
3 M. Bayes, I. Sinitskaya, K. Schell, and R. House, Trans. Inst. Met. Finish., 69, 140 (1991). 4 T. M. Harris, and Q. D. Dang, J. Electrochem. Soc., 140, 81 (1993).
5 G. F. Cui, N. Li, D. Y. Li, and M. L. Chi, J. Electrochem. Soc., 152, C669 (2005).
6 X. C. Wang, W. B. Cai, W. J. Wang, H. T. Liu, and Z. Z. Yu, Surf. Coat. Technol., 168, 300 (2003). 7 S. M. Mayanna, L. Ramesh, and B. S. Sheshadri, Trans. Inst. Met. Finish., 74, 66 (1996).
8 J. F. Hamilton, and R. C. Baetzold, Science, 205, 1213 (1979).
9 M. Paunovic, and M. Schlesinger, Fundamentals of Electrochemical Deposition John Wiley & Sons, Inc. (2006).
10 C. L. Lee, C. M. Tseng, R. B. Wu, and K. L. Yang, Nanotechnol., 19, 4 (2008). 11 L. M. Abrantes, and J. P. Correia, J. Electrochem. Soc. 141, 2356 (1994). 12 J. Vandenmeerakker, J. Appl. Electrochem., 11, 395 (1981).
13 I. Ohno, O. Wakabayashi, and S. Haruyama, J. Electrochem. Soc., 132, 2323 (1985).
14 C. L. Lee, Y. C. Huang, C. C. Wan, Y. Y. Wang, Y. J. Ju, L. C. Kuo, and J. C. Oung, J. Electrochem. Soc.,
152, C520 (2005).
15 C. L. Lee, Y. C. Huang, and L. C. Kuo, Electrochem. Commun., 8, 1021 (2006). 16 M. T. Reetz, and W. Helbig, J. Am. Chem. Soc., 116, 7401 (1994).
17 M. T. Reetz, W. Helbig, and S. A. Quaiser, Chem. Mater., 7, 2227 (1995). 18 I. Capek, Adv. Colloid Interface Sci. 110, 49 (2004),.
19 L. M. Neal, S. D. Jones, M. L. Everett, G. B. Hoflund, and H. E. Hagelin-Weaver, J. Mol. Cata. a-Chem.,,
325, 25 (2010).
20 J. F. Mulder, W. F. Stickle, P. E. Sobol, K. D. Bomben, and J. Chastain, Handbook of X-ray Phtoelectron
Spectroscopy, Perkin-Elmer Corporation, Minnesota, (1992).
21 M. Paunovic, J. Electrochem. Soc., 124, 349 (1977).
國際學術會議心得報告
計畫編號 NSC98-2221-E-151-033-MY2 計畫名稱 新化學鍍活化液合成與電化學特性之研究Ⅱ 與會人員及 服務機關 李建良 助理教授,國立高雄應用科技大學 會議時間地點 2010/11/1-2010/11/3, Tokyo, Japan 會議名稱 AsiaNano2010發表論文題目 Electrochemical Synthesis of Pd/Ni Nanoparticles and Their Application as Catalyst for Electroless Ni Deposition
本年度參與國際學術研討會為
AsiaNano2010會議在東京台場召開,本會議結合了
奈米材料先進製備技術、奈米粒子合成機構探討與前瞻應用,共多項會議,本
實驗室在會議中發表論文”
Electrochemical Synthesis of Pd/Ni Nanoparticles and Their Application as Catalyst for Electroless Ni Deposition“,本論文以雙陽極定電
流電化學法來製備不同粒徑之鈀/鎳奈米粒子,此電化學合成實驗裝置以鈀片和
鎳片同時做為陽極電極,鉑片做為陰極,電解液為含有四辛基溴化銨( TOAB )
之四氫呋喃溶液,以四辛基溴化銨包覆在聚集的金屬粒子外圍,製備出分散之
鈀/鎳合金奈米粒子,並經由調整加入微量去離水的含量,會改變粒子的結構,
可控制製備出奈米粒子的尺寸分佈,當加入的去離子水含量愈多,粒子尺寸愈
大,所製備出之粒徑分佈為
2.87 ~ 7.51 nm。此外,由於鎳易氧化的特性,在鈀/
鎳合金奈米粒子表面會有氧化鎳的生成。
以鈀/鎳合金奈米粒子在化學鍍鎳的沈積上,做為一新型催化劑,經比較所
製備出的鈀/鎳合金奈米粒子,發現最小尺寸的粒子具有最高的活性,為 1.84 ×
10
-2cm
-2.s
-1。本次參與的研討會為一國際性研討會,會議期間與相關學者討論
外,亦參加了多場專題演講,也見識了日本學者對實驗的嚴謹度。此次會議中,
接觸到了不少有關貴金屬材料在電化學能源與感測上的研究,從中吸收到奈米
材料在許多領域的應用與相關知識,收穫良多。
Electrochemical Synthesis of Pd/Ni Nanoparticles and Their Application as Catalyst for Electroless Ni Deposition
Chen-Chung Wu, Chia-Chieh Syu, Chia-Chen Yang, Chien-Liang Lee*
Department of Chemical and Materials Engineering, National Kaohsiung University of Applied Science,
Kaohsiung 807, Taiwan
Electroless nickel deposition is a catalytic reaction and an important industrial surface treatment method owing to its good corrosive protection, hardness and wear resistance [1]. Although the performance of an electroless process is influenced by numerous factors, including the composition of the deposition solution [2] and the choice of ligands [3], catalysis is the key factor in controlling the rate and mechanism of
electroless deposition [4]. (C) (B) (E) (A) (D)
In this study, Pd/Ni nanoparticles of various diameters were prepared in an electrochemical cell composed of two anodes and one cathode, at which both of Pd and Ni foil were simultaneously used as anodic
electrodes and Pt foil was used as cathodic foil. Their images observed by transmission electron microscope (TEM) are shown in Figure 1.
These alloy nanoparticles are electroreduced from nickel and palladium ion dissolved from Pd and Ni anodes and their diameters were controlled from 2.87 nm to 7.51 nm by the added H2O amount in a
tetrahydrofuran electrolyte containing micelles of tetraoctylammonium bromide (TOAB). The size of TOAB micelle has to be regulated. As the H2O amount increased, the structure of the TOABmicelle changed; this caused the Pd/Ni nanoparticles to grow and be easily oxidized to NiO on the surface. This result was confirmed by X-ray photoelectron spectrum. Pd/Ni nanoparticles with oxidized surface were thus obtained.
Then, these alloy nanoparticles were tested as a
novel activator for electroless nickel deposition and the activities were in-situly measured by electrochemical quartz crystal microbalance. In a comparison between
the activities of Pd/Ni nanoparticles, the smallest Figure 1. TEM images of electroreduced Pd/Ni nanoparticles in TOAB/THF solution with various H2O amount. (A) 0 μl; (B) 20 μl; (C) 40 μl; (D) 80 μl; (E) 100 μl
nanoparticles had maximum activity, which reached to 1.84 × 10⁻² (1/cm-2s-1).
References
[1]. R. L. Zeller, Corrosion 50 (1994) 457.
[3]. G. F. Cui, N. Li, D. Y. Li, M. Li, J. Electrochem. Soc. 152 (2005) C669. [4]. J. F. Hamilton , R. C. Baetzold Science 205 (1979) 1213.
國科會補助計畫衍生研發成果推廣資料表
日期:2011/09/17國科會補助計畫
計畫名稱: 新化學鍍活化液合成與電化學特性之研究(II) 計畫主持人: 李建良 計畫編號: 98-2221-E-151-033-MY2 學門領域: 電化學無研發成果推廣資料
98 年度專題研究計畫研究成果彙整表
計畫主持人:李建良 計畫編號:98-2221-E-151-033-MY2 計畫名稱:新化學鍍活化液合成與電化學特性之研究(II) 量化 成果項目 實際已達成 數(被接受 或已發表) 預期總達成 數(含實際已 達成數) 本計畫實 際貢獻百 分比 單位 備 註 ( 質 化 說 明:如 數 個 計 畫 共 同 成 果、成 果 列 為 該 期 刊 之 封 面 故 事 ... 等) 期刊論文 0 0 100% 研究報告/技術報告 1 1 100% 研討會論文 1 1 100% 篇 論文著作 專書 0 0 100% 申請中件數 0 0 100% 專利 已獲得件數 0 0 100% 件 件數 0 0 100% 件 技術移轉 權利金 0 0 100% 千元 碩士生 6 6 100% 博士生 0 0 100% 博士後研究員 0 0 100% 國內 參與計畫人力 (本國籍) 專任助理 0 0 100% 人次 期刊論文 11 11 100% 研究報告/技術報告 0 0 100% 研討會論文 1 1 100% 篇 論文著作 專書 0 0 100% 章/本 申請中件數 0 0 100% 專利 已獲得件數 0 0 100% 件 件數 0 0 100% 件 技術移轉 權利金 0 0 100% 千元 碩士生 0 0 100% 博士生 0 0 100% 博士後研究員 0 0 100% 國外 參與計畫人力 (外國籍) 專任助理 0 0 100% 人次其他成果