行政院國家科學委員會專題研究計畫 成果報告
社會網路與流行病學之研究(第 3 年)
研究成果報告(完整版)
計 畫 類 別 : 個別型
計 畫 編 號 : NSC 98-2112-M-004-001-MY3
執 行 期 間 : 100 年 08 月 01 日至 101 年 07 月 31 日
執 行 單 位 : 國立政治大學應用物理研究所
計 畫 主 持 人 : 蕭又新
計畫參與人員: 碩士班研究生-兼任助理人員:蔡羽青
碩士班研究生-兼任助理人員:張雁茹
碩士班研究生-兼任助理人員:李恩慈
碩士班研究生-兼任助理人員:方玠人
碩士班研究生-兼任助理人員:劉彥宏
碩士班研究生-兼任助理人員:陳原孝
碩士班研究生-兼任助理人員:易敬剛
碩士班研究生-兼任助理人員:林丁順
博士班研究生-兼任助理人員:謝佳宏
報 告 附 件 : 出席國際會議研究心得報告及發表論文
公 開 資 訊 : 本計畫可公開查詢
中 文 摘 要 : 本計劃從理論模型與實際收集的數據探討人際網路的各種特
性, 以運動員的競賽網路為例, 具有非常強烈的小世界特性,
但與現有的理論模型有很大的差別, 而社區結構的考量應可
以改善目前理論與實際的差異. 我們亦完成了流行疾病於理
論 BA (EBA)模型傳染行為的探討, 但誠如上述所言, 人際網
路與理論模型有很大的差別, 所以流行病的傳染行為與網路
之間的定量與定性行為仍有許多探討的空間.
中文關鍵詞: 複雜網路, 冪次定律, 小世界, BA (EBA)模型, 社區結構,
群聚係數, 最短路徑, 隨機網路, 流行病學
英 文 摘 要 :
英文關鍵詞:
Small-world topology, scaling crossover, and community structure
in table-tennis competition networks
Jia-Hong Sie 1, Yen-Hung Liu 2, Yin-Jiun Tseng 1, Yuo-Hsien Shiau 2* and Ray-May Hsung 3 1
Institute of Biomedical Engineering, National Yang-Ming University, Taipei, Taiwan, ROC
2
Graduate Institute of Applied Physics, National Cheng-Chi University, Taipei, Taiwan, ROC
3
Department of Sociology, National Cheng-Chi University, Taipei, Taiwan, ROC
Abstract. We studied table-tennis competition networks in Taiwan from 2004 to 2011. It is interesting to find the scaling-crossover phenomenon and small-world topology. The small-world quotient for each year was much larger than 1, which indicated that the table-tennis competition network in Taiwan was a highly-optimized structure, where round-robin and knockout matches constitute the competition network. Excellent players won more games, thus who had more opportunities to compete with more opponents. Therefore, the effect of “strong-get-stronger” will lead to the power-law distribution in the regime of high connections. However, the scaling-crossover phenomenon can be observed in the regime of low connections, which is owing to the special design for preliminaries, thus fully connected cliques embedded in the network topology can be expected. On the contrary, the theoretical BA model (Barabási and Albert, 1999) displayed the power-law distribution in the whole regime, and the small-world quotient was not much larger than 1. The main difference between the competition and BA networks was the problem of fully connected cliques. Finally, with detailed discussions we may say that there are two different kinds of preferential attachment in human-made competition networks, including inner- and inter-tournament preferential attachments. Therefore, the topology of table-tennis competitions is a network with community structure.
Keywords: sports sociology, small world, scaling crossover, community structure, table tennis
1. Introduction
We have always been involved in many social circles including family, schoolmates, colleagues, and so on. Network analysis has been used to study the complex human relationship that represent the vertices and connections as human and the relationship between human, respectively. For example, the Milgram’s experiment which is a well-known result of small world in human society (Milgram, 1967). In the past decades, there were many different kinds of networks have been studied, such as movie actor collaboration and power grids (Barabási and Albert, 1999). Besides, Uzzi and Spiro (2005) proposed an interesting hypothesis about the relationship between the small-world effect and the performance in the network of musical collaboration. Network analysis has also been widely studied in many different fields, e.g., the citation network in papers indexed by SCI (Price, 1965), co-authorship network of neuroscientists (Barabási et al., 2001), the vulnerability analysis of power grids in Swiss (Eusgeld et al., 2009), human functional connectivity (Achard et al., 2006; Eguıluz et al., 2005), the development of early human brain (Fan et al., 2011) and the small-world topology might provide a clinically useful diagnosis index in patient with Alzheimer’s disease (Stam et al., 2007; Supekar et al., 2008). Based upon previous results, people can identify three different but related dimensions of the small-world phenomenon: Structural, Process, and Psychological dimensions (Schnettler, 2009). In this study, we discussed the structural and process dimensions of the amateur table-tennis competition network in Taiwan from 2004 to 2011.
2001; Watts and Strogatz, 1998). The most striking among them is the emergence of a network topology with a power-law distribution (Barabási and Bonabeau, 2003), and the corresponding exponent γ is restricted in a narrow interval (2 γ 3) (G.Grigorov, 2005; Goh et al., 2001; Goh et al., 2002). The structure of these networks originating a power-law distribution of node’s degree is scale-free, where highly and loosely connected nodes coexist. Self-organized networks with a scale-free topology, due to their relevance for allowing the understanding of the origin of their common organization and the presence of an underlying growth mechanism, have attracted in recent years. In particular, the scaling-crossover phenomena have been reported on the relationship between people, like movie actor collaboration network and co-authorship network of neuroscientists (Barabási and Albert, 1999). Owing to that, it would be interesting to study network structures of human-made tournaments. To our knowledge, network representation in sports has been less studied.
In our modern life, sports not only relaxes our stress but also are regard as an important symbol of national pride of which citizens achieving high grade of international stage of sports. The competitions in sports play an important role to improve the technique of athletes and maintain amateur players’ passion. Situngkir (2007) studied head-to-head games in Professional Tennis Tournament of Grand Slams held yearly with four games of tournaments (United States Open, Australian Open, Wimbledon, and French Open), where the small-world topology was reported (Situngkir, 2007). More recently, Passos et al. (2011) evaluated the utility of network methods for understanding human interpersonal interactions in the team sport of water polo, and successful and unsuccessful performance outcomes were related to intra-team coordination patterns of play (Passos et al., 2011). In this study, we concerned how the tournament design affects properties of the table-tennis competition network. Our datasets are from Cyber Table Tennis Club (CTTC) in Taiwan. This organization has tried to promote table-tennis rating games for amateur players in Taiwan for the past years. Based upon our network analyses, it is interesting to find the scaling-crossover phenomenon and small-world topology. The small-world quotient for each year was much larger than 1, which indicated that the table-tennis competition network in Taiwan was a highly-optimized structure, where round-robin and knockout matches constitute the competition network. Excellent players won more games, thus who had more opportunities to compete with more opponents. Therefore, the effect of “strong-get-stronger” will lead to the power-law distribution in the regime of high connections. However, the scaling-crossover phenomenon can be observed in the regime of low connections, which is owing to the special design for preliminaries, thus fully connected cliques embedded in the network topology can be expected. Besides, the overlap players have high interest in table-tennis competitions. Due to the competition training, the overlap players could become excellent players. Therefore, the overlap players are crucial for the network topology. Concerning on the theoretical BA model (Barabási and Albert, 1999), this model displayed a power-law distribution in the whole regime, and the small-world quotient was not much larger than 1. The main difference between the competition and BA networks was the problem of fully connected cliques. In addition, the mean exponent of the power-law distribution in competitions and in BA model was equal to 1.98 and 2.63, respectively. In this study, with the consideration of overlap/excellent players we may say that there are two different kinds of preferential attachment in human-made competition networks, including inner- and inter-tournament preferential attachments. Therefore, the topology of table-tennis competitions is a network with community structure.
The remainder of this paper is organized as follows. Section 2 is the description about CTTC database. The analyzing methods as well as theoretical model including degree distribution, clustering coefficient, average shortest path length, small-world quotient, and BA model are introduced in Section 3. Results of competition and BA networks are given in Section 4, and discussions are in Section 5. Section 6 contains concluding remarks.
2. Database
Our datasets are from CTTC (http://www.cybertabletennis.com/portal/) in Taiwan. CTTC has tried to promote table-tennis rating games for amateur players in Taiwan since the past few years. The records for players in every competition games were recorded. The competition games in each tournament include
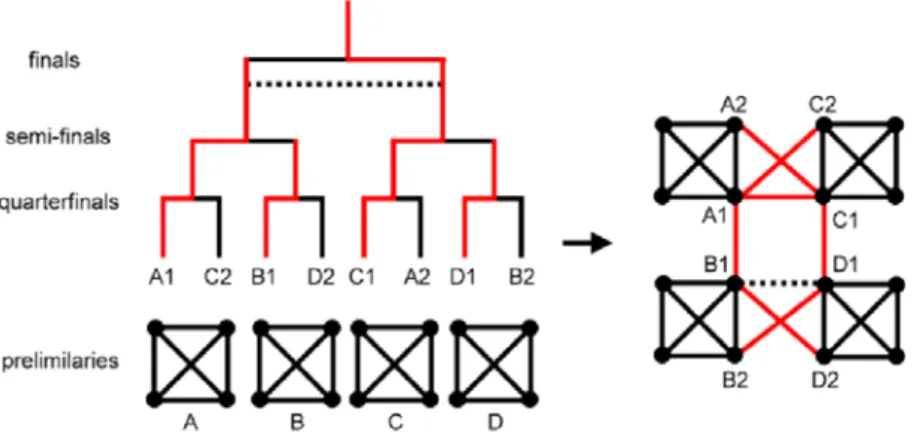
round-robin and single elimination (i.e., knockout) stages. At the round-robin stage, the players are divided into several groups. For example, if there are 16 players, they will be divided into four groups. The group winner and runner-up go to the single elimination stage. As we mentioned above, there are 8 players in the first round of the single elimination stage. Only the winners can enter the next round. The left part in Fig. 1 illustrates the tournament design including round robin, quarterfinals, semi-finals, and final. Note that the number of groups and the number of players in a group may be different for different tournaments. Owing to the justice, directors will keep the same number of participants in a preliminary group.
3. Methodology
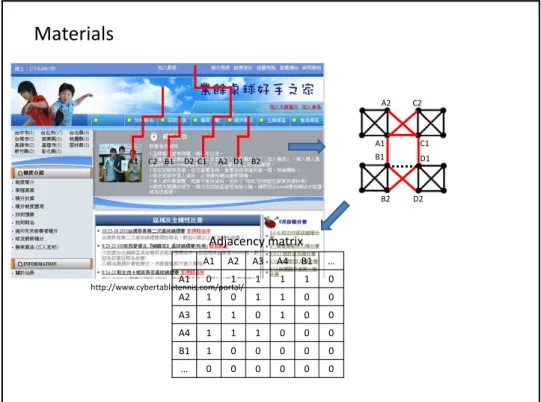
The right part in Fig. 1 exhibits the structure of network in a tournament. Capital A, B, C, and D represent the preliminary groups. Symbols A1 and A2 is the winner and runner up in the group A, respectively. The black and red lines represent round-robin and single elimination games, respectively. The additional competition for third and fourth places is denoted as the dashed line. Vertices (black points) represent a player a , where i is a positive integer indicate the index of a player. The connection a is equal to 1 when the appearance of a head-to-head match between players a and a . Otherwise, a is equal to 0 when player a and player a do not have a match. Eventually, the un-weighted and un-directed adjacency matrix, A a , is constructed for the later analysis. Please note that in each year there were many table-tennis tournaments in Taiwan. Thus, the adjacency matrix A contains the whole year’s information of head-to-head matches. In the following we will introduce how to calculate statistical indices/topological structures of table-tennis networks.
Figure 1 Network representation of a tournament
3.1 Degree distribution
Each element of matrix A stands for the connection or disconnection between different players. ki is the vertex a has the number of connections to all the other vertices, which is defined as k ∑ a , where n is the total number of vertices. The probability distribution of the dataset k is called the degree distribution. Based on many empirical studies, the degree distribution approximately follows a straight line in the log-log plot,
P ~k . 1 It is known that the exponent γ is an important index which is strongly related to connective mechanisms
coefficient, CC , is calculated by the average of clustering coefficient CC for the vertex a , which is the number of exact connections between the first neighbours, E , divided by the total possible connections with all first neighbours, k k 1 2⁄
CC number of pairs of neighbors of i that are connectednumber of pairs of neighbors of i k kE 1 2
. 2
CC represents the level of the local transitivity. However, the cases of k 1 should be excluded from the calculation of the local clustering coefficient because CC 0 0⁄ is undefined. Therefore, the mean of local clustering coefficients for k larger than 1 is a quantitative index for the entire network,
CC 1 N G CC 1 N G E k k 1 2 3
where N G means the number of nodes with degree larger than one and G is the graph of the entire network.
Another index is the global clustering coefficient CC which describes the level of cliquishness in the entire network (Newman, 2010). The mathematical formula can be written as
CC number of connected triples number of triangles 3 ∑ E
∑ k k2 1 . 4 From Eq. (3) and Eq. (4), it is clear to distinguish the different physical meaning between CC and CC . The former case is the average values of the local transitivity for each node. The other case is directly obtained from the fraction of transitivity in the entire network.
3.3 Average shortest path length (PL)
In the network theory d means the shortest path length between any two vertices i and j. Thus the propagation of information flow for the overall network is strongly related to the average shortest path length (PL) which can be written as (Newman, 2003):
PL n n1 1 d
,
. 5
3.4 The small world Quotient (Q)
It is known that high transitivity and short global separation (Watts and Strogatz, 1998) are two main properties of small-world networks. For the random networks, low transitivity and short global separation are expected. Based on these two characteristics, the quantitative index named small-world quotient (Q) is used to describe the deviation between the actual (or analyzed) network and the random network.
Q CC ratio PL ratio
CC ⁄CC
PL ⁄PL 6 For example, the network we want to analyse is a small-world network, the CC ratio shown in numerator will exceed 1.0 and the PL ratio in denominator will be close to 1.0. Therefore, the small world Q should be larger than one. High Q means this analysed network with a well-optimized efficient structure for the propagation of information flow.
In addition, under the condition 〈k〉 ≫ ln n , where 〈k〉 denotes the average degree, the two properties of random networks can be obtained theoretically by these two approximate formula CC~ 〈k〉 n⁄ and PL~ ln n ln 〈k〉⁄ (Albert and Barabasi, 2002; Watts and Strogatz, 1998), where 〈k〉 and n represent the mean connections of a vertex and the total number of vertex, respectively. However, if 〈k〉 ≫ ln n is not satisfied, the numerical approach will be necessary. Our approach, in
principle, follows the random rewiring procedure reported by Watts and Strogatz (1998). In order to compare differences between actual and random networks under the same conditions, both n and 〈k〉 of the random network are equal to those of the actual network. Then the ensemble average of CC , CC and PL for random networks can be obtained through one hundred simulations (Milo et al., 2002). Moreover, the small world Q has two different meanings, where one is for the local case and the other is for the global case.
3.5 BA model
The first model to present the power-law degree distribution was addressed by Barabási and Albert (1999). The features of the model are network growth and preferential attachment. The network growth means starting with a small number (m ) of nodes, at each time step, we add a new node with m m edges which link the new node to m different nodes already existed in the network. The preferential attachment describes how we choose the nodes connected by the new node. This model assume the probability Π that a node i connected with the new node depends on the degree k of node i, such that
k ∑ kk . 7 After T time steps, there will be m T nodes and mT edges in this network. In this study, we will keep m m 3 for generating BA networks to compare with actual networks. In order to find differences between actual and BA networks under the same conditions, both n and k of the actual network are equal to those of the BA network.
4. Results
4.1 Table-tennis competition networks
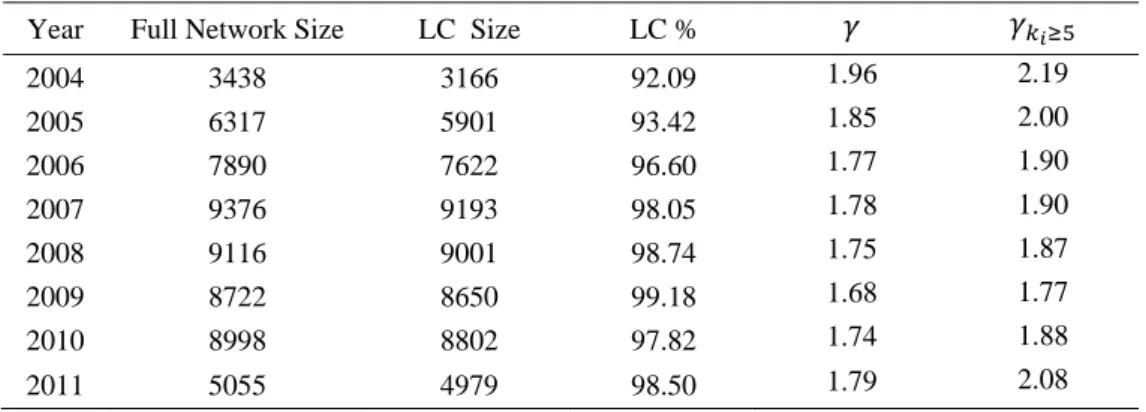
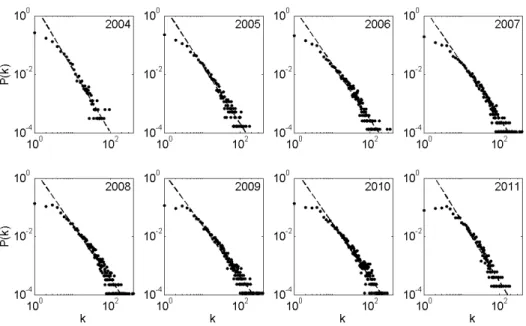
Fig. 2 illustrates the power-law distributions for table-tennis competition networks in Taiwan from 2004 to 2011. The number of nodes and the exponent γ for every year are listed in Table 1. In particular, the fitting straight lines shown in Fig. 2 are for cases of k larger than 5 and the average values of γ are about 1.98±0.21.
Table 1 A list of network size and power-law exponents for different years Year Full Network Size LC Size LC %
2004 3438 3166 92.09 1.96 2.19 2005 6317 5901 93.42 1.85 2.00 2006 7890 7622 96.60 1.77 1.90 2007 9376 9193 98.05 1.78 1.90 2008 9116 9001 98.74 1.75 1.87 2009 8722 8650 99.18 1.68 1.77 2010 8998 8802 97.82 1.74 1.88 2011 5055 4979 98.50 1.79 2.08
Figure 2 The degree distributions of table-tennis competition networks from 2004 to 2011 Table 2 displays theoretical and numerical results for random networks including CC , CC and PL. It shall be noted that the criterion〈k〉 ≫ ln n obviously cannot be satisfied according to the datasets from 2004 to 2006, thus CC and PL are just expressed as numerical results. Moreover, in order to compare the differences between theoretical and numerical results from 2007 to 2011 we also list the percentage of error (ε%) in Table 2, in which the error for CC and PL is smaller than 1% and 10%, respectively. The mean value shown in Table 2 is the results of the ensemble average of CC , CC and PL through one hundred simulations. It can be expected that CC is very close to CC because the random network exhibits a homogeneous structure.
Table 2 Theoretical and numerical results for random networks
Year ln 〈 〉 LC % CC CC Path Length PL
Mean* Mean* Approx. ε% Mean* Mean* Approx. ε% 2004 8.06 5.33 99.51 1.708E-3 1.710E-03 5.00
2005 8.68 7.71 99.95 1.310E-3 1.304E-03 4.48 2006 8.94 9.41 99.99 1.232E-3 1.240E-03 4.24
2007 9.13 10.84 100.0 1.169E-3 1.179E-3 0.90 1.168E-03 4.09 3.83 6.75 2008 9.11 12.11 100.0 1.335E-3 1.345E-3 0.78 1.336E-03 3.91 3.65 7.11 2009 9.07 13.65 100.0 1.579E-3 1.578E-3 0.09 1.582E-03 3.75 3.47 8.03 2010 9.08 13.32 100.0 1.515E-3 1.513E-3 0.09 1.510E-03 3.78 3.51 7.78 2011 8.51 11.13 100.0 2.224E-3 2.235E-3 0.47 2.234E-03 3.79 3.53 7.31
* The average of one hundred simulations ε% Mean∗ Approx. /Approx. 100
Based upon results shown in Table 2, we can calculate the small world Q for table-tennis competition networks. It is obvious to find that both local/global Q are much larger than 1 for every year. Thus competition networks display well-optimized efficient structures between table-tennis players. In addition, local Q is larger than global Q because of CC with a lower value compared to that of CC , and PL is quite similar for both cases of competition and random networks. The higher transitivity for competition networks rather than that of random networks is due to the preliminaries based upon the round-robin match. All players are fully connected cliques in the same group (Fig. 1), which will cause
local/global clustering coefficients with much higher values. Concerning on the previous researches about movie actor collaboration network (Watts and Strogatz, 1998), CC , PL, and γ is 0.79, 3.65, and 2.3 0.1, respectively. Thus we may say that movie actor collaboration network exhibits a more well-optimized efficient structure compared to that of the competition network.
Table 3 The statistical indices of the table-tennis competition network in Taiwan Year LC size Clustering Coefficient (CC) Path Length PL Small World Q
Local Global Random* Actual Random* Local Global 2004 3166 0.2394 0.1297 0.0017 5.55 5.00 126.4 68.4 2005 5901 0.2387 0.1154 0.0013 4.83 4.48 169.2 82.2 2006 7622 0.2598 0.1105 0.0012 4.69 4.24 190.8 80.6 2007 9193 0.2727 0.1123 0.0012 4.42 4.09 215.7 89.2 2008 9001 0.3454 0.1104 0.0013 4.29 3.91 235.6 75.3 2009 8650 0.3757 0.1190 0.0016 4.11 3.75 216.8 68.6 2010 8802 0.3472 0.1149 0.0015 4.23 3.78 204.8 68.1 2011 4979 0.4176 0.1484 0.0022 4.39 3.79 162.2 57.4
* The ensemble average of one hundred simulations
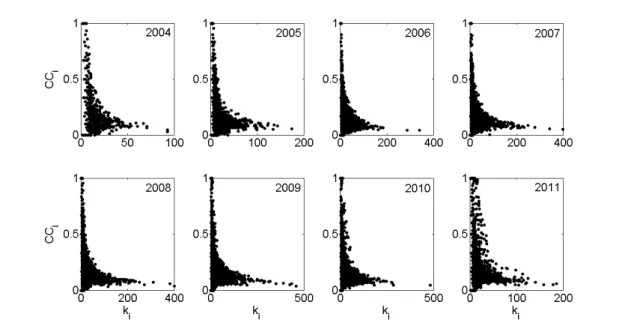
The scatter diagrams for CC versus k from 2004 to 2011 are illustrated in Fig. 3. In general, a smaller (larger) k is corresponding to a higher (lower) CC . The smallest k with CC =1 represents those players were losers who never played single elimination games. In contrary, excellent players should have much more connections with other players. Thus a lower CC for excellent players can be expected. According to the results shown in Fig. 3, we plot the histogram of CC for competition networks in Fig. 4, and the expected U-shape-like spectra are observed from 2004 to 2011.
Figure 4 The histograms of CCi in competition networks, where the bin size is 0.1
4.2 BA model
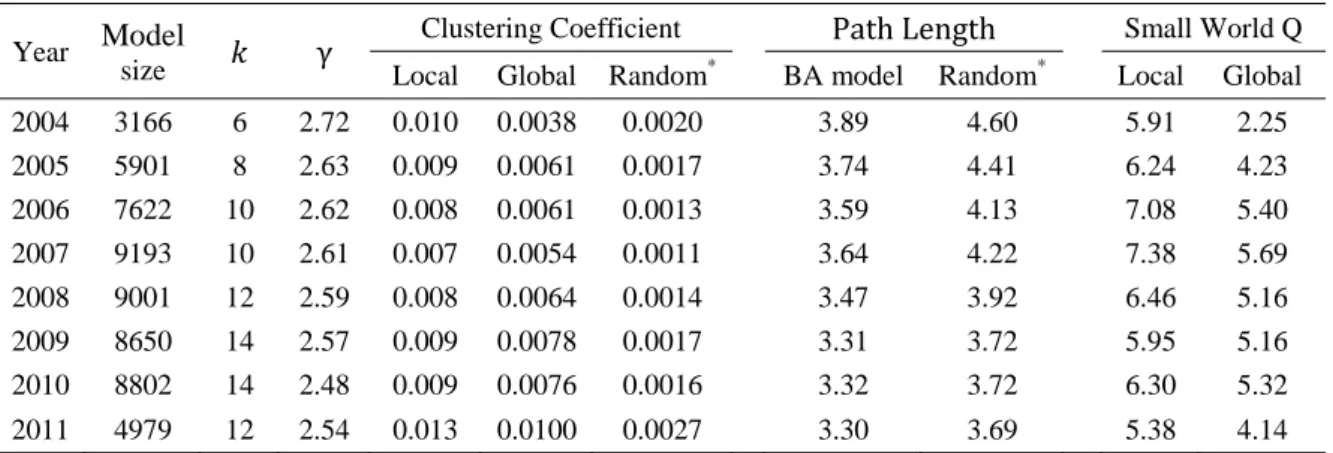
Fig. 5 illustrates the degree distributions for BA networks, which are used to compare with results of competition networks shown in Fig. 2. According to these double-logarithm plots, it is obvious to find that the degree distribution obeys the power-law behaviour. Table 4 summarizes the characteristics of BA networks from 2004 to 2011, where we keep both n and k of the BA network are equal to those of the competition network. The average values of γ are about 2.63 0.9 which is larger than that of the competition network (i.e., γ 1.98 0.21). Both local/global Q are larger than 1 for every year. In addition, local Q is larger than global Q because of CC with a lower value compared to that of CC , and PL is quite similar for both cases of BA and random networks. Based upon results shown in Table 3 and Table 4, we may conclude that BA networks cannot well explain the results of table-tennis competition networks. The small world Q in BA networks is much lower than that of competition networks. The main reason is resulted from local /global clustering coefficients with much lower values in BA networks.
Table 4 The statistical indices of the BA network Year Model
size γ
Clustering Coefficient Path Length Small World Q Local Global Random* BA model Random* Local Global 2004 3166 6 2.72 0.010 0.0038 0.0020 3.89 4.60 5.91 2.25 2005 5901 8 2.63 0.009 0.0061 0.0017 3.74 4.41 6.24 4.23 2006 7622 10 2.62 0.008 0.0061 0.0013 3.59 4.13 7.08 5.40 2007 9193 10 2.61 0.007 0.0054 0.0011 3.64 4.22 7.38 5.69 2008 9001 12 2.59 0.008 0.0064 0.0014 3.47 3.92 6.46 5.16 2009 8650 14 2.57 0.009 0.0078 0.0017 3.31 3.72 5.95 5.16 2010 8802 14 2.48 0.009 0.0076 0.0016 3.32 3.72 6.30 5.32 2011 4979 12 2.54 0.013 0.0100 0.0027 3.30 3.69 5.38 4.14
Figure 5 The degree distributions of BA networks from 2004 to 2011
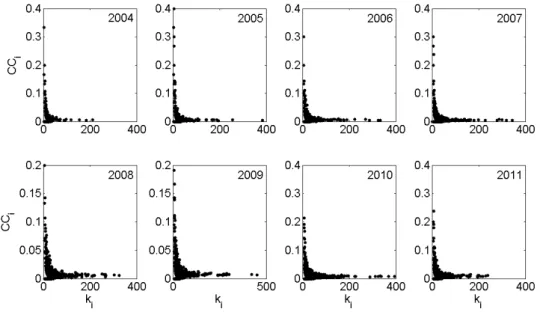
Figure 6 The scatter diagrams for ki versus CCi in BA networks
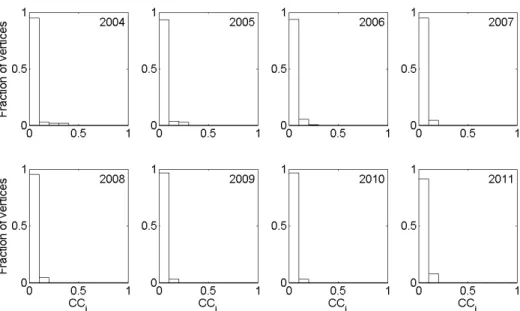
Fig. 6 shows the scatter diagrams for CC versus k . The maximum CCi obtained from 2004 to 2011 is below 0.4 which indicates no fully connected cliques can be observed in BA networks. Fig. 7 illustrates the histograms of CC for BA networks, and L-shape-like spectra are observed for every year.
Figure 7 The histograms of CCi in BA networks, where the bin size is 0.1
5. Discussion
In BA networks the preferential attachment is a key mechanism to generate the scale-free degree distribution (Fig. 5). However, in competition networks scaling crossover phenomena are observed in Fig. 2. In the high k regime it represents players won more games, thus who had more opportunities to compete with more opponents. We call this phenomenon as “strong-get-stronger”. Compared to social competitive systems, “rich-get-richer” is a well-accepted result, and which indeed reflects the result of preferential attachment. However, in competition networks the preliminary is a special design for generating the group winner, which enforces players to join the round-robin match. Therefore, the concept of “strong-get-stronger” cannot be applied to the round-robin match. Owing to that, it can be expected that this tournament design will disturb the scale-free degree distribution in the low k regime. The critical degree (i.e., k 5) shown in Fig. 2 represents the maximum number of players in the round-robin match should be equal to 6. And this is why we consider γ is a more suitable parameter to explain the preferential attachment in competition networks. Moreover, the preliminary will make high transitivity in between players and the small world Q would be much larger than 1.
Round-robin and knockout matches constitute competition networks. In network topology round-robin matches will make players fully connected. Thus there are small regular networks embedded in competition networks. Knockout matches are for finding excellent players with the consideration of shortening the competition time. Topological connections from knockout matches would be different from regular connections in round-robin matches. High clustering and low degree can be observed in round-robin matches. On the contrary, knockout matches will result in low clustering and high degree. In Fig. 4 U-shape-like histograms well reflect these two designs for table-tennis competitions.
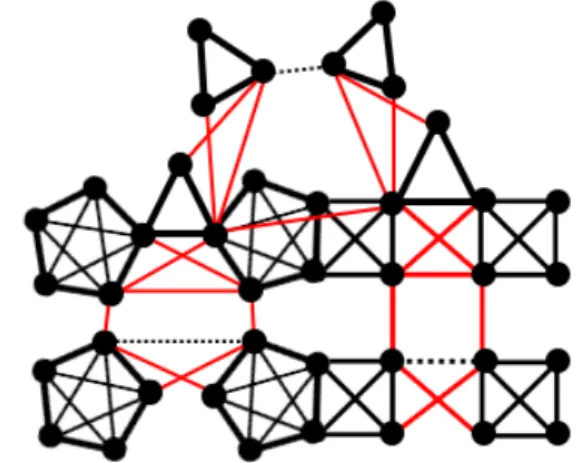
Fig. 8 schematically illustrates the network topology including three tournaments based upon our datasets. The numbers of players in the round-robin match for these three tournaments are 3, 4, and 5, respectively. Thus small regular networks including triangle, square, and pentagon patterns can be observed. When group winner and runner up are generated, knockout matches will come up. Hence the dynamics of “strong-get-stronger” proceeds till to the final competition. Besides, the overlap players in Fig. 8 mean that these players have high interest in table-tennis competitions. Due to the competition training, the overlap players could become excellent players. Therefore, the overlap players shown in
these three tournaments are crucial for the network topology. Because of them, a giant/optimized network can be expected.
Figure 8 The network topology including three tournaments
The network topology created by round-robin matches is very similar as that of the artist collaboration network (Uzzi and Spiro, 2005). However, CC is, respectively, equal to 0.345 0.029 and 0.120 0.013 for the artist collaboration network and the competition network. The lower clustering coefficient in our case is mainly resulted from the dynamics of “strong-get-stronger” in knockout matches, which will reduce the clustering effect. It shall be noted that the overlap artists mean these artists are quite famous, thus the preferential collaboration as well as a giant/optimized network can be expected. In the point of view in topology, we may understand the overlap players in the competition network play the same role as the overlap artists in the artist collaboration network. Therefore, there are two different kinds of preferential attachment in human-made competition networks. One is the “strong-get-stronger” process to find excellent players in a tournament, which is named inner-tournament preferential attachment. The other is inter-tournament preferential attachment because of the connection of different tournaments through overlap players. Owing to that, the topology of table-tennis competitions is a network with different communities, where groups of nodes within the same community connections are dense, but between different communities connections are sparser. So far, many social and biological networks with community structure have been reported (Flake et al., 2002; Holme et al., 2003; Redner, 1998; Sporns et al., 2004; Xie et al., 2004). More recently, Li and Maini (2005) proposed an evolving network model with community structure based on the inner-community preferential attachment and inter-community preferential attachment mechanisms (Li and Maini, 2005). A scale-free distribution (γ 3) in the whole k regime can be generated from their theoretical results as well as numerical simulations. Therefore, their community model still cannot well explain the topology of table-tennis competitions in Taiwan.
In this study we didn’t involve the psychological dimension to explain the formation of small-world topology in competition networks. However, it would be interesting to find out the psychology of excellent and overlap players. For example, it is well known that the necessary conditions for excellent players are not only good skills but also strong mind. Therefore, the psychological condition of excellent players is a key factor for the preferential attachment in competition networks. Besides, what is the attraction for the overlap players to attend different tournaments? We think ping-pong habit is the first choice, but providing free prize for all players is a popular method for promoting amateur table-tennis
6. Conclusion
We studied table-tennis competition networks in Taiwan from 2004 to 2011. According to datasets from CTTC, it is interesting to find the power-law (or scale-free) distribution and small-world topology. The mean exponent of the power-law distribution from 2004 to 2011 was 1.98, and the small-world Q for each year was much larger than 1. These results indicated that the table-tennis competition network in Taiwan was a highly-optimized structure, where round-robin and knockout matches constitute the competition network. Excellent players won more games, thus who had more opportunities to compete with more opponents. Therefore, the effect of “strong-get-stronger” will lead to the power-law distribution in the high k regime. However, the scaling crossover phenomenon can be observed in the low k regime, which is owing to the special design for preliminaries. U-shape-like plots shown in Fig. 4 can well reflect these two different competitions. Besides, in this study we also discussed the differences between the theoretical BA model and competition network. Due to the requirement of preferential attachment in BA model, the power-law distribution in the whole k regime can be observed. We found that the mean exponent for BA model was 2.63 and the small-world quotient was smaller than 10 (not much larger than 1). L-shape-like plots shown in Fig. 7 indicated no fully connected cliques, thus no small regular networks in BA topology. Finally, with the consideration of overlap/excellent players we may say that there are two different kinds of preferential attachment in human-made competition networks, including inner- and inter-tournament preferential attachments. Therefore, the topology of table-tennis competitions is a network with community structure. We wish this study may raise researchers’ interest in sport sociology.
References
Achard, S., Salvador, R., Whitcher, B., Suckling, J., Bullmore, E., 2006. A Resilient, Low-Frequency, Small-World Human Brain Functional Network with Highly Connected Association Cortical Hubs. The Journal of Neuroscience 26, 63-72.
Albert, R., Barabasi, A.-L., 2002. Statistical mechanics of complex networks. Reviews of Modern Physics 74, 47-97. Barabási, A.-L., Albert, R., 1999. Emergence of Scaling in Random Networks. Science 286, 509-512.
Barabási, A.-L., Bonabeau, E., 2003. Scale-Free Networks. Scientific American 288, 60-69.
Barabási, A.L., Jeong, H., Neda, Z., Ravasz, E., Schubert, A., Vicsek, T., 2001. Evolution of the social network of scientific collaborations. arXiv:cond-mat/0104162v1.
Eguıluz, V.M., Chialvo, D.R., Cecchi, G.A., Baliki, M., Apkarian, A.V., 2005. Scale-Free Brain Functional Networks. Physical Review Letters 94, 018102.
Eusgeld, I., Kroger, W., Sansavini, G., Schlapfer, M., Zio, E., 2009. The role of network theory and object-oriented modeling within a framework for the vulnerability analysis of critical infrastructures. Reliability Engineering and System Safety 94, 954-963.
Fan, Y., Shi, F., Smith, J.K., Lin, W., Gilmore, J.H., Shen, D., 2011. Brain anatomical networks in early human brain development. Neuroimage 54, 1862-1871.
Flake, G.W., Lawrence, S., Giles, C.L., Coetzee, F.M., 2002. Self-Organization and Identification of Web Communities. Computer 35, 66-70.
G.Grigorov, M., 2005. Global properties of biological networks. Drug Discovery Today 10, 365-372.
Goh, K.-I., Kahng, B., Kim, D., 2001. Universal Behavior of Load Distribution in Scale-Free Networks. Physical Review Letters 87, 278701.
Goh, K.-l., Oh, E., Jeong, H., Kahng, B., Kim, D., 2002. Classificaion of scale-free networks. Proceedings of the National Academy of Sciences of the United States of America 90, 12583-12588.
Li, C., Maini, P.K., 2005. An evolving network model with community structure. Journal of Physics A: Mathematical and General 38, 9741-9749.
Milgram, S., 1967. The Small-World Problem. Psychology Today 1, 61-67.
Milo, R., Shen-Orr, S., Itzkovitz, S., Kashtan, N., Chklovskii, D., Alon, U., 2002. Network Motifs: Simple Building Blocks of Complex Networks. Science 298.
Newman, M., 2010. Network: An Introduction. Oxford University Press.
Newman, M.E.J., 2003. The Structure and Function of Complex Networks. SIAM Review 45, 167-256.
Passos, P., Davids, K., Araújo, D., Paz, N., Minguéns, J., Mendes, J., 2011. Networks as a novel tool for studying team ball sports as complex social systems. Journal of Science and Medicine in Sport 14, 170-176.
Price, D.J.d.S., 1965. Networks of Scientific Papers. Science 149, 510-515.
Redner, S., 1998. How popular is your paper? An empirical study of the citation distribution The European Physical Journal B 4, 131-134.
Schnettler, S., 2009. A structured overview of 50 years of small-world research. Social Networks 31, 165-178. Situngkir, H., 2007. Small World Network of Athletes: Graph Representation of the World Professional Tennis
Player. Available at SSRN: http://ssrn.com/abstract=1001917.
Sporns, O., Chialvo, D.R., Kaiser, M., Hilgetag, C.C., 2004. Organization, development and function of complex brain networks. Trends in Cognitive Sciences 8, 418-425.
Stam, C.J., Jones, B.F., Nolte, G., Breakspear, M., Scheltens, P., 2007. Small-World Networks and Functional Connectivity in Alzheimer's Disease. Cerebral Cortex 17, 92-99.
Strogatz, S.H., 2001. Exploring complex networks. Nature 410, 268-276.
Supekar, K., Menon, V., Rubin, D., Musen, M., Greicius, M.D., 2008. Network Analysis of Intrinsic Functional Brain Connectivity in Alzheime's Disease. PLoS Computation Biology 4, e1000100.
Uzzi, B., Spiro, J., 2005. Collaboration and Creativity: The Small World Problem. American Journal of Sociology 111, 447-504.
Watts, D.J., Strogatz, S.H., 1998. Collective dynamics of 'samll-world' networks. Nature 343, 440-442.
Xie, H., Yan, K.-K., Maslov, S., 2004. Effects of Community Structure on Search and Ranking in Information Networks. arXiv:cond-mat/0409087v1.
Shanghai University of Sport
399 Chang Hai Road, Shanghai, P. R. China, 200438 Tel: +86 21 5125 3259
Fax: +86 21 5125 3259 http://www.sus.edu.cn
June 29, 2011
Dear
You-Hsien Shiau,
We kindly invite you to present the International Symposium on Computer
Science in Sport (IACSS2011), which will be held at Shanghai University of
Sport, Shanghai, China from 21 to 24 September 2011.
We have great pleasure to inform you that your abstract entitled
“The Effect of
Small World on Competition; the Case of Table Tennis in Taiwan,
2004-2011” (Number : IACSS2011_190)
has been accepted as oral
presentation. The detail of your presentations will be announced on the website
once the conference schedule finalized.
Please check the attached file (
IACSS2011 Information
) for your reference and
register before 20 July, 2011. For more information, please follow the website
http://www.sttrc.cn/en/iacss11/index.html.
We are looking forward to see you in Shanghai this September.
Yours faithfully,
Prof. Jian Dai
Shanghai University of Sport
399 Chang Hai Road, Shanghai, P. R. China, 200438 Tel: +86 21 5125 3259
Fax: +86 21 5125 3259 http://www.sus.edu.cn
Notes:
Please see attached documents for your information.
Please prepare your PowerPoint and poster according to below request:
For oral presentations: Each accepted paper will be allotted 10 minutes for
English oral presentation followed by 5 min questions and discussion.
For poster presentations: Each accepted poster will be assigned to a poster
session. Poster should including introduction、methods/methodology、results
& discussion of your paper and not exceed the size of 0.9m x 1.2m
If you want your papers to be included in The Proceedings of the 2011
International Symposium on Computer Science in Sport, please submit full
papers in form of WORD to [email protected] as a attachment according to the
paper format(temple) before July 20, 2011. Please use your paper number as
your document’s name, For example
IACSS2011_001.doc
Please fill the conference register form and send to [email protected] before
July 20, 2011.
For more information, please follow the website or refer to “IACSS2011
Information”
2012/10/9
The small‐world on amateur competitions: the case of table
tennis in Taiwan, 2004‐2011
Jia‐Hong Sie, Yen‐Hung Liu, Yin‐Jiun Tseng and Yuo‐Hsien Shiau
What is the small‐world?
Small‐world effect: Small‐world Networks: Duncan J. Watts, Steven H. Strogatz. 1998. Collective dynamics of 'small‐world' networks. Nature 393, 440‐442. 1. high transitivity 2. short global separation • It’s popularly known as six degrees of separation! • “The fact that most pairs of vertices in most networks seem to be connected by a short path through the network.” Newman,M.E.J., 2003. The structure and function of complex networks. SIAM Review 45, 167–256.Small world Q Cluster Coefficience ratio CC ratio Path Length ratio PL ratio Brian Uzzi, J.S., 2005. Collaboration and Creativity: The Small World Problem. American Journal of Sociology 111, 447‐504. Stanley Milgram. 1967. The small‐world problem. Psychology Today 1 (1):61‐67 1. CC ratio ↑⇒ Q ↑ 2. PL ratio ↓⇒ Q ↑
2012/10/9
Materials
http://www.cybertabletennis.com/portal/ A1 C2 B1 D2C1 A2D1 B2 A2 A1 C2 C1 D1 D2 B2 B1 A1 A2 A3 A4 B1 … A1 0 1 1 1 1 0 A2 1 0 1 1 0 0 A3 1 1 0 1 0 0 A4 1 1 1 0 0 0 B1 1 0 0 0 0 0 … 0 0 0 0 0 0 Adjacency matrixMethods and Results
Year Full Network Size LC Size LC % 2004 3438 3166 92.09 2.187 2005 6317 5901 93.42 2.003 2006 7890 7622 96.60 1.902 2007 9376 9193 98.05 1.898 2008 9116 9001 98.74 1.866 2009 8722 8650 99.18 1.774 2010 8998 8802 97.82 1.876 2011 5055 4979 98.50 2.079
Table 1: The largest component of the amateur competition of table tennis in Taiwan
Degree distribution: ~ 2.187 2.003 1.902 1.898 1.866 1.774 1.876 2.079
The exponent is obtained by the linear regression analysis based on the least square function.
The “rich‐get‐richer” is an observable result in the social competitive system that is corresponding with “strong‐get‐ stronger” in sport competitive system.
2012/10/9
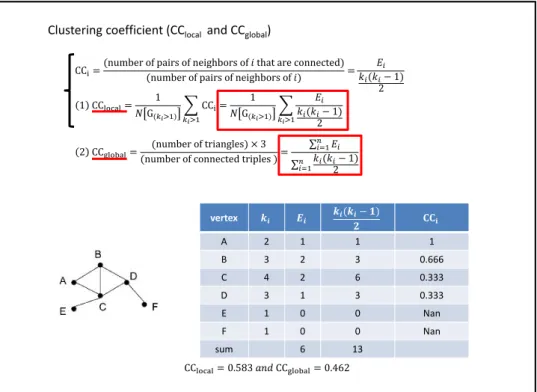
CC number of pairs of neighbors of that are connected number of pairs of neighbors of 1 2 1 CC 1 G CC 1 G 1 2Clustering coefficient (CClocaland CCglobal)
vertex A 2 1 1 1 B 3 2 3 0.666 C 4 2 6 0.333 D 3 1 3 0.333 E 1 0 0 Nan F 1 0 0 Nan sum 6 13 CC 0.583 CC 0.462 2 CC number of triangles 3 number of connected triples ∑ ∑ 2 1
Year LC size Clustering Coefficient (CC) Local Global Random*
2004 3166 0.2394 0.1297 0.0017 2005 5901 0.2387 0.1154 0.0013 2006 7622 0.2598 0.1105 0.0012 2007 9193 0.2727 0.1123 0.0012 2008 9001 0.3454 0.1104 0.0013 2009 8650 0.3757 0.1190 0.0016 2010 8802 0.3472 0.1149 0.0015 2011 4979 0.4176 0.1484 0.0022
Table 3: The statistics indices for table tennis amateur competition in Taiwan
* The ensemble average of one hundred simulations
Average shortest path length (PL)
PL 1
1
,
Small world Q Cluster Coefficience ratio CC ratio Path Length ratio PL ratio CC ⁄CC PL ⁄PL Small world Quotient When the actual network is the characteristic of small‐world network, the small world Q from CC and PL ratio is much greater than one. Q ≫ 1 Small World Q Local Global 126.4 68.4 169.2 82.2 190.8 80.6 215.7 89.2 235.6 75.3 216.8 68.6 204.8 68.1 162.2 57.4 Small‐world effect Path Length PL Actual Random* 5.55 5.00 4.83 4.48 4.69 4.24 4.42 4.09 4.29 3.91 4.11 3.75 4.23 3.78 4.39 3.79
2012/10/9
Figure 4: The histogram for the CCifrom 2004 to 2011
Figure 3: The scatter diagram between kiand CCifrom 2004 to 2011
1 CC 1
G 1
2
Conclusions
The separations between thousands of players are even less than six degree.
The small‐world effect of amateur competition can be quantitated into the meaningful indices which are consistent with the exact behavior of tournament system.
1. The clustering effect of the amateur competition networks come from the preliminaries that is hold in the round‐robin match.
2. The amateur competition networks have scale‐free power‐law distribution for large that is result from the single eliminated match.
There is a common and interesting phenomena in many different field. We also observe the similar property in the amateur competition.