國立交通大學
電子物理系
博 士 論 文
建立超快光譜分析系統及分子超快動力學
之研究
Development of NOPA System for Study of
Ultrafast Dynamics
研究生: 李育賢 Yu-Hsien Lee
指導教授: 籔下篤史 Atsushi Yabushita
教授
Development of NOPA System for Study of Ultrafast Dynamics
研究生: 李育賢
Student: Yu-Hsien Lee
指導教授: 籔下篤史 Advisor:
Dr.
Atsushi
Yabushita
國 立 交 通 大 學
電 子 物 理 學 系
博 士 論 文
A Thesis
Submitted to Department of Electrophysics College of Science
National Chiao-Tung University in partial Fulfillment of the Requirements
for the Degree of Doctor of Philosophy
in Electrophysics November 2010
Hsinchu, Taiwan, Republic of China
建立超快光譜分析系統及分子超快動力學之研究
學生:李育賢
指導教授:籔下篤史 博士
國立交通大學電子物理學系
摘 要
隨著超快雷射技術的發展,短脈衝光譜分析被應用在觀測許多物理系統的瞬態反應, 而時間落在飛秒等級的光化學反應更尤其受到重視跟研究。在小林孝嘉教授指導的先進 雷射研究中心裡,我與日本研究團隊合作並建構非共線光參數放大器(NOPA),利用其 所產生的短脈衝雷射來研究分子的超快動態行為。NOPA系統所產生的寬頻帶短脈衝雷 射,很適合用來探測光化學反應中中間物質的動態變化以及分子結構瞬間運動情形,配 合使用多頻道鎖相放大器,可將每一頻道所偵測到的超快動態反應清晰完整的紀錄。在 我們研究室完成了NOPA系統的架設並可產生10飛秒以下的雷射脈衝,配合快速掃描系 統的建立,可快速的對不同物質實行的光譜探測並瞭解其動態行為。 應用上,我使用NOPA 系統對有機太陽能電池中的聚(3-己烷噻吩) (P3HT)分子聚合 物做超快動力學分析;最近這種塊材異質接面的共軛高分子/富勒烯複合物應用在太陽能 電池上時,成功發展出高轉換效率的複合物 (聚(3-己烷噻吩) (P3HT) / [ 6,6 ]苯基 C61丁 酸甲酯 (PCBM)),加上低毒性、可調整的電子或是機構特性、容易製作以及低廉價格等 優點,可望取代傳統矽薄膜太陽能電池。但P3HT 的組成、薄膜厚度、溶劑使用以及退 火時間等因素都會影響轉換效率,而原因尚不明朗。在這篇論文裡藉由NOPA 系統的光 譜探測解析出P3HT 內分子的超快動態行為、時間以及薄膜內部呈現的缺陷密度,期待 提供給相關製程技術重要訊息,這也是從其他量測系統上所從未見過的成果。Development of NOPA System for Study of Ultrafast Dynamics
Student: Yu-Hsien Lee Advisors: Dr. Atsushi Yabushita
Department of Electrophysics
National Chiao-Tung University
ABSTRACT
We developed a system of non-collinear optical parametric amplifier (NOPA) which has sub-10 fs laser pulses output with smooth and broad spectrum successfully. Using multi-channel lock-in measurement system with new developed fast-scan system, ultrafast dynamic signal at every probe wavelengths can be measured simultaneously and efficiently with excellent signal-to-noise ratio.
As an application of the above spectroscopy system, we performed ultrafast dynamics of an organic polymer of poly(3-hexylthiophene) (P3HT) molecule, which is supposed to be hopeful material for organic solar cell. In this work the ultrafast spectroscopy of P3HT we performed clarifies its ultrafast dynamics, relaxation time, and defect concentration inside the thin film. From these novel results I hope to provide key information to improve the performance of the solar cell.
Acknowledgement
My deepest gratitude goes first and foremost to my supervisors, Professor Kobayashi and Professor Yabushita, for their constant encouragement and guidance. They walked me through all the difficult stages of writing this dissertation.
Second, I would like to thank Professor Wu, Professor Luo, Professor Hsu, and Professor Yang for their kind help, encouragement, and research guidance. I would like to thank all my colleagues in the research cohort in Taiwan and Tokyo for their selfless contributions and participation.
I also thank my friends, who stayed with me and empowered me to face all challenges and difficulties. They gave me strength when I was about to give up and provided me with the courage to face an unknown future. I could not have done this without their support.
I want to thank my families, who always gave me unconditional support and endless love. They share in this achievement. Last, I would like to mention my beloved granddad, who now sleeps in perpetuity. This dissertation is dedicated to him.
Table of Contents
Chinese Abstract ………...……… .
i
English Abstract ……… ii
Acknowledgement ………..
iii
Table of Contents ………... .
iv
List of Figures ………. Vii
Chapter 1 Introduction
1.1
Recent development of ultrafast laser………... 1
1.2
Ultrafast pump-probe experiment……… 3
1.3
The advantages of femtosecond pump-probe spectroscopy…
4
1.4
Research motivation……… 5
1.5
Organization of the thesis………
6
References………. 9
Chapter 2 Noncollinear optical parametric amplification system and
pump-probe spectroscopy
2.1 Noncollinear optical parametric amplifier………..
14
2.3 Time window for broadband parametric amplification……… 16
2.4 Pulse compressor design and the FROG trace of NOPA pulse
17
2.5 Adaptive pulse shaping………... 18
2.6 Development of a broadband detector………
19
References………. 20
Chapter 3 Development of a multiplex fast-scan system for ultrafast
time-resolved spectroscopy
3.1
Introduction to the measurements of time-resolved study…..
26
3.2
Step-scan and fast-scan methods………
28
3.3
Comparison between two methods……….
29
3.4
Conclusion of chapter 3………..
33
References………. 34
Chapter 4 Ultrafast relaxation dynamics of photoexcitations in
poly(3-hexylthiophene) for the determination of the defect concentration
4.1
Introduction and preparation of P3HT………
55
4.2
Time-resolved difference absorption spectra………..
56
4.3
Estimation of time constants and spectra of the intermediates 58
4.4
Defect concentration studied by pump power dependence….
60
4.5
Decomposition of parallel decay rates of BPP………
62
4.6
Conclusion of chapter 4………..
63
References………. 64
List of Figures
Chapter 1
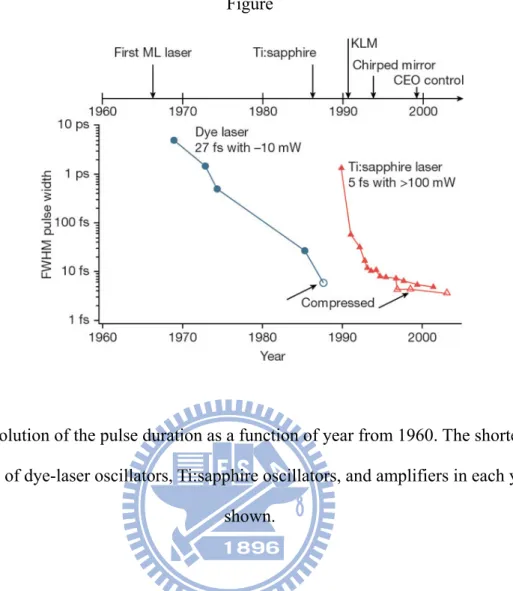
Fig. 1. Evolution of the pulse duration as a function of year from 1960. The
shortest pulse durations of dye-laser oscillators, Ti:sapphire oscillators, and
amplifiers in each year are shown. ……….
13
Chapter 2
Fig. 1. Schematic plot of NOPA setup. ……….
22
Fig. 2. Schematic representation of noncollinear pumping geometry. …..
23
Fig. 3. FROG characterization of NOPA pulse. (a) NOPA spectrum. (b) The
transform-limited intensity profile with 6.5 fs FWHM. (c) Retrieved FROG
trace. ……… 24
Fig. 4. Schematic of the multichannel lock-in amplifier with a pump-probe
measurement system. ……….. 25
Chapter 3
Fig. 1. Incident laser and absorption spectra of a MEH-PPV film. ………
38
Fig. 2. (a) Experimental setup showing the NOPA: noncollinear optical
parametric amplifier, VND: variable neutral density filter, and APD: avalanche
photodiode. ………. 38
Fig. 2. (b) Calibration data for the fast-scan stage (black squares) and a linear
curve fit to the data (red solid line). ………
39
Fig. 3. (a)
A trace obtained by the step-scan method for delay times of 318 to
Fig. 3. (b)
A trace obtained by the step-scan method for delay times of 1482
to 318 fs. ………. 40
Fig. 3. (c) Time-resolved
A spectra from Fig. 3(a) at delays of 147, 326, and
1221 fs. ………. 40
Fig. 3. (d) Time-resolved
A spectra from Fig. 3(b) at delays of 147, 326, and
1221 fs. ………. 41
Fig. 3. (e)
A traces at 568, 575, and 616 nm of Fig. 3(a). ……….
41
Fig. 3. (f)
A traces at 568, 575, and 616 nm of Fig. 3(b). ……….
42
Fig. 4. (a) The Fourier power spectra of the
A traces from Fig. 3(a). …..
42
Fig. 4. (b) The Fourier power spectra of the
A traces from Fig. 3(b). …... 43
Fig. 4. (c) Fourier power spectra at 616 nm from Fig. 3(a). ……… 43
Fig. 4. (d) Fourier power spectra at 616 nm from Fig. 3(b). ………..
44
Fig. 4. (e) Fourier power spectra of the most prominent vibrational mode at 1588
cm
-1from Fig. 3(a). ……… 44
Fig. 4. (f) Fourier power spectra of the most prominent vibrational mode at 1588
cm
-1from Fig. 3(b). ……….... 45
Fig. 5. (a) Spectrograms calculated from the time-resolved traces at 616 nm
shown in Figs. 3(e). ……….... 45
Fig. 5. (b) Spectrograms calculated from the time-resolved traces at 616 nm
shown in Figs. 3(f). ……….
46
Fig. 6. (a)
A traces obtained by the fast-scan method for delay time of 390 to
1396 fs. ………. 46
Fig. 6. (b)
A traces obtained by the fast-scan method for delay time of 1396 to
Fig. 6. (c) Time-resolved
A spectra from Fig. 6(a) at delays of 147, 326, and
1221 fs ……….... 47
Fig. 6. (d) Time-resolved
A spectra from Fig. 6(b) at delays of 147, 326, and
1221 fs ……… 48
Fig. 6. (e)
A traces at 568, 575, and 616 nm of Fig. 6(a). ……….
48
Fig. 6. (f)
A traces at 568, 575, and 616 nm of Fig. 6(b). ……….
49
Fig. 6. (g) Correlation coefficient between the time traces of the forward and
backward scans from 150 to 1350 fs for the step-scan and fast-scan
measurements. ……… 49
Fig. 7. (a) Fourier power spectra of the A traces from Fig. 6(a). ……….
50
Fig. 7. (b) Fourier power spectra of the A traces from Fig. 6(b). ……….
50
Fig. 7. (c) Fourier power spectra at 616 nm from Fig. 6(a). ………...
51
Fig. 7. (d) Fourier power spectra at 616 nm from Fig. 6(b). ………...
51
Fig. 7. (e) Fourier power spectra of the most prominent vibrational mode at 1588
cm
-1from Fig. 6(a). ……… 52
Fig. 7. (f) Fourier power spectra of the most prominent vibrational mode at 1588
cm
-1from Fig. 6(b). ……… 52
Fig. 7. (g) Errors in five vibrational mode intensities for the step-scan
measurement. ……….. 53
Fig. 7. (h) Errors in five vibrational mode intensities for the fast-scan
measurement. ……….. 53
Fig. 8. (a) Spectrogram calculated from the time-resolved A traces at 616 nm
plotted in Fig. 6(e). ……….
54
Fig. 8. (b) Spectrogram calculated from the time-resolved A traces at 616 nm
Chapter 4
Fig. 1. Stationary absorption spectrum (thin solid curve), laser spectrum (thick
solid curve), transmittance spectrum (dotted curve), and fluorescence spectrum
(dashed curve). ………... 67
Fig. 2. (a) Two-dimensional display of the time dependence of the absorbance
changes (probe photon energy versus probe delay time).The value of A is
shown by a pseudocolor, and the curve represents the probe photon energy
where A=0. ……… 67
Fig. 2. (b) Pump-probe delay time dependence of the difference absorbance
probed at eight different wavelengths. ………..
68
Fig. 2. (c) Time-resolved ΔA spectra averaged over 100 fs. ……… 68
Fig. 3. (a) Time constants obtained by a calculation using a two-exponential fit
performed for A traces in short delay region (from 0.35 to 1.4 ps). …..
69
Fig. 3. (b) global fitting results for ΔA traces by the method of least-squares. 69
Fig. 4. (a) Difference absorption spectra corresponding to ultrafast decaying
free-excitons minus the ground state (b
FE), sub-picosecond decaying bound
polaron pairs minus the ground state (b
BPP), and the difference between b
BPPand
b
FE, which reflects induced absorption of bound polaron pairs (b
BPP- b
FE). 70
Fig. 4. (b) Pump intensity dependence of b
BPP. ………..
70
Fig. 4. (c) Fitting curve for b
BPPobserved at different pump intensities. …
71
Chapter 1 Introduction
1.1 Recent development of ultrafast laser
Figure 1 shows the history of pulse shortening from the era in which dye lasers dominated [1]. Since the Ti:sapphire laser was developed, bandwidth broadening of the solitary-like regime [2] realized pulse generation with a duration <10-fs directly from an oscillator. The 650–1100 nm gain bandwidth supports a pulse duration of <5 fs, corresponding to less than two optical cycles of an electrical field. In 1991, the Sibbett group from St. Andrews University achieved a short pulse of 60 fs via techniques associated with the Kerr-lens mode-locked Ti:sapphire laser [3]. This is mainly due to the development of solid-state laser materials with a broad gain bandwidth and mode-locking capability.
Since the development of a broadband Ti:sapphire laser, pulse compression techniques have garnered considerable attention. According to Fourier transform theory, the width of a Fourier-transform limited pulse is inversely proportional to its spectral width. Therefore, to generate a femtosecond pulse with a broad spectral range, different materials and phenomena used for spectral broadening, such as those in bulk materials [4,5], the single-mode fiber [6], hollow fiber [7,8], filamentation in noble gas [9,10], and optical parametric conversion [11–13], have been exploited over the last 20 years.
Even though both methods associated with a broadband Ti:sapphire laser and continuum compression have been applied to generate short pulses, their applicability to time-resolved spectroscopy is limited. The wavelength is primarily fixed to the NIR region or to partial regions in UV by harmonic generation. Because most interesting materials have various electronic transition energies over a wide visible range, extremely short pulses covering the visible spectral region with tuning ability are required for investigations of such physical
systems.
To study real-time vibrational spectroscopy, an ultrashort few-cycle pulse laser source is available in UV, visible, and near-infrared ranges by using non-collinear phase-matched optical parametric amplification [14–22]. Non-collinear optical parametric amplifiers (NOPAs) based on this scheme have been utilized to generate sub-5 fs pulses [18,19] and even 4 fs pulses in the visible spectral range [20,21]. Such ultrashort laser pulses can be applied to investigate vibrational dynamics utilizing intensity modulation of electronic transition by a wave-packet motion associated with coherent molecular vibration through electron-vibration (vibronic) coupling in a molecule. The mechanism of vibronic coupling has been studied theoretically [23–25].
Coherent molecular vibration is described well by a time-dependent nuclear wave packet. Using this wave-packet description, one can establish theoretical bases for models of chemical reaction pathways and geometrical changes related to electronic excitations from experimental results and even predict novel phenomena. Particularly, wave-packet dynamics in molecule excited states are important for coherent control of molecular systems [26–32]. Under certain conditions, vibrational coherence can be generated rather than destroyed during chemical reaction. Real-time spectroscopy can be applied to study the mechanisms of chemical reactions in such a case [33,34].
Sub-5-fs pulses were first generated in the visible region in 1999 [18]. It was constructed by Kobayashi et al. by a pulse-front-matched NOPA operated under full bandwidth by precompression of the seeded continuum with a customized ultrabroadband chirped mirror (UBCM) pair. The signal is compressed down to a nearly transform-limited 4.7±0.1 fs duration by a prism pair and another UBCM pair with a 5-uJ pulse energy.
1.2 Ultrafast pump-probe experiment
Measurement is used by humans to understand the world. The measuring tools determine what can be assessed in nature. Methodologies with resolution higher than that of a measuring process are required. The relatively long relaxation times of photoexcited carriers in semiconductors and electrons from excited states in a molecule are typically in the picosecond or nanosecond order of magnitude. Therefore, a picosecond laser is sufficient for measuring. To study ultrafast dynamics, such as photoexcited phonon scattering in semiconductors or molecular vibration, the femtosecond laser is needed.
The availability of few-cycle ultrafast light pulses has increased the temporal resolution of pump-probe spectroscopy to the few-femtoseconds regime. In typical ultrafast pump-probe spectroscopy, a pump pulse excites a sample and triggers nonstationary responses to changes in various spectroscopic variables such as reflectivity, transmissivity, luminescence intensity, and Raman scattering intensity, which can be monitored using an optically delayed probe pulse. By varying the time delay between a pump and probe pulses, one can assemble a nonstationary response as a function of time. Fractional changes in reflectivity/transmissivity are usually at 10−4–10−5 degrees, furthermore, changes as small as 10−8 can be detected [35].
With short pulses that have broad and sufficient spectral width to cover the spectral range of interest and durations shorter than the vibrational period under investigation, vibrational coherence can be induced in both ground and excited electronic states [36], thereby providing nuclear dynamics information of the excited state [37]. Additionally, nuclear motions induced by photoexcitation through vibronic coupling modulate due to the interaction between vibrational motions and electronic transitions can be observed as electronic spectral changes in both shape and intensity during vibrational periods [37].
1.3 The advantages of femtosecond pump-probe spectroscopy
Comparison with spontaneous Raman scattering spectroscopy:
Ultrafast pump-probe spectroscopy for studies of vibrational structures and dynamics in molecules is the time-domain analog of resonance Raman spectroscopy. However, it has the following advantages over conventional vibrational spectroscopy techniques such as spontaneous Raman scattering.
(1) Resonance Raman signals are frequently overwhelmed by fluorescence signals, especially for highly fluorescent molecules. Conversely, contamination by spontaneous fluorescence can be avoided in real-time vibrational spectroscopy because the probe beam is much stronger and spatially coherent.
(2) Low-frequency modes, which are barely detectable by Raman scattering due to intense Rayleigh scattering, can be studied easily by pump-probe spectroscopy as long as a few quanta of modes are within the laser spectral width with a nearly constant phase.
Comparison with other time-resolved spectroscopy methods:
Real-time spectroscopy is superior to both time-resolved spontaneous spectroscopy, stimulated Raman spectroscopy, and time-resolved infrared (IR) spectroscopy in the following ways.
(1) As a pure time-domain technique, the pump-probe approach facilitates direct observation of vibronic dynamics, including time-dependent instantaneous frequencies. Unlike conventional time-resolved vibrational spectroscopy, real-time spectroscopy detects very small changes in frequency shifting nearly continuously in the real-time domain. Such sensitive detection is realized using a time step of 0.1 or 0.2 fs for observation of absorbance change and by the spectrogram method of a sliding window for analysis. Window width is
arbitrarily changeable depending on the required time resolution after obtaining experimental real-time data. The gate window can also be modified to be probe-time dependent. Therefore, the present technique provides information about the structural changes of molecules, even when in transitional states [38].
(2) Real-time spectroscopy provides information about the vibrational phase, which is inaccessible with conventional Raman spectroscopy and IR spectroscopy.
(3) The dynamics of vibrational modes coupled with electronic transition can be studied in relation to decay dynamics of electronic excited states by simultaneously using the same measurement system under identical experimental conditions such as laser power, temperature, and probing sensitivity.
Despite these overwhelming advantages of the femtosecond pump-probe experiment, the assignment of pump-probe signals to either the ground state or electronic excited state(s) remains ambiguous. This is because an ultrashort laser pulse with a sufficiently wide spectrum can drive coherent vibrations in the ground state and in one or more excited states by generation of superposed vibrational levels in both states. This hinders discussion of wave packet dynamics after photoexcitation.
1.4 Research motivation
The NOPA system was constructed in our laboratory. It can provides an order of magnitude broader parametric gain bandwidth than that in a collinear geometry, and with the combination of a pulse-front matching and angular-dispersion compensation geometries sub-10-fs pulses can be obtained in the visible and NIR. In this proposal I demonstrate applications of NOPA system for pump-probe spectroscopy of various materials. The NOPA system is believed to be the most useful light source for ultrafast spectroscopy in visible
spectral region with the highest time resolution, and leads us to a new regime of ultrafast science.
As an application of the above spectroscopy system, we performed ultrafast dynamics of an organic polymer of poly(3-hexylthiophene) (P3HT) molecule, which is supposed to be hopeful material for organic solar cell. Organic solar cells based on the bulk hetero-junction of conjugated polymer/fullerene compounds have been intensely studied recently as a promising low-cost replacement for conventional silicon photovoltaics. Using conjugated polymer/fullerene composites has numerous advantages, such as low toxicity, adjustable electronic or mechanical properties through functionalization, and ease of fabrication. Highly efficient solar cells based on a donor-type polymer regioregular poly(3-hexylthiophene) (P3HT) and acceptor [6,6]-phenyl-C61-butyric acid methyl ester (PCBM) bulk hetero-junction have been reported, achieving a power-conversion efficiency as high as 4.4%. Many factors influence device performance, including the regioregularity of P3HT, composition of the blended film, solvent, film thickness, annealing temperature, and annealing time. Among these factors, the precise composition of the blended films plays a critical role in determining the performance of the cell. For example, a P3HT/PCBM weight ratio of 1:1 tends to perform better than other ratios. However, the reason for this is not clear. The ultrafast spectroscopy of P3HT we perform clarifies its ultrafast dynamics, which gives key information to improve the performance of the cell.
1.5 Organization of the thesis
In chapter 2, I introduce our NOPA system for pump probe experiment in our lab. A regenerative chirped pulse amplifier (Legend-USP-HE; Coherent) seeded with a Ti:sapphire laser oscillator (Micra 10; Coherent) is used to pump and seed the NOPA. The amplifier
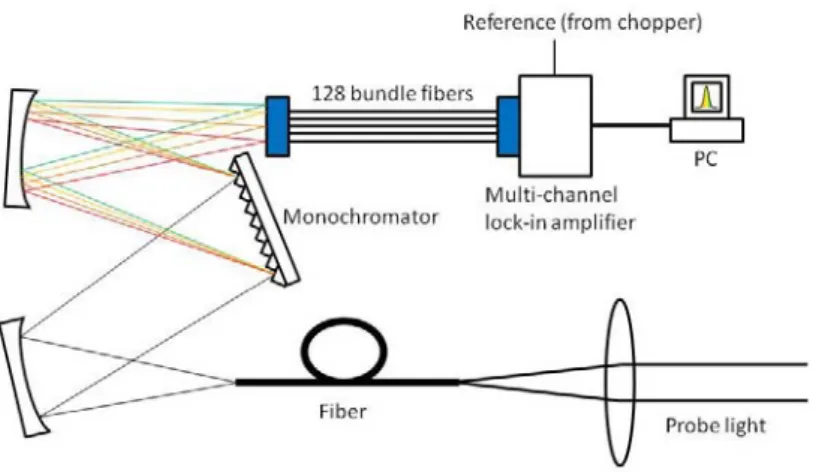
generates 40-fs pulses with a central wavelength of 800 nm, a repetition rate of 5 kHz, and an average power of 2.5 W. The beam from the regenerative amplifier is split into two beams by a beam sampler. One beam of 800 mW is used to generate a second harmonic of 400 nm to pump the NOPA. The other beam of 2.5 mW is focused on a sapphire plate to induce self-phase modulation to generate white light, which is used as the seed beam of the NOPA. The NOPA generates a broad visible spectrum extending from 520 to 700 nm with a nearly constant phase. A beam splitter splits the visible laser pulse into pump and probe beams. The intensities of these beams are adjusted using a variable neutral density filter, and the ratio of the pump to the probe intensities is set to be about four for the weakest excitation. The duration of the broadband visible laser pulse is compressed to 6.5 fs using a pulse compression system, which consists of a diffraction-grating telescopic dispersion line, specially designed multilayer dielectric chirped mirrors, and a computer-controlled flexible mirror. The probe pulse is dispersed by a polychromator (SP2300i; Princeton Instruments) into a 128-branch fiber bundle, whose other end is separated into 128 fiber branches and connected to avalanche photodiodes (APDs). Therefore, the time-resolved transmittance differences ΔT at 128 probe wavelengths are simultaneously detected at the APDs. The signals detected at the APDs are sent to a multichannel lock-in amplifier developed by our group to obtain a signal with a high signal-to-noise ratio.
In chapter 3, a fast-scan method is introduced and the comparison with traditional step-scan method is also demonstrated in this part. We develop a fast-scan pump-probe spectroscopic system that can complete a set of measurements in less than 2 minutes. Quantitative estimates of the signal reproducibility demonstrate that these fast-scan measurements provide much higher reproducibility and reliability than conventional measurements, and are thus suitable for applications involving chemical, physical, and biological materials.
In the chapter 4, a spectroscopic application of the sub-10-fs NOPA to pump-probe experiment of a poly(3-hexylthiophene) thin film is presented. The fast geometrical relaxation (GR) time was attributed to the transition from a free exciton (FE) to form a bound polaron pair (BPP), which is equivalent to a self-trapped exciton, and the time constant of the transition was estimated to be τGR = 90±2 fs. The relaxation time constant of BPP was
determined as τBPP = 710±40 fs. The relaxation process corresponds to faster two channels
among three parallel decay channels of “trapping by defects”, “direct recombination to the ground state”, and “dissociation into polarons”. Trapping process was distinguished from other two processes observing pump intensity dependence of the signal, which estimated the trapped BPPs and defect concentration in the P3HT thin film. Finally the chapter 5 summarizes this thesis.
References
[1] Ursula Keller, “Recent developments in compact ultrafast lasers”, Nature 424, 831, 2003. [2] Spielmann Ch., Curley P. F., Brabec T., Krausz F., “Ultrabroadband femtosecond lasers”, IEEE J. Quantum Electron. 30, 1100, 1994.
[3] Spence D. E., Kean P. N., Sibbett W., “60 fsec pulse generation from a self-mode-locked Ti:sapphire laser”, Opt. Lett. 16, 42, 1991.
[4] Rolland C., Corkum P. B., “Compression of high-power optical pulses”, J. Opt. Soc. Am. B, 5, 641, 1988.
[5] Dharmadhikari A. K., Rajgara F. A., Mathur D., “Systematic study of highly efficient white light generation in transparent materials using intense femtosecond laser pulses”, Appl. Phys. B 80, 61, 2005.
[6] Baltuška A., Wei Z., Pshenichnikov M., Wiersma D. A., “Optical pulse compression to 5 fs at a 1-MHz repetition rate”, Opt. Lett. 22, 102, 1997.
[7] Nisoli M., De Silvestri S., Svelto O., “Generation of high energy 10 fs pulses by a new pulse compression technique”, Appl. Phys. Lett. 68, 2793, 1996.
[8] Nisoli M., Stagira S., De Silvestri S., Svelto O., Sartania S., Cheng Z., Lenzner M., Spielmann Ch., Krausz F., “A novel high-energy pulse compression system: generation of multigigawatt sub-5-fs pulses”, Appl. Phys. B 65, 189, 1997.
[9] Hauri C. P., Kornelis W., Helbing F. W., Heinrich A., Couairon A., Mysyrowicz A., Biegert J., Keller U., “Generation of intense, carrier-envelope phase-locked few-cycle laser pulses through filamentation”, Appl. Phys. B 79, 673, 2004.
[10] Trushin S. A., Panja S., Kosma K., Schmid W. E., Fuss W., “Supercontinuum extending from >1000 to 250 nm, generated by focusing ten-fs laser pulses at 805 nm into Ar”, Appl. Phys. B 80, 399, 2005.
[11] Wilhelm T., Piel J., Riedle E., “Sub-20-fs pulses tunable across the visible from a blue-pumped single-pass noncollinear parametric converter”, Opt. Lett. 22, 1494, 1997
[12] Cerullo G., Nisoli M., De Silvestri S., “Generation of 11 fs pulses tunable across the visible by optical parametric amplification”, Appl. Phys. Lett. 71, 3616, 1997.
[13] Baltuška A., Fuji T., Kobayashi T., “Self-referencing of the carrier-envelope slip in a 6-fs visible parametric amplifier”, Opt. Lett. 27, 306, 2002.
[14] Wilhelm T., Piel J., Riedle E. “Sub-20-fs pulses tunable across the visible from a blue-pumped single-pass noncollinear parametric converter”, Opt. Lett. 22, 1494, 1997.
[15] Cerullo G., Nisoli M., De Silvestri S. “Generation of 11 fs pulses tunable across the visible by optical parametric amplification”, Appl. Phys. Lett. 71, 3616, 1997
[16] Shirakawa A., Sakane I., Kobayashi T. “Pulse-front-matched optical parametric amplification for sub-10-fs pulse generation tunable in the visible and near infrared”, Opt. Lett. 23, 1292, 1998
[17] Cerullo G., Nisoli M., Stagira S., De Silvestri S., Tempea G., Krausz F., Ferencz K. “Mirror-dispersion-controlled sub-10-fs optical parametric amplifier in the visible”, Opt. Lett. 24, 1529, 1999.
[18] Shirakawa A., Sakane I., Takasaka M., Kobayashi T., “Sub-5-fs visible pulse generation by pulse-front-matched noncollinear optical parametric amplification”, Appl. Phys. Lett. 74, 2268, 1999.
[19] Kobayashi T., Shirakawa A., “Tunable visible and near-infrared pulse generator in a 5 fs regime”, Appl. Phys. B 70, S239, 2000.
[20] Baltuska A., Kobayashi T., “Adaptive shaping of two-cycle visible pulses using a flexible mirror”, Appl. Phys. B 75, 427, 2002.
[21] Baltuska A., Fuji T., Kobayashi T., “Visible pulse compression to 4 fs by optical parametric amplification and programmable dispersion control”, Opt. Lett. 27, 306, 2002.
[22] Baum P., Lochbrunner S., Riedle E., “Generation of tunable 7-fs ultraviolet pulses: achromatic phase matching and chirp management”, Appl. Phys. B 79, 1027, 2004.
[23] Pollard W. T., Dexheimer S. L., Wang Q., Peteanu L. A., Shank C. V. Mathies R. A., “Theory of dynamic absorption-spectroscopy of nonstationary states .4. application to 12-fs resonant impulsive raman-spectroscopy of bacteriorhodopsin”, J. Phys. Chem. 96, 6147, 1992.
[24] Orlandi G., Siebrand W., “Theory of vibronic intensity borrowing - comparison of Herzberg-Teller and Born-Oppenheimer coupling”, J. Chem. Phys. 58, 4513, 1973.
[25] Lin S. H., Erying H., “Study of franck-condon and herzberg-teller approximations”, Proc. Natl Acad. Sci. USA 71, 3802, 1974.
[26] Laubereau A., Stockburger M., Time-Resolved Vibrational Spectroscopy, Berlin: Springer, 1985
[27] Schreiber E., Femtosecond Real-Time Spectroscopy of Small Molecules and Clusters, Springer Tracts in Modern Physics vol 143 Berlin: Springer, 1998
[28] De Schryver F., De Feyter S., Schwertzer G., Femtochemistry, New York: Wiley-VCH, 2001.
[29] Martin M. M., Hynes J. T., Femtochemistry and Femtobiology, Ultrafast Events in Molecular Science Amsterdam: Elsevier, 2004.
[30] Hannaford P., Femtosecond Laser Spectroscopy Berlin: Springer, 2005
[31] Castleman A. W., Kimble M. L., Jr., Femtochemistry VII, Fundamental Ultrafast Processes in Chemistry, Physics, and Biology Amsterdam: Elsevier, 2006.
[32] Vierheilig A., Chen T., Waltner P., Kiefer W., Materny A., Zewail A. H., “Femtosecond dynamics of ground-state vibrational motion and energy flow: polymers of diacetylene”, Chem. Phys. Lett. 312, 349, 1999.
chemical reaction dynamics and vibrational coherence”, J. Chem. Phys. 107, 2859, 1997. [34] Rosca F., Kumar A. T. N., Ionascu D., Sjodin T., Demidov A. A., Champion P. M., “Wavelength selective modulation in femtosecond pump-probe spectroscopy and its application to heme proteins”, J. Chem. Phys. 114, 10884, 2001.
[35] Heritage J. P., Bergman J. G., Pinczuk A., Worlock J. M. “Surface picosecond raman gain spectroscopy of a cyanide monolayer on silver”, Chem. Phys. Lett. 67, 229, 1979.
[36] Pollard W. T., Lee Soo-Y., Mathies R. A. “Wave packet theory of dynamic absorption spectra in femtosecond pump–probe experiments”, J. Chem. Phys. 92, 4012, 1990.
[37] Book L. D., Arnett D. C., Hu H., Scherer N. F. “Ultrafast pump−probe studies of excited-state charge-transfer dynamics in blue copper proteins”, J. Phys. Chem. A 102, 4350 1998.
[38] Pollard W. T., Dexheimer S. L., Wang Q., Peteanu L. A., Shank C. V., Mathies R. A., “Theory of dynamic absorption spectroscopy of nonstationary states. 4. Application to 12-fs resonant impulsive Raman spectroscopy of bacteriorhodopsin”, J. Phys. Chem. 96, 6147, 1992.
Figure
Fig. 1. Evolution of the pulse duration as a function of year from 1960. The shortest pulse durations of dye-laser oscillators, Ti:sapphire oscillators, and amplifiers in each year are
Chapter 2 Noncollinear Optical Parametric Amplification (NOPA) system
and pump-probe spectroscopy
2.1 Noncollinear optical parametric amplifier
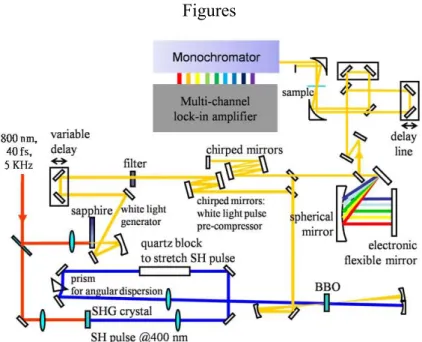
A NOPA, the design of which is described in this thesis, consists of three stages. The first stage is the parametric amplifier itself, which has a sufficiently high gain bandwidth to support sub-10-fs operation. The second stage is a grating-chirped-mirror compressor, which is used to approximately compensate for group delay. It has a flexible mirror, which is used to finely adjust the spectral phase. The third stage is used to diagnose the pulses and it is based on second-harmonic-generation (SHG) frequency-resolved optical gating (FROG) with feedback to a personal computer (which also controls the actuators of the flexible mirror). Figure 1 shows an overview of the amplifier. The source laser is a regenerative chirped pulse amplifier (Coherent Legend-USP) seeded with a Ti:sapphire laser oscillator (Micra 10; Coherent). The amplifier generates femtosecond pulses whose duration, central wavelength, repetition rate, and average power are 40 fs, 800 nm, 5 kHz, and 2.5 W, respectively. The NOPA uses a phase-matching condition to generate amplified visible pulses with a broad spectral width of 200 THz. Below, we consider the design and function of each stage of this setup.
2.2 Extension of phase-matching bandwidth
The discovery of “magic” phase-matching conditions in a type-I β-barium borate (BBO) crystal pumped with 400-nm light [1,2] facilitated the generation of amplified visible pulses that have a bandwidth of nearly 200 THz [3,4]. The pumping arrangement utilized to achieve
these phase-matching conditions is unique since the angle of the pump beam relative to the seed beam (about 3.7°) is generally equal to the birefringent walk-off angle between ordinary and extraordinary waves inside a crystal. Consequently, BBO crystals as long as 1–2 mm can be utilized in 5-fs NOPAs. Noncollinear phase-matching conditions are well understood and have been characterized in numerous studies [2–11].
Shirakawa et al. [3,12] investigated the subtleties in parametric amplification using a noncollinear configuration. They considered the effect of tilting a signal pulse front on the ability to compress the signal pulse into a sub-5-fs pulse. They recommended using a pump beam with a tilted wavefront to prevent signal pulse tilting in space, which causes angular dispersion of the amplified pulse. This configuration (known as pulse-front matching) was implemented by sending a pump beam through a prism and adjusting the pulse-front tilt using a telescope with two convex lenses [13].
The angular dispersion of the pump beam of a sub-5-fs NOPA is important when increasing phase-matching bandwidth. When considering the mechanism responsible for this broadening, one must recall that the pump is not monochromatic and its spectral extent is determined by the duration of input fundamental pulses and frequency-doubling conditions. Even with relatively thick SHG crystals (12 mm lithium triborate or BBO) and comparatively long (120–150 fs) pulses generated using a conventional regenerative amplifier to pump the NOPA [3,4], the resulting second-harmonic (SH) radiation has a bandwidth of several nanometers. Figure 2 schematically depicts how this can improve phase-matching conditions by focusing the incidence angles of individual pump wavelengths onto the NOPA crystal.
The noncollinearity angle, α, can be optimized to minimize the solid angle over which broadband superfluorescence is emitted. Wide-bandwidth parametric amplification can subsequently be achieved by aligning a seed beam in that direction. In other words, each
pump wavelength has a different optimal noncollinearity angle α. Pump beam dispersion for phase-matching optimization is adjusted by selecting the apex angle of the prism in the SH pathway (Fig. 1) and the distance between the prism and focusing optic l. The required SH dispersion can be calculated using the following simplified equation:
atan tan ,
where λ is the pump (SH) wavelength, λ0 is the central component of the SH spectrum, f
is focal distance, and γ(λ) is exit angle of the SH beam after the prism, which is given by
atan tan ,
where γ0 is the angle between the SH beam and normal of the prism input face (i.e., the
incidence angle on the prism), β is the prism apex angle, and n(λ) is the glass refractive index.
2.3 Time window for broadband parametric amplification
To achieve ultrashort pulses, one must consider time-domain shaping of amplified radiation. Despite the extremely broad bandwidth of parametric gain, only the spectral components of a seed that temporally overlap the pump pulse are amplified. Two methods exist that increase the amplification time window—pump pulse elongation and seed compression. The proposed system uses both methods.
To stretch the pump pulse, a 10-cm quartz crystal was installed in the SH beam, which pumps the NOPA. As a result of SH pulse stretching, a confocal focusing arrangement for the pump beam can be utilized (Fig. 1), which produced a significantly cleaner mode structure of the output beam than the nonconfocal pump arrangement, which was used in previous studies [3,12].
The white-light seed does not require meticulous precompression to achieve maximum (1)
continuum produced in a 2-mm-thick sapphire window passing through a pair of chirp mirrors. By changing reflection times between two chirp mirrors, the temporal window of parametric amplification and the output spectral shape were optimized.
We demonstrated that a high level of seed precompression is not required to achieve broadband amplification. Instead, flexible spectral shaping of an amplified signal is attained by balancing pump-seed delay for each of the two passes through the NOPA crystal.
2.4 Pulse compressor design and the FROG trace of NOPA pulse
The spectral width of the output pulses is large enough to generate sub-10-fs laser pulses. For time-resolved spectroscopy, it is necessary to use ultrashort laser pulses to resolve real-time molecular vibrations. Consequently the broadband visible laser pulses were compressed using two dielectric broadband chirped mirrors, a 300-lines/mm diffraction grating in –1st order, and a 200-mm-radius spherical mirror with a flexible mirror positioned in its focal plane (see Fig. 1). A horizontal grating angle was used for crude compression of the pulse width. To fine tune the pulse compression, the voltages applied to the piezoelectric array behind the flexible mirror were adjusted, over a tuning range of 6 μm. During the tuning process, the character of the ultrashort pulses is monitored to guide the alignment procedure, using the second harmonic generation (SHG) frequency-resolved optical gating (FROG) technique. Feedback is provided to the piezoelectric array behind the flexible mirror. A translation stage (SIGMA TECH model STC-1020X), with a built-in interferometer and active position stabilization, is used to obtain a position accuracy of 10 nm. It was used in the FROG apparatus for both wide- and narrow-range delay scans with adequate accuracy. Two identical 2-μm-thick pellicle beamsplitters, which have flat reflectivity across the visible spectral range, were used to balance the dispersion in the two beams of the FROG apparatus.
Both beams are focused onto a wedged ultra-thin -BaB2O4 crystal for broadband SHG and
are collimated behind it using a 200-mm off-axis parabolic mirror. The thickness of the wedge varies across the face of the crystal between 5 and 20 μm. By observing the spectral phase in the SHG FROG measurement, chirp compensation was performed by adjusting the 38 actuators of the flexible mirror (lined up in two rows that provide a clear aperture of ~39x11 mm2).
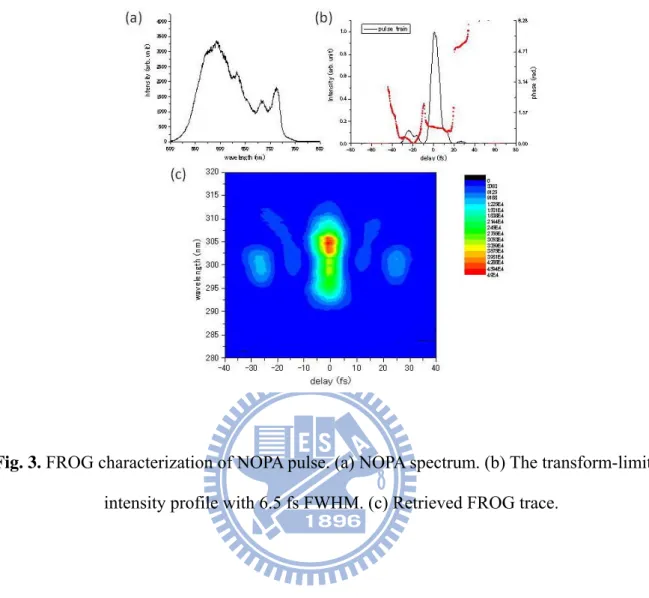
The broadband visible laser pulses were compressed enough to resolve real-time molecular vibrations whose frequencies are lower than 3000 cm-1. The setup of the SHG FROG measurement system is identical to that of the time-resolved pump-probe system used for the molecular vibrational analysis. Therefore, we also used the SHG FROG setup for the measurement of the time-resolved pump-probe signals. The thin beamsplitters used for the SHG FROG measurement divide the compressed ultrashort visible laser pulses into pump and probe beams. A typical FROG trace of the NOPA signal at the optimal compression at 600 nm is shown in Fig. 3(c). Fig. 3(a) and Fig. 3(b) give the corresponding spectrum and its transform-limited intensity profile with constant phase, respectively. The spectrum is intensity-calibrated and the pulse width is as short as 6.5 fs.
2.5 Adaptive pulse shaping
A robust adaptive algorithm based on simple spectral measurements improved pulse quality rapidly (i.e., within several minutes). The inability to remove the remaining discrepancy of the spectral phase is due only to the limited SHG bandwidth. Adaptive phase correction is essential to achieving high-quality compression of extremely broadband laser pulses due to the complexity of phase distortion and the bandwidth and tunability limits of conventional pulse compressors.
2.6 Development of a broadband detector
To detect weak pump-probe signals at multiple probe wavelengths, this work used a multichannel lock-in amplifier (Fig. 4) for time-resolved spectroscopy. The multichannel lock-in amplifier was designed to detect low-intensity signals at multiple probe wavelengths simultaneously over the entire probe spectrum. Although multichannel detection of pump-probe signals has been realized using photodiode arrays or charge-coupled devices, these detectors are less sensitive to low-level signals submerged in a high background, resulting in a lower signal-to-noise ratio than that for lock-in detection. Multichannel lock-in detection is the preferred solution for extracting all probe information and for avoiding various experimental instabilities such as sample degradation and laser instability. In this experiment, signals were spectrally resolved by a monochromator (SpectraPro 2300i; ACTON, country) at 128 wavelengths in the range of 540–740 nm and they were detected using avalanche photodiodes and a lock-in amplifier with a reference from an optical chopper that modulated pump pulse at 2.5 KHz.
References
[1] Driscoll T. J., Gale G. M., Hache F., “Ti:sapphire 2nd-harmonic-pumped visible range femtosecond optical parametric oscillator”, Opt. Commun. 110, 638, 1994.
[2] Gale G. M., Cavallari M., Driscoll T. J., Hache F., “Sub-20-fs tunable pulses in the visible from an 82-MHz optical parametric oscillator”, Opt. Lett. 20, 1562, 1995.
[3] Shirakawa A., Sakane I., Takasaka M., Kobayashi T., “Sub-5-fs visible pulse generation by pulse-front-matched noncollinear optical parametric amplification.”, Appl. Phys. Lett. 19, 2268, 1999.
[4] Cerullo G., Nisoli M., Stagira S,, De Silvestri S., “Sub-8-fs pulses from an ultrabroadband optical parametric amplifier in the visible”, Opt. Lett. 23, 1283, 1998.
[5] Di Trapani P., Andreoni A., Solcia C., Foggi P., Danielis R., Dubietis A., Piskarskas A. “Matching of group velocities in three-wave parametric interaction with femtosecond pulses and application to traveling-wave generators”, J. Opt. Soc. Am. B 12, 2237, 1995.
[6] Gale G. M., Hache F., Cavallari M., “Broad-bandwidth parametric amplification in the visible: femtosecond experiments and simulations”, IEEE J. Sel. Topics Quantum. Electron. 4, 224, 1998.
[7] Riedle E., Beutter M., Lochbrunner S., Piel J., Schenkl S., Spoerlein S., Zinth W., “Generation of 10 to 50 fs pulses tunable through all of the visible and the NIR”, Appl. Phys. B. 71, 457, 2000.
[8] Cerullo G., Nisoli M., Stagira S., De Silvestri S., Tempea G., Krausz F., Ferencz K., “Mirror-dispersion-controlled sub-10-fs optical parametric amplifier in the visible”, Opt. Lett. 24, 1529, 1999.
[9] Cerullo G., Nisoli M., Stagira S., De Silvestri S., Tempea G., Krausz F., Ferencz K., “Mirror-dispersion-controlled OPA: a compact tool for sub-10-fs spectroscopy in the visible”, Appl. Phys. B S70, S253, 2000.
[10] Shirakawa A., Kobayashi T., “Noncollinearly phase-matched femtosecond optical parametric amplification with a 2000 cm−1 bandwidth”, Appl. Phys. Lett. 72, 147, 1998.
[11] Shirakawa A., Sakane I., Kobayashi T., “Pulse-front-matched optical parametric amplification for sub-10-fs pulse generation tunable in the visible and near infrared”, Opt. Lett. 23, 1292, 1998.
[12] Kovacs A. P., Osvay K., Bor Z., Szipöcs R., “Group-delay measurement on laser mirrors by spectrally resolved white-light interferometry”, Opt. Lett. 20, 788, 1995.
[13] Danielius R., Piskarskas A., Di Trapani P., Andreoni A., Solcia C., Foggi P., “Matching of group velocities by spatial walk-off in collinear three-wave interaction with tilted pulses”, Opt. Lett. 21, 973, 1996.
Figures
Fig. 3. FROG characterization of NOPA pulse. (a) NOPA spectrum. (b) The transform-limited intensity profile with 6.5 fs FWHM. (c) Retrieved FROG trace.
Fig. 4. Schematic of the multichannel lock-in amplifier with a pump-probe measurement system.
Chapter 3 Development of a multiplex fast-scan system for ultrafast
time-resolved spectroscopy
3.1 Introduction to the measurements of time-resolved study
Ultrafast spectroscopy is a powerful method for investigating photochemical, photophysical, and photobiological processes. Photochemistry of various reactions has been studied, including isomerization, proton transfer, and electron transfer. Photophysical processes have been measured for carrier dynamics and nonlinear excitations. Photobiological processes have been clarified in vision and photosynthesis [1–4]. Ultrafast spectroscopy also has various important applications to photosensors [5–7], ultrafast optical switches [8–10], and ultrafast optical memories [11–13].
Following the development of femtosecond lasers, ultrafast spectroscopy blossomed [14–17] and expanded into areas such as plasma diagnosis and in situ probes for laser manufacturing. Subsequent development of sub-10-fs laser pulses [18–23] elucidated the ultrafast dynamics [24–28] of electronic relaxations and molecular vibrations. After the development of a NOPA [29–30], ultrafast spectroscopy could be performed across wide spectral regions because its structure is broadband and smooth. The resulting observation of real-time molecular vibrations has provided information about changes in molecular structure during relaxation processes such as internal conversion and intersystem crossing, and chemical reactions including cis-trans and trans-cis isomerization, proton transfer, and oxidation [31–38].
However, it has been difficult to obtain reproducible results for molecular vibrational modes across long timescales of several hundred femtoseconds. The difficulty stems mainly from (i) accumulated damage to samples, and (ii) long term instabilities of the laser intensity.
steps (less than several femtoseconds) across a long time span (up to a few tens of picoseconds) in order to observe molecular vibrational signals along with the electronic dynamics. The relaxation and dynamics of molecular vibrational modes can be studied by observing changes in the instantaneous frequencies of the modes associated with corresponding electronic states. Therefore it is necessary to have both a long time range to follow the reactions and sufficiently short time step to resolve the molecular vibrations whose frequencies change during the electronic processes. One complete scan can take an hour or more. If the sample is chemically sensitive to radiation, it can be damaged during a single scan. The accumulation of damage, which can be significant when the measurement time is long, makes it difficult to observe the intrinsic dynamics of a sample.
Molecular vibrational periods are on the order of several tens of femtoseconds, observed as a modulation of the ΔA trace in a pump-probe measurement during accumulation of about 100 laser shots at each delay-time step. The intensity of the ultrashort laser pulses, used for generating high order nonlinear effects, is affected by small fluctuations in the temperature, humidity, and airflow around the system. These small disturbances cause instabilities in the laser intensity, which make it difficult to observe the ΔA modulation, because both modulations have roughly the same period of several minutes.
In the present work, we have developed a fast-scan pump-probe system with a multichannel lock-in amplifier (MLA) for broadband spectral measurements. A new method, which we dub "fast-scan pump-probe spectroscopy," improves the reproducibility and reliability of the experimental data. For comparison, conventional pump-probe measurements are first performed for a conjugate polymer film. The data are found to be limited in sensitivity and reliability, because they are affected by instabilities in the light sources and by the fragility of the samples. When the pulse duration is kept below 10 fs, which is shorter than typical molecular vibrational periods, it is difficult to maintain the long-term stability of the
laser, hindering determination of the decay dynamics of the electronic states and introducing systematic errors. The fragility of the samples reduces the amount and concentration of the samples and can cause contamination of the materials. These effects make it difficult to obtain reproducible and reliable data. But the experimental data are strikingly improved by using the fast-scan pump-probe spectroscopy system.
3.2 Step-scan and fast-scan methods
To evaluate our new measurement method, we compared it to the pump-probe signal obtained using a conventional step-scan method. The signal was collected by recording ΔA while scanning the delay time step by step (step-scan) between the pump and probe pulses across a 1800-fs range in 0.6-fs steps. For the purposes of analysis, data with 3-fs steps was obtained by determining the mean of 5 data points to suppress artifacts due to interference between the pump and probe pulses. The stage used for the step-scan scan (PFS-1020 from Sigma-Tech) had 10-nm (1/15-fs) resolution with full closed-loop control. The positioning resolution was adequate for ultrafast time-resolved spectroscopy, because the time resolution was limited by the duration of the pump and probe pulses (longer than 3 fs). However, the stage required 600 ms to stabilize in position before it moved to the next position, so that a single scan of the pump-probe measurement required at least 30 min.
In the new method, the A signal is recorded while scanning the delay time rapidly (fast-scan). The delay time between pump and probe pulses was scanned in 500 steps across a range of 1790 fs. The fast-scan stage (ScanDelay-15 from APE-Berlin) was controlled by an external voltage generated by a D/A converter (LPC-361316 from Interface), scanning from 0.2 V to 0.8 V in 5 s, which is 360 times faster than the 30-min scans of the conventional method. At each delay point, A was obtained in 10 ms, storing the data in the memory of the
multichannel lock-in amplifier. The mean was determined for the data in sets of 24 points to maintain good signal-to-noise ratio. Therefore the measurement time of a single run in the fast-scan pump-probe method was 2 min (24 5 s). One can thereby avoid laser fluctuations having correlation times longer than 5 min.
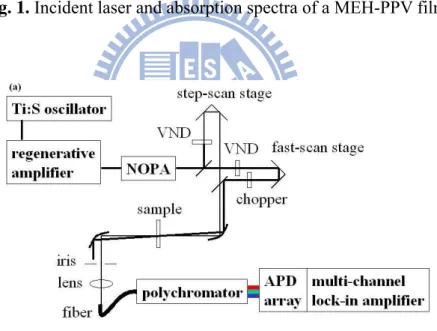
Testing sample is a poly-[2-methoxy-5-(20-ethyl-hexyloxy)-p-phenylene vinylene] (MEH-PPV) film which was used for pump-probe measurements. It was prepared by spin coating chloroform solutions of MEH-PPV onto quartz plates to form 0.5 to 1.0 μm thick films. An absorption spectrum of the MEH-PPV film is shown in Fig. 1, as recorded by an ultraviolet–visible–near-infrared (UV-VIS-NIR) scanning spectrophotometer (UV-3101PC from Shimadzu). All measurements were performed at room temperature (295±1 K).
3.3 Comparison between two methods
The experimental setup, consisting of the NOPA, step-scan stage, and fast-scan stage is shown in Fig. 2(a). We performed pump-probe measurements using the step-scan stage and the fast-scan stage.
First, a 20-μm-thick BBO crystal on a fused silica base plate was used to generate an autocorrelation signal, owing to the broadband spectral width of the laser pulse. While scanning the fast-scan stage, the autocorrelation signal was monitored by a photomultiplier tube (H9656-04 from Hamamatsu) connected to the last channel of the MLA system. When the step-scan stage moves, the autocorrelation signal on the fast-scan trace shifts with the same amount of delay as that of the step-scan stage. From the shift, the delay position of the fast-scan trace can be calibrated. The autocorrelation traces were obtained by changing the delay position of the step-scan stage in 50-fs steps. The peak positions of the autocorrelation signal are plotted in Fig. 2(b), giving a calibration curve showing a linear relationship
between the delay time and data points with 3.58 0.01 fs/point.
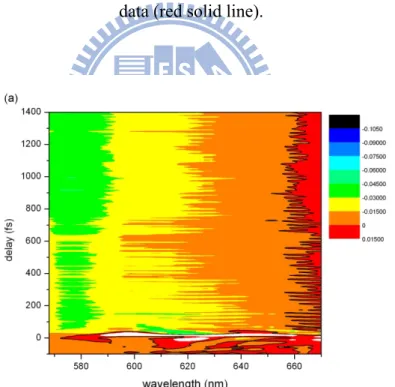
Pump-probe measurements of the MEH-PPV film were first performed by the step-scan method. The absorbance change ΔA in the wavelength region from 515 to 753 nm in 2.5-nm steps was obtained by scanning the delay time from -318 to 1482 fs in 0.6-fs steps (forward scan). For each delay point, ΔA was obtained by accumulating for 0.6 s. The mean ΔA spectra in 3-fs steps are shown in Fig. 3(a) in two-dimensional (2D) form. The data in Fig. 3(b) are for the corresponding backward scan. The poor reproducibility between Figs. 3(a) and (b) is indicative of sample damage and laser intensity instabilities.
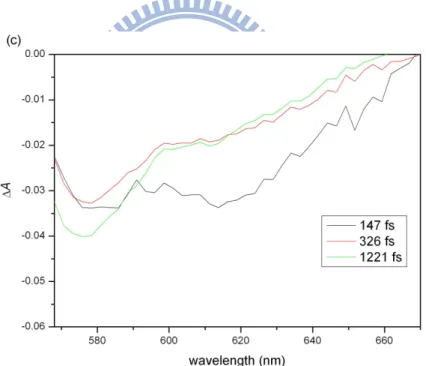
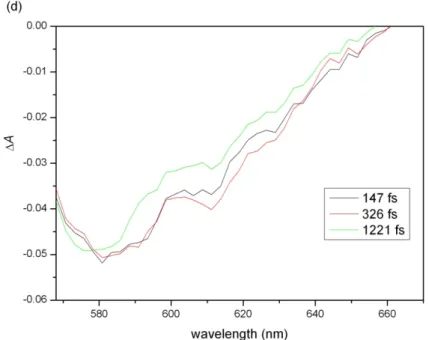
The 2D traces give time-resolved ΔA spectra along their cross sections. The ΔA spectra at three delays (147, 326, and 1221 fs) are plotted in Figs. 3(c) and (d) for forward and backward scans, respectively. Damage accumulated in the sample causes scattering, which decreases ΔA in Fig. 3(d) compared to in Fig. 3(c).
Time-resolved ΔA traces at three probe wavelengths (568, 575, and 616 nm) were also extracted from the 2D traces in Figs. 3(a) and (b) and plotted in Figs. 3(e) and (f), respectively. In the forward scans, the time-resolved traces start around ΔA=0 for negative delays. In contrast, there exists a large offset at negative delays for the backward scans. The offset is due to damage accumulated on the sample during the step-scan measurements.
Fourier power spectra of the ΔA traces reveal molecular vibrational modes of the sample. Figures 4(a) and (b) are the 2D results for forward and backward scans, respectively. They show strong peaks around 1588 cm-1, corresponding to the most intense Raman mode (see Fig. 2 of Ref. 39). However, they have low reproducibility between the forward and backward scans and show considerable difference from a Raman spectrum, because of the instability of the laser source.
Fourier power spectra probed at 616 nm were extracted from Figs. 4(a) and (b) and plotted in Figs. 4(c) and (d). Differences compared to a Raman spectrum [39] and the
irreproducibility of the step-scan data can be seen. Figs. 4(e) and (f) are Fourier power spectra of the most prominent mode at 1588 cm-1, corresponding to the C=C stretching mode. They lack reproducibility at wavelengths below 590 nm.
To study the dynamics of the molecular vibrational modes, a spectrographic analysis was performed. Spectrograms were obtained by a sliding-window Fourier transform using the Blackman window function,
, ∞ exp ,
0.42 0.5 cos 0.08 cos ,
where T is the gate width which we set to 600 fs, corresponding to a FWHM of 240 fs. The calculation of the spectrogram was performed after applying a high-pass filter to the signal, because slow modulations of the signal (slower than tens of femtoseconds) are mainly caused by fluctuations in the laser power. For forward and backward scans, the results are shown in Figs. 5(a) and (b), respectively, using a time-resolved ΔA trace probed at 616 nm. It again fails to show good reproducibility.
After the preceding step-scan measurements, we moved the sample position to avoid the damaged area and began fast-scan measurements so that the experimental conditions remained identical. Twenty-four forward scans were obtained from -390 to 1396 fs. The mean of the 24 traces is plotted in Fig. 6(a), and backward scanned data from 1396 to -390 fs are shown in Fig. 6(b). In contrast to the step-scan results, these data show high reproducibility.
Figures 6(c) and (d) are time-resolved ΔA spectra for the forward and backward scans, respectively, at delays of 147, 326, and 1221 fs. Time-resolved ΔA traces probed at three wavelengths (568, 575, and 616 nm) are plotted for the forward and backward scans in Figs. 6(e) and (f), respectively. The improvement in the signal reproducibility was estimated by calculating a correlation coefficient between the time traces for the forward and backward (1) (2)
step-scan and fast-scan measurements. One can see that the reproducibility is much higher in the fast-scan measurements than in the step-scan measurements.
Fourier power spectra of the ΔA traces for the forward and backward scans were calculated and are plotted in Figs. 7(a) and (b), respectively, and show high reproducibility also. Similar to Figs. 4(c) and (d), ΔA traces probed at 616 nm are plotted in Figs. 7(c) and (d) for forward and backward scans, respectively. They confirm the reproducibility of the Fourier power spectra and show good agreement with Raman spectra from previous work [39]. Figures 7(e) and (f) are Fourier power spectra of the most prominent vibrational mode at 1588 cm-1. Some small differences are evident at wavelengths longer than 640 nm. The small amplitude of ΔA in that spectral region [see Figs. 6(a) and (b)] is probably the origin of the error.
Between 600 and 640 nm, where the Fourier power is high, the signal reproducibility was quantified by calculating the error in the determination of the power for molecular vibrational modes of 963, 1112, 1261, 1316, and 1587 cm-1. The relative difference in the Fourier power of a forward scan (If) and a backward scan (Ib) is |(If-Ib)/(If+Ib)|. Figs. 7(g) and
(h) shows the errors calculated for step-scan and fast-scan measurements, respectively. Evidently the Fourier power can be determined more precisely for the latter.
Using a Blackman gate with a FWHM of 240 fs, spectrograms were calculated for the time-resolved traces obtained in the fast-scan measurement. The results are plotted in Figs. 8(a) and (b) for the forward and backward scan, respectively, and show good reproducibility. Therefore, the fast-scan method is preferable not only for the study of electronic dynamics but also for the study of vibrational dynamics.
3.4 Conclusion of chapter 3
Femtosecond laser pulses are used in pump-probe spectroscopy to study ultrafast processes in various materials, both for electronic relaxations and vibrational dynamics. However, the observed results are usually affected by long-term instabilities of the light source and the fragility of samples, resulting in unreliable data. We have developed a fast-scan pump-probe system that can perform measurements in under 2 minutes. The observed results show high reproducibility and reliability. Based on the explosion of activity in the field of ultrafast spectroscopy, if the fast-scan pump-probe method developed in this work is routinely applied, it would permit rapid progress in the study of dynamics of chemical and biological materials.
References
[1] Govindjee P., “Ultrafast reactions in photosynthesis”, Photochem. and Photobiol. 28, 935, 1978.
[2] Pellegrino F., “Ultrafast energy-transfer processes in photosynthetic systems probed by picosecond fluorescence spectroscopy”, Opt. Eng. 22, 508, 1983.
[3] Rubin A. B., Rubin L. B., Pashchenko V. Z., Kononenko A. A., Gulyaev B. A., “Electron-conformation interactions in ultrafast photosynthesis processes”, Kvantovaya Elektron. 7, 52, 1980.
[4] Wasielewski M. R., Liddell P. A., Barrett D., Moore T. A., Gust D., “Ultrafast carotenoid to pheophorbide energy-transfer in a biomimetic model for antenna function in photosynthesis”, Nature 322, 570, 1986.
[5] Boyer A., Dery M., Selles P., Arbour C., Boucher F., “Color discrimination by forward and reverse photocurrents in bacteriorhodopsin-based photosensor”, Biosens. Bioelect. 30, 415, 1995.
[6] Hellingwerf K. J., Hendriks J., Gensch T., “On the configurational and conformational changes in photoactive yellow protein that leads to signal generation in Ectothiorhodospira halophila”, J. Biol. Phys. 28, 395, 2002.
[7] Imamoto Y., Kataoka M., “Structure and photoreaction of photoactive yellow protein, a structural prototype of the PAS domain superfamily”, Photochem. and Photobiol. 83, 40, 2007.
[8] Eichmann G., Li Y., Alfano R. R., “Digital optical logic using a pulsed sagnac interferometer switch”, Opt. Eng. 25, 91, 1986.
[9] Olego D. J., Schachter R., Viscogliosi M., Bunz L. A., “Optoelectronic and structural-properties of sputter etched surfaces of InP”, App. Phys. Lett. 49, 719, 1986.
metalloporphyrins”, Opt. Comm. 245, 407, 2005.
[11] Kuhnert L., “A new optical photochemical memory device in a light-sensitive chemical active medium”, Nature 319, 393, 1986.
[12] Tazuke S., Solid Stat. Phys. 23, 61 1988.
[13] Korolev N. E., Mokienko I. Y., Poletimov A. E., Shcheulin A. S., “Optical storage material based on doped fluoride-crystals”, Phys. Solid. Stat. 127, 327, 1991.
[14] Zewail A. H., “Laser femtochemistry”, Science 242, 1645, 1988.
[15] Bowman R. M., Dantus M., Zewail A. H., “Femtochemistry of the Reaction - Ihgi-Star- Ihg=I -Star- Hgi+I”, Chem. Phys. Lett. 156, 131, 1989.
[16] Gruebele M., Sims I. R., Potter E. D., Zewail A. H., “Femtosecond probing of bimolecular reactions - the collision complex”, J. Chem. Phys. 95, 7763, 1991.
[17] Dantus M., Zewail A. H., “Introduction: Femtochemistry”, Chem. Rev. 104, 1717, 2004. [18] Baltuska A., Wei Z., Pshenichnikov M. S., Wiersma D. A., “Optical pulse compression to 5 fs at a 1-MHz repetition rate”, Opt. Lett. 22, 102, 1997.
[19] Nisoli M., De Silvestri S., Svelto O., Szipocs R., Ferencz K., Spielmann Ch., Sartania S., Krausz. F., “Compression of high-energy laser pulses below 5 fs”, Opt. Lett. 22, 522, 1997. [20] Shirakawa A., Sakane I., Kobayashi T., “Pulse-front-matched optical parametric amplification for sub-10-fs pulse generation tunable in the visible and near infrared”, Opt. Lett. 23, 1292, 1998.
[21] Cerullo G., Nisoli M., Stagira S., De Silvestri S., “Sub-8-fs pulses from an ultrabroadband optical parametric amplifier in the visible”, Opt. Lett. 23, 1283, 1998.
[22] Adachi M., Yamane K., Morita R., Yamashita M., “Sub-5-fs pulse compression of laser output using photonic crystal fiber with short zero-dispersion wavelength”, Jpn. J. App. Phys. Part 1 44, 1423, 2005.
parametric amplification and programmable dispersion control”, Opt. Lett. 27, 306, 2002. [24] Shirakawa A., Kobayashi T., “Noncollinearly phase-matched femtosecond optical parametric amplification with a 2000 cm(-1) bandwidth”, Appl. Phys. Lett. 72, 147, 1998. [25] Shirakawa A., Sakane I., Takasaka M., Kobayashi T., “Sub-5-fs visible pulse generation by pulse-front-matched noncollinear optical parametric amplification”, Appl. Phys. Lett. 74, 2268, 1999.
[26] Baltuska A., Emde M. F., Pshenichnikov M. S., Wiersma D. A., “Early-time dynamics of the photoexcited hydrated electron”, J. Phys. Chem. A 103, 10065, 1999.
[27] Cerullo G., Lanzani G., Muccini M., Taliani C., De Silvestri S., “Real-time vibronic coupling dynamics in a prototypical conjugated oligomer”, Phys. Rev. Lett. 83, 231, 1999. [28] Cinelli R. A. G., Tozzini V., Pellegrini V., Beltram F., Cerullo G., M. Z.-Rossi, S. D. Silvestri, M. Tyagi, and M. Giacca, “Coherent dynamics of photoexcited green fluorescent proteins”, Phys. Rev. Lett. 86, 3439, 2001.
[29] Pollard W. T., Lee S.-Y., Mathies R. A., “Wave packet theory of dynamic absorption-spectra in femtosecond pump-probe experiments”, J. Chem. Phys. 92, 4012, 1990. [30] Kobayashi T., Saito T., Ohtani H., “Real-time spectroscopy of transition states in bacteriorhodopsin during retinal isomerization”, Nature 414, 531, 2001.
[31] Taneichi T., Fuji T., Yuasa Y., Kobayashi T., “Vibrational phase characterization in femtosecond-pumped molecules by path-length modulation pump-probe spectroscopy”, Chem. Phys. Lett. 394, 377, 2004.
[32] Colonna A., Yabushita A., Iwakura I., Kobayashi T., “Chirped molecular vibration in a stilbene derivative in solution”, Chem. Phys. 341, 336, 2007.
[33] Yabushita A., Kobayashi T., “Primary conformation change in bacteriorhodopsin on photoexcitation”, Biophys. J. 96, 1447, 2009.
a polydiacetylene studied by a few-cycle pulse laser”, New J. Phys. 10, 065016, 2008.
[35] Cerullo G., Lanzani G., Pallaro L., De Silvestri S., “Femtosecond impulsive vibrational spectroscopy in conjugated polymers”, J. Mol. Struct. 521, 261, 2000.
[36] Cinelli R. A. G., Tozzini V., Pellegrini V., Beltram F., Cerullo G., Zavelani-Rossi M., De Silvestri S., Tyagi M., Giacca M., “Coherent dynamics of photoexcited green fluorescent proteins”, Phys. Rev. Lett. 86, 3439, 2001.
[37] Cimei T., Bizzarri A. R., Cerullo G., De Silvestri S., Cannistraro S., “Excited state charge-transfer dynamics study of poplar plastocyanin by ultrafast pump-probe spectroscopy and molecular dynamics simulation”, Biophys. Chem. 106, 221, 2003.
[38] Gambetta A., Manzoni C., Menna E., Meneghetti M., Cerullo G., Lanzani G., Tretiak S., Piryatinski A., Saxena A., Martin R. L., Bishop A. R., “Real-time observation of nonlinear coherent phonon dynamics in single-walled carbon nanotubes”, Nature Phys. 2, 515, 2006. [39] Nguyen T. P., Yang S. H., Le Rendu P., Khan H., “Optical properties of poly(2-methoxy-5-(2'-ethyl-hexyloxy)-phenylene vinylene) deposited on porous alumina substrates”, Composites, Part A 36, 515, 2005.
Figures
Fig. 1. Incident laser and absorption spectra of a MEH-PPV film.
Fig. 2. (a) Experimental setup showing the NOPA: noncollinear optical parametric amplifier, VND: variable neutral density filter, and APD: avalanche photodiode.
Fig. 2. (b) Calibration data for the fast-scan stage (black squares) and a linear curve fit to the data (red solid line).
Fig. 3. (b) A trace obtained by the step-scan method for delay times of 1482 to 318 fs.
Fig. 3. (d) Time-resolved A spectra from Fig. 3(b) at delays of 147, 326, and 1221 fs.
Fig. 3. (f) A traces at 568, 575, and 616 nm of Fig. 3(b).
Fig. 4. (b) The Fourier power spectra of the A traces from Fig. 3(b).
Fig. 4. (d) Fourier power spectra at 616 nm from Fig. 3(b).
Fig. 4. (e) Fourier power spectra of the most prominent vibrational mode at 1588 cm-1 from Fig. 3(a).
Fig. 4. (f) Fourier power spectra of the most prominent vibrational mode at 1588 cm-1 from Fig. 3(b).
Fig. 5. (a) Spectrograms calculated from the time-resolved traces at 616 nm shown in Figs. 3(e).
Fig. 5. (b) Spectrograms calculated from the time-resolved traces at 616 nm shown in Figs. 3(f).