在大張影像圖上加上多媒體註解的方法及註解系統的設計與製作
59
0
0
全文
(2) A methodology for adding annotation to large image map 在大張影像圖上加上多媒體註解的方法及註解 系統的設計與製作 研 究 生:滕旭之. Student:Hsu-Chih Teng. 指導教授:陳登吉. Advisor:Deng-Ji Chen. 國 立 交 通 大 學 資 訊 科 學 與 工 程 研 究 所 碩 士 論 文. A Thesis Submitted to Institute of Computer Science and Engineering College of Computer Science National Chiao Tung University in partial Fulfillment of the Requirements for the Degree of Master in Computer Science. July 2007 Hsinchu, Taiwan, Republic of China. 中華民國九十六年七月.
(3) A methodology for adding annotation to large image map. Advisor:Dr. Deng-Jyi Chen. Student:Hsu-Chih Teng. Department of Computer Science and Information Engineering National Chiao-Tung University. Abstract In the recent years, as the Internet becomes more popular, network bandwidth are cheaper and larger, and new web technologies emerging, rich contents can be delivered over the Internet and user can interact with these contents. In this research, we are focusing on how to acquire and deliver a large image over the current network environment, because the image size will be over hundreds of megabytes to gigabytes, to deliver this in the existing network will be very tedious, so we need a methodology that solve this issue. In addition to plain images, we also add multimedia annotations like video, audio, text and image to make the contents more interesting and useful. We will use pathology virtual slide and GPS navigation as our examples to illustrate the feasibility and applicability of the proposed methodology.. i.
(4) Acknowledgements First and foremost, I would like to thank my thesis advisor Professor Deng-Jyi Chen for his guidance and contribution throughout this thesis. Thank you very much for your guidance throughout my graduate studies. I would also like to thank Dr. Chia-Hung Hsiao at Yang-Ming University for his assistance and collaboration during my research. My family, for providing me the opportunity to study at National Chiao-Tong University and giving me the support during my graduate studies. Lastly, my colleges and friends for giving me valuable advice and encouragement.. ii.
(5) Table of Contents Abstract ............................................................................................................. i Acknowledgements .......................................................................................... ii Table of Contents ............................................................................................ iii List of figures ................................................................................................... v List of tables................................................................................................... vii Chapter 1 – Introduction .................................................................................. 1 1.1 Motivations ........................................................................................ 1 1.2 Goals .................................................................................................. 2 1.3 Research methodology ....................................................................... 3 1.4 Organization of this thesis.................................................................. 3 Chapter 2 – Related Researches....................................................................... 4 2.1 Introduction ........................................................................................ 4 2.2 Virtual Slide Box, Cleveland Clinical School.................................... 4 2.3 Virtual Slidebox, University of Iowa. ................................................ 5 2.4 Virtual Slide System, University of Pittsburgh.................................. 6 2.5 vMic ................................................................................................... 6 2.6 HTML ................................................................................................ 9 2.7 XML................................................................................................... 9 2.8 JavaScript ........................................................................................... 9 2.9 Summary .......................................................................................... 10 Chapter 3 – A methodology for adding multimedia annotations on digitalized image .............................................................................................................. 12 3.1 Introduction. ..................................................................................... 12 3.2 The large image splitting method (Step 1)....................................... 13 3.3 Authoring system for adding multimedia annotations (Step 2) ....... 13 3.4 Parsing the script file generated by the authoring system to produce annotation data on the image map (Step 3)............................................ 14 3.5 Upload the extracted annotation data back to server (Step 4).......... 15 3.6 Download the image map and annotation data associated with it for presentation (Step 5) .............................................................................. 16 Chapter 4 – System architecture and implementation.................................... 17 4.1 Introduction ...................................................................................... 17 4.2 System Overview ............................................................................. 17 4.3 System implementation.................................................................... 21 4.3.1 Content Repository Server .................................................... 21 iii.
(6) 4.3.2 Authoring System ................................................................. 24 4.3.3 Repository server-Image Fetcher module ............................. 25 4.3.4 Repository server-Upload handler ........................................ 26 4.3.5 Annotation System ................................................................ 26 Chapter 5 – Application of the proposed Methodology................................. 30 5.1 Pathology Virtual Slide .................................................................... 30 5.1.1 The large image splitting method (Step 1)............................ 30 5.1.2 Adding multimedia annotations and parsing the script file (Step 2 & 3).................................................................................... 32 5.1.3 Upload the extracted annotation data back to server (Step 4)34 5.1.4 Download the image map and annotation data associated with it for presentation (Step 5) ............................................................. 35 5.2 GPS Navigation application............................................................. 38 5.2.1 The large image splitting method (Step 1)............................ 38 5.2.2 Adding multimedia annotations and parsing the script file (Step 2 & 3) ............................................................................................. 39 5.2.3 Upload the extracted annotation data back to server (Step 4)44 5.2.4 Download the image map and annotation data associated with it for presentation (Step 5) ............................................................. 44 Chapter 6 – Conclusions ................................................................................ 47 6.1 Conclusions for this research ........................................................... 47 6.2 Future works .................................................................................... 48 References ...................................................................................................... 49. iv.
(7) List of figures Figure 1. Screenshot of Virtual Slide Box, Cleveland Clinical School ........... 4 Figure 2. Screenshot of the Virtual Slidebox System ...................................... 5 Figure 3. Screenshot of VSS at Pittsburgh....................................................... 6 Figure 4. Screenshot of vMic ........................................................................... 7 Figure 5. vMic with an annotation ................................................................... 8 Figure 6. Illustration of the proposed methodology....................................... 12 Figure 7. A cutting system to split large image into smaller tiles.................. 13 Figure 8. An authoring system for adding multimedia annotations on the image map................................................................................................................. 14 Figure 9. Extracting annotation data (X-Y coordinates of tags and multimedia information) ................................................................................................... 15 Figure 10. Upload extracted annotation data back to the server .................... 15 Figure 11. A web client that download annotations and image map from the server .............................................................................................................. 16 Figure 12. Overview of our system................................................................ 17 Figure 13. Architecture of Pathology virtual slide......................................... 18 Figure 14. Architecture of GPS Navigation................................................... 19 Figure 15. Relationships of sub-systems........................................................ 21 Figure 16. Pyramidal of layers ....................................................................... 22 Figure 17. Authoring system's flow ............................................................... 24 Figure 18. Flowchart of the authoring system's upload module .................... 25 Figure 19. An example of how the images are tiled ...................................... 25 Figure 20. An example of tree's XML structure ............................................ 27 Figure 21. An example of annotation's XML structure ................................. 28 Figure 22. An example of annotation that corresponds to Figure 21............. 28 Figure 23. An example of resolution's XML structure .................................. 29 Figure 24. Screenshot of Image Cutter .......................................................... 30 Figure 25. The result after processing an image ............................................ 31 v.
(8) Figure 26. The directory structure of an image.............................................. 31 Figure 27. Screenshot of annotation system after use has selected a region for authoring. ....................................................................................................... 32 Figure 28. Authoring system with the region content creator selected.......... 33 Figure 29. Annotation template ..................................................................... 33 Figure 30. A new annotation inserted ............................................................ 34 Figure 31. Upload dialogue in authoring system ........................................... 35 Figure 32. Annotation system with annotations that have been added by content creator................................................................................................ 36 Figure 33. Annotation with text and video..................................................... 36 Figure 34. Annotation with text and audio .................................................... 37 Figure 35. Annotation with rectangle and text............................................... 37 Figure 36. Annotation with circle and text..................................................... 37 Figure 37. Original image of a suburb in Taipei............................................ 38 Figure 38. Screenshot of Image Cutter .......................................................... 38 Figure 39. Screenshot of tiles, after the original map has been processed by our Image Cutter................................................................................................... 39 Figure 40. Screenshot of Template Generator ............................................... 40 Figure 41. An empty story generated by Template Generator....................... 40 Figure 42. An empty story with POI placed on the map................................ 41 Figure 43. Template Generator generating the map....................................... 42 Figure 44. Presentation generated by Template Generator............................ 42 Figure 45. Screenshot of different POI .......................................................... 43 Figure 46. Screenshot of touring information ................................................ 43 Figure 47. XMG Player downloading map .................................................... 45 Figure 48. A map presented in XMG Player ................................................. 45 Figure 49. Touring information presented in XMG Player............................ 46 Figure 50. Textual information associated with POI ..................................... 46. vi.
(9) List of tables Table 1. Comparisons of existing systems..................................................... 10 Table 2. Students’ ratings of the virtual slide system .................................... 11 Table 3. The result of an example image ....................................................... 22. vii.
(10) Chapter 1 – Introduction e-Learning has been advocated since the 1960s, and over the years as web and multimedia technologies becomes mature, e-Learning becomes more popular and contents are more rich and interesting. One of the key advantages of e-Learning is the flexibility, learner can access the contents anywhere where internet connections are available. These are more convenient for the learners because they can arrange their own schedule and commitments to study [1].. 1.1 Motivations Current teaching style of pathology in university (for example National Yang-Ming University) requires many copies of glass slides and high magnification microscopes causing following issues: 1.. Students will need to take turns to borrow pathology slides. There are limited number of glass slides, because the process of making glass slides are complicated, time consuming, and high cost.. 2.. After students have access to glass slides they will also need to get access to a high magnification microscope in order to see the contents on the glass slide and writing notes down.. 3.. High magnification microscope is an expensive hardware and the numbers are limited. Current method of teaching this course requires large investments on equipments and the result is limited.. 4.. In the current teaching environment, lecturer will need to use a microscope to teach students the diagnosis of the slides. And it will be very difficult for students to identify the exact location of the diagnosis on the slides, when the try to operate the microscope themselves.. Existing virtual slide systems have been published overseas, but these types of system only allowed user to zooming and panning on the slide. For this to become useful materials in teaching, it requires professors or teachers who are specialized in this field to annotate their diagnosis at the appropriate location on the slide. Therefore how to develop a user friendly multimedia authoring system for medical specialists is the primary objective of this research. Examining existing multimedia authoring systems, most of them are based on Macromedia Flash media, if using this type of system for medical specialists to 1.
(11) create teaching materials, it will require intensive training for medical specialists on how to programming using Action Script language. This will be very inconvenient for medical specialists to perform annotations on teaching materials. Therefore in this research, we extend the existing multimedia authoring system to incorporate new features to suit for medical specialists to perform annotations on digitalized image. In current virtual slides systems, they required proprietary plug-in to view the slides, which will cause an issue in different platforms, and it will limit the expansion of the system for other usages. And after few years later the plug-in might not work in the future platforms. 1.2 Goals In this research, we will propose a new methodology that solves the above issues. We will apply the methodology in a pathology virtual slide system for digitalized pathology information. After the completion of this system, it can be used to improve students’ learning experience in pathology, students can use internet to access the constructed virtual slide system to select appropriate pathology slides that have been digitalized and well documented for self paced study without the need of accessing actual slides and microscope. Potential advantages of using virtual slide system include: 1.. Provides new style of learning for students without the restriction imposed by glass slides and microscope equipments. Students can access the virtual slide system from any computers with internet connection at any time, and any place.. 2.. Save the resource for purchasing expensive microscope equipments and artificially making large amounts of same glass slides.. 3.. Hazard from inappropriate operating of microscope and making slides.. 4.. Students can schedule their own learning activity easily and freely.. The constructed virtual slides system will be implemented in standard protocols and languages, which means there will be no proprietary plug-in required, which accounts for heterogeneous environments and future expansions. And the system can expand it’s usages with other systems. For example, a web-based pathology report system.. 2.
(12) 1.3 Research methodology In this research, we will propose a new methodology, therefore we need to study existing systems to design our system’s architecture and requirements. We conduct this research work in the following steps: Step 1. Study existing systems then analyze their advantages and drawbacks. Step 2. Propose a new methodology that overcomes the limitations of existing system. Step 3. Analyze the functionalities and requirements of the system in order to support our methodology. Step 4. Implements the system, depending on the sub-systems different language and tools will be used. Step 5. Evaluate the system in actual teaching environment. Step 6. Concludes the thesis and suggestions for future improvements. 1.4 Organization of this thesis Chapter 1: This chapter will give an overview of the thesis and the motivations. Chapter 2: Study the related work from previous papers or thesis. At the end of this chapter, we analyze the advantages and limitations of previous systems. Chapter 3: Propose a new methodology that overcomes the limitations imposed in previous systems. We will also add new functionalities to our proposed system. Chapter 4: An overview of the proposed system’s architecture, system flow of the proposed system, and details of each sub-system. Chapter 5: Examples of using our proposed methodology and system, such as medical pathology slides and GPS navigation map. Chapter 6: In this chapter, we present the conclusions for this research and future works.. 3.
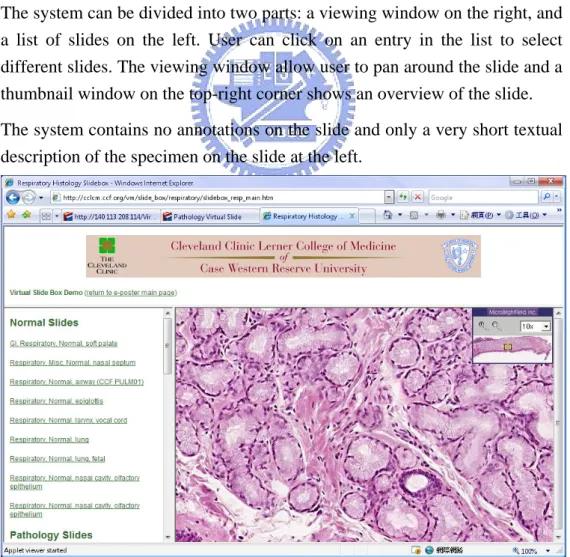
(13) Chapter 2 – Related Researches 2.1 Introduction In this chapter, we will study four different systems that have been developed by other researchers and technologies that are related to this research. We will analyze the advantages and disadvantage of these systems, and identify their limitations.. 2.2 Virtual Slide Box, Cleveland Clinical School Virtual Slide Box [2] is an XML-Based system, it has been developed in Cleveland Clinical Foundation for their medical school. The virtual slide software they incorporate is MicroBrightField Inc [3] which requires Java Virtual Machine to run. The system can be divided into two parts: a viewing window on the right, and a list of slides on the left. User can click on an entry in the list to select different slides. The viewing window allow user to pan around the slide and a thumbnail window on the top-right corner shows an overview of the slide. The system contains no annotations on the slide and only a very short textual description of the specimen on the slide at the left.. Figure 1. Screenshot of Virtual Slide Box, Cleveland Clinical School. 4.
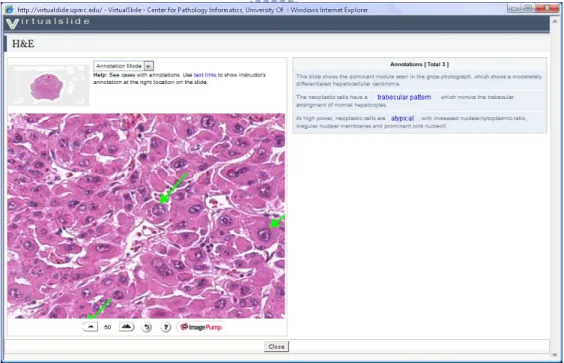
(14) 2.3 Virtual Slidebox, University of Iowa. The Virtual Slidebox [4][5] is an integration of several technologies from different vendors. The database and educational program derivatives were developed at the University of Iowa using Perl scripting and MySQL database. The virtual slice viewer is also provided by the MicroBrightField Inc. The viewer is a Java applet which requires user to install Java Virtual Machine. The system can be divided into three parts: a text area which describes the specimen and annotations associated with it, a viewing window, and a thumbnail area. The text area allowed user to click on an annotation and it will jump to the correct position on the image, the image will show the graphics associated with the annotation. But when user changes the viewing resolution the graphics will disappear. The thumbnail window shows an overview of the whole specimen and user can click on the thumbnail to navigate around the slide. It also has zoom in/out tool and a drop-down list box which let user choose different viewing resolutions.. Figure 2. Screenshot of the Virtual Slidebox System. 5.
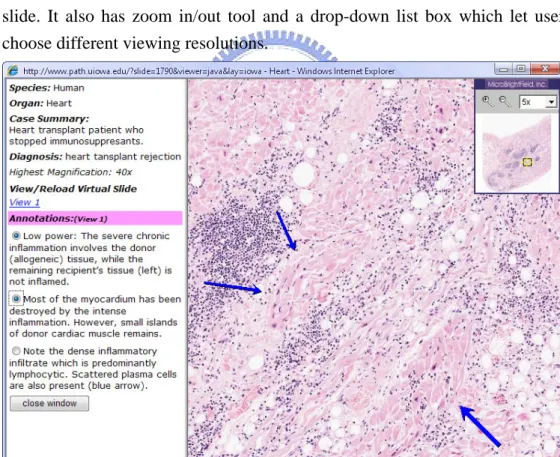
(15) 2.4 Virtual Slide System, University of Pittsburgh The virtual slide system is developed by the School of Information Science and Center for Pathology Informatics at University of Pittsburgh [6][7]. The viewer is a Java applet which requires user to install Java Virtual Machine. The system can be divided into three parts: a thumbnail of specimen at the top left, a viewing window, and a list of annotations associated with the slide on the right. User can navigate the specimen by left click on the viewing window to drag the image around. By right click on the image user can zoom the image with different resolutions or click the zooming button on the bottom of the viewing window. The annotation list shows annotations that have been added by instructor, user can click on the annotation and it will jump to the correct parts of the image. The annotations can be texts or graphics such as arrow and circle that appears on the image.. Figure 3. Screenshot of VSS at Pittsburgh. 2.5 vMic vMic is developed by Dr. Katharina Glatz, Institut für Pathologie, Kantonsspital Basel-Stadt and Dr. Dieter Glatz, Universitätsrechenzentrum, Uni Basel [8][9]. The viewer is implemented in Macromedia Flash MX which requires user to install Flash player on their computer. 6.
(16) The upper part of the viewer shows an overview of the whole specimen and a list of annotations. The bottom part is the viewing window and a toolbar on the right. User can click on the thumbnail to navigate around the slide or click on the image to drag the image. The six buttons on the right let user change different viewing resolution.. Figure 4. Screenshot of vMic. 7.
(17) When user clicks on an entry in the annotation list, details of the annotation will display, when user clicks on the “Show” button the viewer will jump to the correct position of the image. And clicking “More” button the viewer will jump to another window with additional information.. Figure 5. vMic with an annotation. 8.
(18) 2.6 HTML HTML [10] is short for Hypertext Markup Language, it is the most widely used markup language today for creating web pages. It is a text based document which describes everything in a structured way that, tells browser how to presents texts and graphics. The texts are made up of markup tags such as <p> to indicate the start of a paragraph and </p> for an end of paragraph, an entire HTML document will contain many hundreds of markup tags to describe headings, paragraphs, hyperlinks etc…. 2.7 XML XML [11][12] stands for Extensible Markup Language, it is a general purpose markup language for sharing data over different systems via the Internet. It is like HTML which contains markup tags to describe the contents of a file. XML is extensible because the markup tags are unlimited and can be self defined. There are two levels of correctness of an XML document: z. Well-formed. A well-formed document conforms to all of XML's syntax rules. For example, if an element has an opening tag with no closing tag and is not self-closing, it is not well-formed. A document that is not well-formed is not considered to be XML.. z. Valid. A valid document additionally conforms to some semantic rules. These rules are either user-defined or included as an XML schema or DTD. For example, if a document contains an undefined tag, then it is not valid.. 2.8 JavaScript JavaScript [13][14] is the most often used scripting language in client side web pages. It is an object-oriented language first developed by Netscape Communications Corporation in 1992, it’s original name was called “LiveScript”. Jscript is Microsoft’s own implementation of JavaScript, because JavaScript is registered by Netscape, to avoid trademark issue it is called Jscript. JavaScript does not related to JAVA, the only thing that both of them are alike is that they both have C-liked syntax structure. 9.
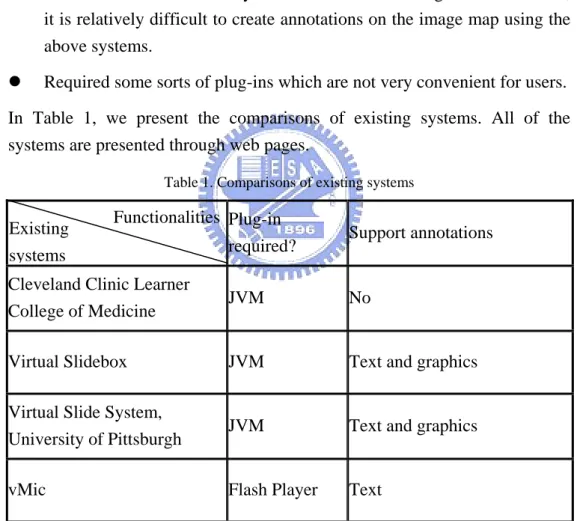
(19) JavaScript is client-side scripting language, the main difference between server-side scripting languages such as PHP, is that JavaScript runs on client’s browser, this will reduce server’s overload. Because JavaScript’s source code does not required to be pre-compiled before execution, it is send in plain-text to client side’s browser for interpretation, therefore causing a security issue.. 2.9 Summary From the above systems, we have identified the following limitations: z. These systems either do not support or only support textual annotations. And the annotations are very hard to link with the image. In other words, it is relatively difficult to create annotations on the image map using the above systems.. z. Required some sorts of plug-ins which are not very convenient for users.. In Table 1, we present the comparisons of existing systems. All of the systems are presented through web pages. Table 1. Comparisons of existing systems. Existing systems. Functionalities Plug-in required?. Support annotations. Cleveland Clinic Learner College of Medicine. JVM. No. Virtual Slidebox. JVM. Text and graphics. Virtual Slide System, University of Pittsburgh. JVM. Text and graphics. vMic. Flash Player. Text. After studying the above systems, we propose a new methodology that overcomes the limitations of those systems. We will introduce the details of the proposed methodology in next chapter. In Table 2, a questionnaire conducted at University of Iowa is recalled here [15]. It shows the response of students after they have used the virtual slide system. 10.
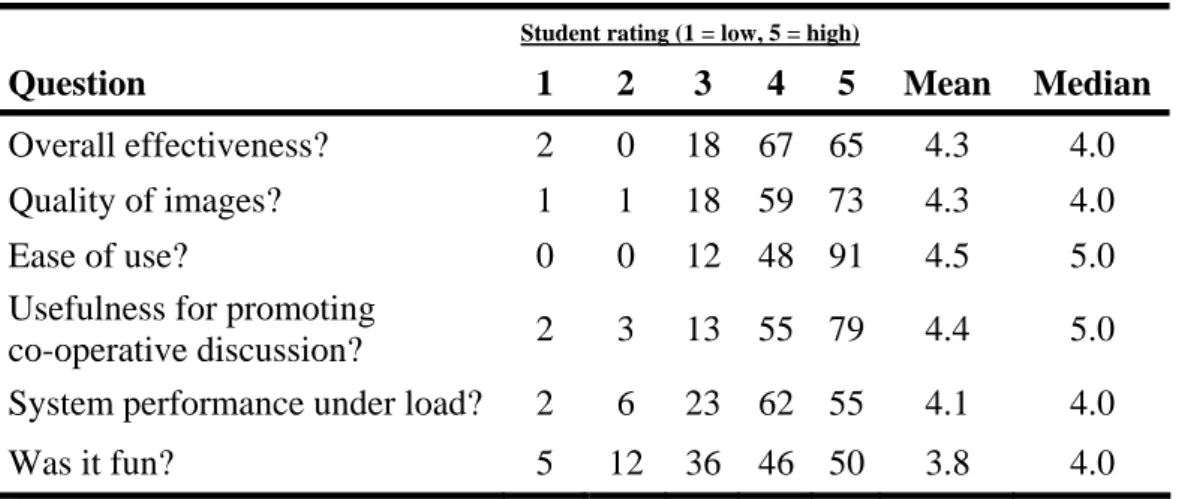
(20) Table 2. Students’ ratings of the virtual slide system Student rating (1 = low, 5 = high). Question. 1. 2. 3. 4. Overall effectiveness?. 2. 0. 18. Quality of images?. 1. 1. Ease of use? Usefulness for promoting co-operative discussion? System performance under load?. 0. Was it fun?. 5. Mean. Median. 67 65. 4.3. 4.0. 18. 59 73. 4.3. 4.0. 0. 12. 48 91. 4.5. 5.0. 2. 3. 13. 55 79. 4.4. 5.0. 2. 6. 23. 62 55. 4.1. 4.0. 5. 12. 36. 46 50. 3.8. 4.0. Source from “Virtual microscopy for learning and assessment in pathology” [15]. From Table 2, we can see that the acceptance of virtual slide system is very high and it is now widely used in medical education. This shows the importance of virtual slide system in medical education.. 11.
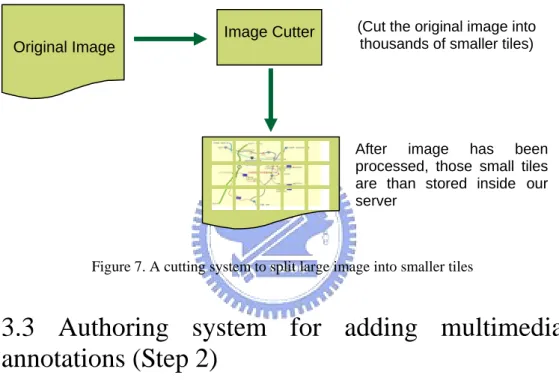
(21) Chapter 3 – A methodology for adding multimedia annotations on digitalized image 3.1 Introduction. In this chapter, we will describe the proposed methodology in detail. The main difference between our system and the others is that our system has the ability to add multimedia annotations. Figure 6 illustrates the idea of our proposed methodology. It can be divided into two main levels [16]: archiving level and application level. The archiving level involves processing the original image and stored the annotations associated with each image. Application level involves two parts: one part is the authoring and the other part is the presentation, both parts will be web-based applications that communicate with the archiving level to acquire images and annotations.. Archiving level Associated annotations: Images Audios Graphics Videos Texts. Images. Application level Web-based applications Figure 6. Illustration of the proposed methodology. The proposed methodology contains five separated steps and each step will be carried out a separated task. Details of these tasks will be described in later sections. The five steps are: Step 1. The large image splitting method. Step 2. Authoring system for adding multimedia annotations. 12.
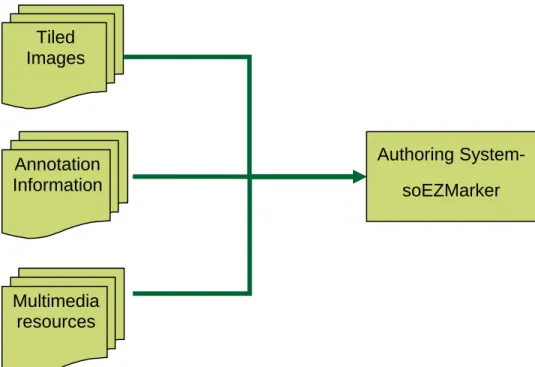
(22) Step 3. Parsing the script file generated by the authoring system to produce annotation data on the image map. Step 4. Upload the extracted annotation data back to server. Step 5. Download the image map and annotation data associated with it for presentation.. 3.2 The large image splitting method (Step 1) The first step is to cut the original image, because it will be very large. It will need to be cut into smaller tiles so it can be used inside our authoring system. Image Cutter Original Image. (Cut the original image into thousands of smaller tiles). After image has been processed, those small tiles are than stored inside our server. Figure 7. A cutting system to split large image into smaller tiles. 3.3 Authoring system for adding multimedia annotations (Step 2) The authoring system will get the image data from server and user can add new annotations and multimedia resources (audios, videos, graphics or images) on the image. The authoring system that we will employ in this research is soEZMarker [17] that we have developed with Bestwise International Computing Co. Ltd [18]. If the image has existing annotation information, the authoring system will get those annotations and multimedia resources from the server, then user can perform modifications on the annotations.. 13.
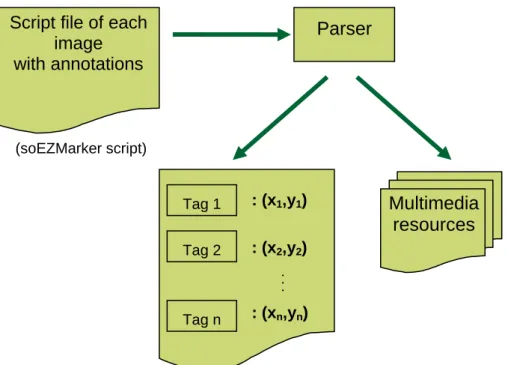
(23) Tiled Images. Authoring System-. Annotation Information. soEZMarker. Multimedia resources. Figure 8. An authoring system for adding multimedia annotations on the image map. 3.4 Parsing the script file generated by the authoring system to produce annotation data on the image map (Step 3) After user has finished authoring, a parser inside the authoring system will fetch the annotations and multimedia information from the soEZMarker script. The annotation information will contain the X-Y coordinates of the tags on the image. The multimedia information will contain the media files and graphic information associated with each tag.. 14.
(24) Script file of each image with annotations. Parser. (soEZMarker script). : (x1,y1). Tag 2. : (x2,y2). Tag n. : (xn,yn). Multimedia resources. ˙˙˙. Tag 1. Figure 9. Extracting annotation data (X-Y coordinates of tags and multimedia information). 3.5 Upload the extracted annotation data back to server (Step 4) After parser has fetched the annotation information and multimedia resources from the script of finished authoring contents, it will compress those data as a single file and upload it back to the server.. Annotation. Multimedia. Information. resources. Compressed file. Upload Repository Server Figure 10. Upload extracted annotation data back to the server 15.
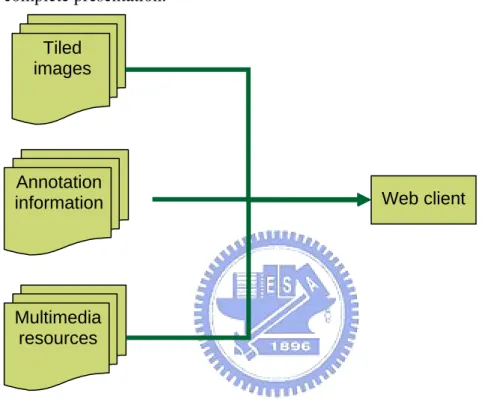
(25) 3.6 Download the image map and annotation data associated with it for presentation (Step 5) After content creator has finished authoring the contents, users can view the finished contents from a web client using standard web browser. The client will retrieve three data from the server: images, annotations, and multimedia resources. It will then combine these three data to form a complete presentation. Tiled images. Annotation information. Web client. Multimedia resources. Figure 11. A web client that download annotations and image map from the server. 16.
(26) Chapter 4 – System architecture and implementation 4.1 Introduction In the previous two chapters, we have introduced the methodology we proposed and systems that have been developed in the past. As a result, we can determine the criteria of our system that needs to be fulfilled in order to conduct the methodology. The two basic ideas of our system are: z. The system should be widely available to users, which means the user should not require any proprietary plug-in installed.. z. User should be able to add multimedia annotations on the image map.. This chapter, we will introduce the proposed system. An overview of the system architecture that illustrates the main idea of the system and then the details of implementation will be discussed. We will use pathology virtual slide system and GPS navigation map to demonstrate our proposed methodology. 4.2 System Overview Web System. Client. Central Repository Server for Images and Multimedia Annotations. Multimedia Authoring System. Figure 12. Overview of our system. As Figure 6 illustrated in Chapter 3, the diagram above (Figure 12) illustrates the idea from an application point of view. The server in the center is the archiving level, which stores all the images and multimedia annotations data, there can be several servers in the center. For example, one for images and one for annotations and annotation system. The web client and authoring 17.
(27) system are the application level, both systems are web-based applications. The communication protocol between the archiving level and application level will be HTTP (Hyper Text Transfer Protocol). Because it is broadly used in today’s World Wide Web environment and does not require special configuration, a standard web server will be sufficient. The multimedia authoring system will retrieve images and annotations (if there exists) from the central server. After user has finished authoring the contents, it will upload the results back to the central server. The web client system will retrieve images and annotations from server, and combines them together to make a significant presentation.. Archiving level Pathology. Annotation System. DB. Annotation DB. Internet. Application level. Content user. Content creator. Figure 13. Architecture of Pathology virtual slide. Figure 13 represents the overview architecture of our example application “Pathology virtual slide”. We can see the applicability of our methodology in an actual application. The archiving level consists of two databases: one 18.
(28) stores all the virtual slides and one stores all the annotations and multimedia resources associated with each slide. The annotation system controls the accessing rights of these two databases. The databases can be on separate computers or they can be on the same computer as the annotation system, user can freely decide the setup of databases. Application level consists of two types of users: one is content user and other one is content creator. Both users will use a web-based application.. Archiving level Map. Annotation System. DB. Annotation DB. Internet. Application level. Content user. Content creator. Figure 14. Architecture of GPS Navigation. Figure 14 represents the overview architecture of our example application “GPS Navigation”. The archiving level consists of two databases: one stores all the images of map and the other one stores the POI (Point of Interest) information. The application level can be divided into two parts: content creator will use an authoring system on a PC to carry out authoring, and content user will use 19.
(29) a handheld device to access the contents. The authoring system that we will use is soEZAuthoring. It has been developed by Bestwise and Software Engineering Lab at National Chiao-Tong University. The player on the handheld device will be based on the XMG player that has been developed by Chi-Chung Hung [19]. Figure 15 represents the details of our system. The whole system contains four sub-systems, the actual implementation details of each sub-system will be discussed in Section 4.3. 1. Imager Cutter When a new image added to the system, it will need to be cut into small tiles by this system. 2. Annotation system This sub-system is the web-client system that will be accessed by content users. It will interact with the two databases. 3. Image fetcher module This module interacts with the authoring system. When user wants to edit an image, this module will fetch images and annotations from server and hand them over to authoring system. 4. Upload handler Handles the annotation file uploaded by authoring system. There are two types of user that will be involved in this proposed system. One is annotator (Content creator) and the other one is reader (Content user). The content creator will conduct the proposed methodology’s step one to four. And content user will conduct the proposed methodology’s step five.. 20.
(30) Image. Image cutter. Retrieve. DB. Annotation System (Web-client) Annotation. Download. DB. Upload. Image fetcher Upload handler. HTTP. Standard web browser. HTTP. Multimedia authoring system. Content user. Content creator. Figure 15. Relationships of sub-systems. 4.3 System implementation 4.3.1 Content Repository Server As Figure 12 and Figure 13 described, the repository server can be one single server or several servers for each database, it will depends on how the user want to setup, but each server will have the same configuration only the data will be different. The repository server will use HTTP as communication protocol and PHP as server side scripting. The server will need to install following two programs: z. Apache 2.2. z. PHP 5 21.
(31) For every image, there will be five layers of different resolutions. Every layer consists of a matrix of 256x256 tiles, when combining these tiles together a complete image will be acquired. Each layer halves the resolution of previous layer. Figure 16 illustrates the idea, the top-most layer is the smallest layer which has the lowest resolution and the bottom layer has the full resolution.. 5 4 3 2 1. Figure 16. Pyramidal of layers. For example, an image with original size 10,000x10,000. Table 3 shows the relationships between each layer. For each layer the table shows the resolution of the complete image and number of tiles that will be cut. Table 3. The result of an example image. Layer Resolution. No. of tiles. 1. 10000x10000. 1600. 2. 5000x5000. 400. 3. 2500x2500. 100. 4. 1250x1250. 25. 5. 625x625. 9. The Image Cutter is implemented in Visual Basic 2005 [20] and uses TIFFComp OCX [21] provided by Aperio Technologies [22]. The OCX supports reading SVS image files and manipulating the images. The Image Cutter will automatically generate these five layers. The process takes four steps: Step 1. Calculate number of tiles that will be generated based on the current resolution. The calculation formulas are as below: 22.
(32) iImageR = iImageHeight / 256 iImageC = iImageWidth / 256 iNoOfTiles = iImageR * iImageC (iImageHeight is the height of current resolution) (iImageWidth is the width of current resolution) (iImageR is number of rows) (iImageC is number of columns) (iNoOfTiles is total number of tiles). Step 2. After total number of tiles has acquired, a loop will get the pixel data of tile from the SVS file by calling API provided by the OCX. Step 3. After the loop has completed, it will go back to step 1 and repeat step 1to step 3 for each layer. Step 4. After all the layers has completed, Image Cutter will generate a XML file that describes the resolution of each layer and the path to retrieve the files, and a thumbnail image that shows the overview of the image.. 23.
(33) 4.3.2 Authoring System The authoring system soEZMarker is a successor of soEZAuthoring [23], both of the authoring systems are the products of Bestwise. soEZMarker has been extended to suit our needs in this research, the download module and upload module are two parts that has been added to suit our needs. There are some functions in soEZAuthoring that is not required, and they have been removed. soEZMarker Download module. Data request (HTTP Request). Authoring System Upload module. Data send (HTTP Request). Repository server. Figure 17. Authoring system's flow. The download module will receive a request by the Image fetcher module, the request contains an URL to a compressed file. After download module has completed downloading the compressed file, it will extract the contents of the compressed file and the authoring system will be activated. After user has finished authoring, the upload module will upload the results back to server and the upload handler on the server will handle the uploaded file. These two modules on the server will be introduced in later sections. The upload module will compress the annotation and multimedia resource and upload the compressed file to server. A PHP script will handshake with the upload module first, then the XML Integrator module on the server will handle the uploaded file and extract the contents to appropriate location. Figure 18 shows the flowchart of how the upload module works.. 24.
(34) Check if server is alive. Server respond. Check if user account and password are valid. Upload handler. Get path. upload. Upload compressed file. Figure 18. Flowchart of the authoring system's upload module. 4.3.3 Repository server-Image Fetcher module The Image fetcher module is a CGI program on the server and it is implemented in Borland C++ Builder 6.0 [24]. When user wants to edit an image, the module will handle user’s request. It has four steps: Step 1. Get desired region. Two coordinates are passed in, upper-left corner (X1, Y1), and bottom-right corner(X2, Y2). Step 2. Create a new image (width and height are calculated from the coordinates) and copy each pixel from the original tiles to new image. Figure 19 demonstrates how the module combines tiles together to create a new image. The black line indicates the desired region of each tile that will be needed to form the new image. The module will start copy the desired region from the top-left tile and working towards the bottom-right tile. (X1, Y1). (X2, Y2) Figure 19. An example of how the images are tiled 25.
(35) Step 3. Parse the annotation’s XML file of this image and select annotations that are inside this region to form a new XML file and the multimedia resources associated with those annotations (if any). Step 4. Compress the new image, annotation information and multimedia resources together, and ready for soEZMarker to download.. 4.3.4 Repository server-Upload handler An upload handler contains PHP scripts and XML Integrator module, these two works together to handle file uploaded by soEZMarker. The XML Integrator module is a CGI program and it is implemented in Borland C++ Builder 6.0. The handler has five steps: Step 1. A PHP script which handles the uploaded file saves it to a temporary folder and extracts the contents. Step 2. After upload has completed, the PHP script will activate the XML Integrator module. Step 3. The CGI program will compare the annotations inside the original XML file and the new XML. It will add new annotations in the new XML file to the original XML file and remove annotations that do not exist in the original XML file. Step 4. Move the multimedia resource files from the temporary folder to the designated folder. Step 5. Respond a successful message back to upload module if the process is successful.. 4.3.5 Annotation System The annotation system uses AJAX (Asynchronous JavaScript and XML) technology and HTML+CSS to implement the system, so it can be browsed by any computer that has a standard web browser installed. We will test the annotation system on four different browsers: Microsoft Internet Explorer [25], Mozilla Firefox [26], Opera [27], and Max OS X Safari [28]. These four browsers are the four main browsers used in today’s PC whether it’s a MAC or a Windows or even Linux. We will incorporate four open source AJAX libraries into our system: z. Prototype JavaScript framework aims to ease the development of 26.
(36) dynamic web applications [29]. It is the base of script.aculo.us framework. z. Script.aculo.us framework [30] is a framework for creating more easy-to-use user interface in a web page.. z. JavaScript VectorGraphics [31] provides JavaScript the capabilities to draw vector graphics dynamically onto a webpage.. z. dTree [32] is a simple to use JavaScript library to construct a tree menu.. The system will get annotation information and images from the database and combines them together as a multimedia enriched presentation. The process has six steps: Step 1. Load tree structure XML file from annotation database. Step 2. Load annotation information associated with the image. Step 3. For each annotation generate a tag on the presentation. Step 4. Load the resolution information XML file associated with the image. Step 5. Only tiles that are visible in the viewing window of client will be fetched from the image database, this will reduce server’s overhead. Step 6. When user change image the process will go back to step 2. Figure 20 shows a sample tree structure XML file that manages the slides into a meaningful presentation. Every tree structure will start with <Tree> tag and each <Node> can have multiple <Item> and <Node> tags. For each <Item> tag the path attribute defines the path to retrieve that image, and title attribute can be any text that describes the slide.. Figure 20. An example of tree's XML structure. Figure 21 shows a sample annotation XML file. The <shape> tag describes the shape of the black and white arrows in Figure 22, and the <label> tag describes the text part of the annotation. For each <shape> tag, the type 27.
(37) attribute defines the type of shape, it can be 1 for rectangle, 2 for circle, or 3 for arrow. The bordercolor attribute defines the color of the shape’s border, it contains three integers to describe the RGB value of the color. Under the <shape> tag, the <vertex> describe the coordinates of the shape. For a rectangle, the first vertex is the top-left corner of the rectangle, and second vertex is the bottom-right corner of the rectangle. For a circle, the vertices define the rectangle that bounds the circle and is describe the same as a rectangle. For an arrow, the first vertex is the start of an arrow and the second vertex is the end of the arrow.. Figure 21. An example of annotation's XML structure. Figure 22. An example of annotation that corresponds to Figure 21.. The resolution information XML file describes the resolution of each layer associated with each image. In Figure 23, it only shows one <Resolution> tag, typically there should be five <Resolution> tags. <ProportionResoution> tag describes the actual magnification of lens used on the microscope. <ImageBlockColumn> describes the width of tile and <ImageBlockRaw> describes the height of tile. <ColumnCount> is the total width of the image for this layer and <RawCount> is the height. <Path> is the path where the tiles are stored on the server and <BasicFileName> is the filename of the tiles.. 28.
(38) Figure 23. An example of resolution's XML structure. 29.
(39) Chapter 5 – Application of the proposed Methodology 5.1 Pathology Virtual Slide 5.1.1 The large image splitting method (Step 1) Figure 24 is our Image Cutter, content creator can select an input folder which contains SVS files and an output folder for finished images.. Figure 24. Screenshot of Image Cutter. After Image Cutter has finished processing the image, the result would looks like Figure 25. It will contain thousands of small tiles.. 30.
(40) Figure 25. The result after processing an image. In Figure 26, we can see that there are five folders, each folder contains the tiles of that layer, an “Annotations.xml” which is an empty XML file and “SlideSettings.xml” XML file which contains the resolution information of each layer. These are automatically generated by the Image Cutter.. Figure 26. The directory structure of an image. 31.
(41) 5.1.2 Adding multimedia annotations and parsing the script file (Step 2 & 3) After the image has archived in the server, content creator can use the annotation system to access those images. When content creator sees a region of interest he can right click on the viewing window and select a region to edit.. Figure 27. Screenshot of annotation system after use has selected a region for authoring.. After content creator clicked on the “Edit” button, the region of interest and annotations (if any) associated with this region will be compressed to a file. Then soEZMarker will be activated to download the compressed file. Figure 28 shows the region selected in Figure 27 passed into soEZMarker and it is ready for editing.. 32.
(42) Figure 28. Authoring system with the region content creator selected. Figure 29. Annotation template. There are three annotation templates that user can choose: 1. A graphic with an image or video, and textual information. 2. Just textual information. 3. A graphic with textual information For each type of template, content creator can add an audio to associate with each annotation. 33.
(43) In this example, we choose the first type of template. And we can double click on each different component to edit it, as in Figure 30. Content creator will repeat Step 2 and Step 3 for each image, and they can add as many annotations as they like, until they are satisfied that each image has been fully annotated with correct diagnosis.. Figure 30. A new annotation inserted. 5.1.3 Upload the extracted annotation data back to server (Step 4) After content creator finished editing the region, he can click the upload button in soEZMarker and an upload window as in Figure 31 will be displayed. When user click the “Publish now” button, a compressed file that contains the annotation information will be uploaded back to server.. 34.
(44) Figure 31. Upload dialogue in authoring system. 5.1.4 Download the image map and annotation data associated with it for presentation (Step 5) After content creator finished authoring the images, content learner can use the annotation system to browse the images with rich multimedia contents. The system has four parts: a tree menu that organize the images into a meaningful structure, a viewing window that has a toolbar in the lower-left corner which let user changes different viewing resolutions, a thumbnail of the whole image which user can click on the thumbnail to navigate around the image, and a list of the annotations user can click on an entry in the list and it will jump to the position of the annotation that the content creator has set. In Figure 32, we can see that the annotation inserted in Figure 30 has been modified. We have replaced the image with a more meaningful image which describes where the specimen came from, and the color of the arrow has been changed.. 35.
(45) Figure 32. Annotation system with annotations that have been added by content creator. The annotation system can support variety types of annotations. There are three basic components for each annotation: z. Vector graphic, which can be an arrow, a rectangle, or a circle. z. Textual description. z. Multimedia resource. It can be either video, audio, or image. Each annotation will at least have a textual description and it can be mixed with a multimedia resource or a vector graphic or both. The following four figures shows different types of annotations. Figure 33. Annotation with text and video 36.
(46) Figure 34. Annotation with text and audio. Figure 35. Annotation with rectangle and text. Figure 36. Annotation with circle and text. 37.
(47) 5.2 GPS Navigation application All materials used in this example are courtesy of Mio Technology [33].. 5.2.1 The large image splitting method (Step 1) When content creator gets an image as in Figure 37, the first step is to split the image into smaller tiles.. Figure 37. Original image of a suburb in Taipei. We use the Image Cutter in Figure 38 to split our images. We can set the dimension of our tiles. In this case, we set it to 855x614 which is the editing area in soEZAuthoring. After the dimension are set, user click on the “Cut Image” button to select an image to cut. In this case, we select the image above (Figure 37).. Figure 38. Screenshot of Image Cutter 38.
(48) The Image Cutter will generate the tiles as the figure below (Figure 39). And these tiles can then be used inside soEZAuthoring.. Figure 39. Screenshot of tiles, after the original map has been processed by our Image Cutter. 5.2.2 Adding multimedia annotations and parsing the script file (Step 2 & 3) After the tiles are generated, we use Template Generator to generate a soEZAuthoring empty story which let content creator put POI (Point of Interest) information on the map. Figure 40 shows the screenshot of our Template Generator. Content creator selects the type of template they want to generate, then click the “Generate” button and the system will ask user to choose a folder which contains the tiles.. 39.
(49) Figure 40. Screenshot of Template Generator. Figure 41 is the empty story generated by Template Generator and it is ready for content creator to put POI information on each of the tile. As the figure shows, the left column contains all the tiles and content creator can select each individual tile to place different POI information on the map.. Figure 41. An empty story generated by Template Generator 40.
(50) Figure 42 shows a tile with five different POI placed on the map. Content creator can click on the actor window to insert new POI.. Figure 42. An empty story with POI placed on the map. After content creator finished placing the POI, they can use Template Generator to generate a complete presentation with touring information associated with each POI. The touring information are templates that has been created beforehand. And content creator can modify each POI’s touring information. In Figure 43, the Template Generator has fetched the five POI we placed in the above figure (Figure 42). And for each POI, Template Generator will associate a touring information template with it.. 41.
(51) Figure 43. Template Generator generating the map. In Figure 44, it shows a preview of the presentation generated from Figure 43. When user clicks on different headings different POI will be displayed, in this figure it shows the POI for restaurants and landmarks.. Figure 44. Presentation generated by Template Generator 42.
(52) Figure 45 shows a POI for recent activity around that area.. Figure 45. Screenshot of different POI. When user clicks on the POI, it will jump to the touring information associated with it.. Figure 46. Screenshot of touring information 43.
(53) 5.2.3 Upload the extracted annotation data back to server (Step 4) After content creator has finished authoring the images. He can upload the contents to an Adaptation server and the Adaptation server will translate the soEZAuthoring stories to contents that are suitable for presenting on PDA. The soEZAuthoring story file contains: z. Script. This describes each scenes relations and event handler.. z. Multimedia files. E.g. images, audios etc…. The adaptation server will translate the script into another script that can be interpreted by the XMG Player on PDA, and the multimedia files will also need to be translated. For example, the video will need to be resized into smaller resolution that can be fit on a PDA screen. The adaptation server is not in the scope of this research, therefore it is another research topic that is conducted by other college.. 5.2.4 Download the image map and annotation data associated with it for presentation (Step 5) The images below are actual screen of PDA that has been synchronized into an emulator on a computer for capturing purpose. The content user can download maps with POI information from the adaptation server, and view the contents inside XMG Player. Figure 47 shows our XMG Player downloading a map.. 44.
(54) Figure 47. XMG Player downloading map. After download completed, the map will looks like the figure below (Figure 48). User can drag on the map to navigate around. And clicking on different buttons in the toolbar below, different POI will be displayed. Then user can view detailed information by clicking on the POI.. Discounts. Recreations. Activities Souvenirs Figure 48. A map presented in XMG Player. 45.
(55) Figure 49 and Figure 50 shows the details of a POI when user clicks on it. The content has been adapted to suit PDA environment, when comparing the presentation on the PDA with the same map presented on a PC, the presentation style will be different.. Discounts. Recreations. Activities Souvenirs Figure 49. Touring information presented in XMG Player. Discounts. Recreations. Activities Souvenirs Figure 50. Textual information associated with POI. 46.
(56) Chapter 6 – Conclusions 6.1 Conclusions for this research In this research, the methodology we proposed can guide content creator step by step from archiving the images to authoring, and let content user browse the images and annotations in a meaningful presentation style on any computers with internet connection. Rich media annotations that can integrate with slide images. And not only the traditional textual information but also multimedia annotations (video, audio, graphics, and images). When comparing our system with the systems as in Table 1, our system uses pure web solutions which will not require any proprietary plug-ins. The same methodology can be easily extended to different areas which required annotation system. For example, we used pathology virtual slide and GPS navigation map as our examples, but it can be also used in GIS (Geographic Information System). In medical education area, this methodology can be applied to microscope laboratory for pathology teaching. Virtual slide system helps improve student’s learning result and save the cost of buying expensive high magnification microscopes and process of making multiple copies of glass slides. Instructor will only need to make one copy of the glass slides and use this methodology to convert them to virtual slides for students to study.. 47.
(57) 6.2 Future works Current annotations are stored in XML files, in the future annotations can be stored inside SQL server, which enables user to search a particular annotation. Because searching for an annotation in the XML files will be very inefficient, the time delay will not be very convenient for user. Improve the algorithm for fetching images from repository server, so response time will be faster and smoother. Use this methodology in different teaching subject, for example radiology. Which can improve student’s learning experience and result.. 48.
(58) References [1]. Electronic learning, Wikipedia. Available: http://en.wikipedia.org/wiki/E-learning. [2]. XML-Based Virtual Slide Box for Teaching Histology and Pathology. Available: http://cclcm.ccf.org/vm/virtual_slideboxes.asp. [3]. MicroBrightField Inc. Available: http://www.mbfbioscience.com/. [4]. the Virtual Slidebox. Available: http://www.path.uiowa.edu/virtualslidebox/. [5]. Comparison of a Virtual Microscope Laboratory to a Regular Microscope Laboratory for Teaching Histology. THE ANATOMICAL RECORD (NEW ANAT.) 265:10–14, 2001.. [6]. The Virtual Slide Set – a Curriculum Development System for Digital Microscopy. AMIA 2003 Symposium Proceedings. pg 846. [7]. VirtualSlide, University of Pittsburgh. Available: http://virtualslide.upmc.edu. [8]. Virtual Slides: High-Quality Demand, Physical Limitations, and Affordability, Human Pathology, Volume 34, Issue 10, Pages 968-974.. [9]. vMic – The Virtual Microscope. Available: http://alf3.urz.unibas.ch/vmic/. [10] What is HTML, World Wide Web Consortium. Available: http://www.w3.org/MarkUp/ [11] Extensible Markup language, World Wide Web Consortium. Available: http://www.w3.org/XML/ [12] XML, Wikipedia. Available: http://en.wikipedia.org/wiki/Xml [13] JavaScript, Wikipedia. Available: http://en.wikipedia.org/wiki/JavaScript [14] A re-introduction to JavaScript, Mozilla Developer Center. Available: http://developer.mozilla.org/en/docs/A_re-introduction_to_JavaScript [15] Virtual microscopy for learning and assessment in pathology, Journal of Pathology 2004, Pages 613-618. [16] Virtual microscopy: a new effective tool in the laboratory. SCS Congress Report 2006, Pages 16-19. [17] soEZMarker by Bestwise International Computing Co. Ltd. Available: 49.
(59) http://www.caidiy.com/ [18] Bestwise International Computing Co. Ltd. Available: http://www.caidiy.com/ [19] Chi-Chung Hung, The Context Aware and Content Adaptation of Template Based Multimedia Presentation on Handset Device - Using Template Based English Test Questions with Multimedia Contents as Examples, Master Thesis of N.C.T.U. Taiwan, 2006. [20] Visual Basic 2005, Microsoft Co. Available: http://msdn2.microsoft.com/zh-tw/vstudio/default(en-us).aspx [21] TIFFComp OCX Description. Available: http://www.aperio.com/documents/api/Aperio_TIFFComp_OCX_descri ption.pdf [22] Aperio Technologies Inc. Available: http://www.aperio.com/ [23] soEZAuthoring by Bestwise International Computing Co. Ltd. Available: http://www.caidiy.com/ [24] Borland C++ Builder 6.0 Available: http://www.borland.com/ [25] Microsoft Internet Explorer. Available: http://www.microsoft.com/windows/ie/default.asp [26] Mozilla Firefox. Available: http://www.mozilla.com/firefox/ [27] Opera Web Browser. Available: http://www.opera.com/ [28] Mac OS X Safari. Available: http://www.apple.com.tw/macosx/features/safari/ [29] Prototype JavaScript framework. Available: http://www.prototypejs.org/ [30] script.aculo.us JavaScript framework. Available: http://script.aculo.us/ [31] JavaScript VectorGraphics library. Available: http://www.walterzorn.com/jsgraphics/jsgraphics_e.htm [32] dTree. Available: http://www.destroydrop.com/javascripts/tree/ [33] Mio Technology. Available: http://www.mio-tech.com.tw/. 50.
(60)
數據
+7
![Figure 6 illustrates the idea of our proposed methodology. It can be divided into two main levels [16]: archiving level and application level](https://thumb-ap.123doks.com/thumbv2/9libinfo/8380598.178166/21.892.180.722.403.956/figure-illustrates-proposed-methodology-divided-levels-archiving-application.webp)
Outline
相關文件
[r]
五年級課輔班共有 48 位學生,其中有 30 位學生的視力不合
D5.1 應用1個具體圖像代表 1個單位,製作象形圖 D5.2
Read the Poster for the Shatin Festival of Performing Arts Song Writing Competition (Text 1) and answer questions 1-5.. Blacken the circle
[r]
It is interesting that almost every numbers share a same value in terms of the geometric mean of the coefficients of the continued fraction expansion, and that K 0 itself is
1.列舉不同投影法的地圖數幅 相同地區,採用不同的投影法所繪製的 地圖,用以呈現,在不同投影下同一地 區有面積、方向、形狀上的不同 2.臺灣地區 1/25000 的地形圖
– S+U can also preserve annotations of synthetic images – Refined images really help improving the testing result – Generate > 1 images for each synthetic
