行政院國家科學委員會專題研究計畫 成果報告
偶氮性染料之臭氧預處理對生物降解之影響(2/2)
計畫類別: 個別型計畫 計畫編號: NSC92-2211-E-002-064- 執行期間: 92 年 08 月 01 日至 93 年 07 月 31 日 執行單位: 國立臺灣大學環境工程學研究所 計畫主持人: 蔣本基 共同主持人: 張怡怡 報告類型: 完整報告 報告附件: 出席國際會議研究心得報告及發表論文 處理方式: 本計畫可公開查詢中 華 民 國 93 年 12 月 23 日
1. Introduction
Textile industry is a very important industrial sector in Taiwan that contributes to domestic economy greatly. The characteristics of textile dyeing industry include large amount of water usage, the diversity of dyes and auxiliaries employed in manufacturing processes, many complicated processes used in textile industry may consume huge amount of energy, nonetheless, extensive labor force too. Although, textile industry becomes a sunset industry in Taiwan gradually, it still has the chance to transform from labor, capital, and material use intensive industry to cleaner and safer consumer product manufacturing, if we can turn the bad image of as forementioned.
Dyestuffs are the major chemicals that are widely used in coloring textiles, it not only can be used in textile, but also in the manufacturing of food, cosmetic, plastic ware, paints, and other consumer products. Since its wide application among all industries, the importance of dyes in manufacturing cannot be ignored and the caused problem needed to be fixed. The major application for dyestuffs is in textile coloring. Because dyestuff cannot be totally utilized during dye bath processes, unbinding dyestuff will be washed off in the following rinsing processes. It thus, certain amount of unused dyestuff is discharged into wastewater system. Some dyestuffs are non-biodegradable, carcinogenic, and color-persistent in water environment, that will cause visual unpleasant and may damage to aquatic ecosystem. On the other hand, the composition of textile dyeing wastewater is very complicated and it is difficult to treat. Even though adding chemicals to bring down the pollutants, the amount of sludge generation and disposal cost are not acceptable.
The ozonation application on water treatment has investigated for decades. Because of its high oxidative ability, ozone plays as a strong oxidant in water treatment, ranging from disinfection to the removal of persistent chemicals,
suggesting that ozone bears with effectiveness and completion. Many demonstrations have proven its feasibility in water treatment. Some researchers have studied the alternative of ozone on wastewater, hazardous waste, and chemical reaction kinetics in recent years, numerous research papers have published and indicated that ozone may serve as a important agent in many field of treatment. Because of the high oxidation strength, the COD and impurities in wastewater can be oxidized and decolorized, ozonation can make up the deficiency of secondary treatment as well. Some investigators have viewed ozonation as a promising technology followed after nanotechnology in next decade.
2. Literature Reviews
2.1 Colorant
Colorant is the one of major components that cannot be ignored during colorization processes. Depending on its solubility and the affinity between fiber and dyestuff, colorant can be divided into dyestuff and pigment. Usually, dyestuff can dissolve homogeneously or highly diffusive in water that can color the fiber evenly. For the pigment, usually it does not come with the affinity with water or fibers, it needs chemicals, such as adhesives and binders, to let pigment fix on fiber or other surfaces.
Colorant can be divided into two categories as: natural and synthetic products. Natural dye can be extracted from minerals or plants. There are evidences that show human being had applied mineral dye in painting or drawing before history. Until 1856, a British chemist Dr. W.H. Perkin used the based material from coal tar oil to synthesized quinoline. By accidentally, Dr. Perkin discovered mauvein (a basic dye), a kind of purple colored material. In 1860, Dr. Perkin successfully synthesized aniline blue. Since then, the research on synthetic dye was booming in England and to rest of world (Dyeing & Finishing).
Synthetic dye may base on the application or its chemical structure. Usually, the dye users prefer the way of categorization by its application. Thus, it was illustrated in Table 2.1
Table 2.1 the category of dye by its application Direct dye
Acid dye Direct coloring
Base dye
Mordant coloring Mordant Dyestuff Mordant coloring Acid Mordant Dyestuff Vat dyes Reductive coloring
Gabrian Sulphur Color illusending Naphthol Dye Disperse coloring Disperse dye
Reactive dye
Florescent whitening dye Oily dye
Pigment
The dye can be categorized by its chemical structure that include 21 different structures that are shown in Table 2.2:
Table 2.2 Chemical structures
Nitroso Nitro Mono-azo Di-azo
poly azo Stibene Diphenyl methane NH
Triaryl methane
Xanthene Acridine Quinoline Methine
Thiazole Indamine Azine Oxazine
Thiazine Carbonium Indigoid Anthraguinone
Phthalocyanine
2.2 Azo dyes
Azo dye is a kind of synthetic organic dyes that contain nitrogen as the azo group -N=N- as part of their molecular structures which links two sp hybridised carbon atoms (as part of aromatic atoms); more than half the commercial dyes belong to this class. Depending on other chemical features, these dyes fall into several categories defined by the fibres for which they have affinity or by the methods by which they are
applied (Encyclopædia Britannica). They are manufactured from aromatic amines by azo coupling reaction that may occur under room temperature. Most azo dyes contain only one azo group, but some contain two (disazo), three (trisazo) or more. In theory, azo dyes can supply a complete all range of colors. But practically and commercially, they tend to supply more yellows, oranges and reds than any other colors.
Azo dyes exhibit bright, high intensity colors, more than the anthraquinones, a next most common dye been used; they have good fastness properties, but not so good as the carbonyl and phthalocyanine dyes, they are applied in printing, painting, plastics, color printing, stationary, rubber, and leather processing. Azo dyes are inexpensive comparing to other classes of dyes that may due to the processes involved in manufacture. Furthermore, the simplicity of the reactions, low energy requirements for the reaction, all reaction carried out in water maybe the key issues for azo dye to compete with other dyes based on the cost. So far, there are more than 2000 commercialized dyes of which half are azo dyes (Chu et al, 2000). Since, dyestuff is applied in industries widely, they become one of important materials that cannot be ignored in product manufacturing.
As forementioned, the dyestuff applied in textile industry may include acid, basic, azo dye etc., and the azo dyes are the most important dye among them because of the consumption amounts. The amount of dye production in Taiwan increased from 35 kilotons in 1991 to 69 kilotons in 2001 (Statistic Department, 2002).
The reason for dye illuminating is because it bears with illuminating groups, Hao (2000) had concluded the illuminating groups of azo dyes as shown in Table 2.3.
Table 2.3. The structure of illuminating groups of azo dyes
Ye l l o w - G r e e n
Ye l l o w
R e d
B l u e
During textile dyeing process, many chemicals, such as NaCO3, NaCl, and
NaCO3, have been added into reactors, even may added surfactants as add or for the
purpose of impurities removal, following are the typical structures of surfactants that have been used in textile dyeing process normally (Shenai, 1976) and shown in Table 2.4:
Table 2.4 The common surfactants used in textile dyeing process
Chemical Structure Aniline
Soap 3R-COONa Nonyl phenol-ethylene oxide
2.3 The use restriction of azo dye
NH2 C9H19 O(CH2CH2O)19H N N NH2 O2N N N N(CH2CH3)2 O2N N N N N OH OH N N N(CH3)2
In the announcement of European Parliament Directive 2002/61/EC, the
European Union (EU) had decided that azo dyes in consumer goods had to be enacted. Because azo dyes contain one or more nitrogen-nitrogen double bonds in their
chemical structure, under reductive conditions and using sodium dithionite, these azo groups can be cleaved to form two amines, shown as follows:
The chemical groups A and B are aromatic or aryl species in order to stabilize the electron structure and absorb light in the visible range, so the amines formed by cleavage of the azo group will obviously be aromatic amines. A small number of the aromatic amines are classified as carcinogenics or potentially carcinogenics to
humans. Table 2.5 lists 22 aromatic amines. Further one of the most recent amines added to the list is 4-aminoazobenzene, which in itself contains an azo group
(European Union, 2003).
Table 2.5 List of aromatic amines according to the EU Directive 2002/61/EC.
No. Substance CAS number CAS number
1 4-aminodiphenyl 92-67-1 2 benzidine 92-87-5 3 4-chloro-o-toluidine 95-69-2 4 2-naphthylamine 91-59-8 5 4-amino-2',3-dimethylazobenzene 97-56-3 6 2-amino-4-nitrotoluene 99-55-8 7 4-chloroaniline 106-47-8 8 2,4-diaminoanisole 615-05-4 9 4,4'-diaminodiphenylmethane 101-77-9
10 3,3'-dichlorobenzidine 91-94-1 11 3,3'-dimethoxybenzidine 119-90-4 12 3,3'-dimethylbenzidine 119-93-7 13 3,3'-dimethyl-4,4'-diaminodiphenylmethane 838-88-0 14 4-cresidine 120-71-8 15 4,4'-methylene-bis-(2-chloroaniline) 101-14-4 16 4,4'-oxydianiline 101-80-4 17 4,4'-thiodianiline 139-65-1 18 2-aminotoluene 95-53-4 19 2,4-diaminotoluene 95-80-7 20 2,4,5-trimethylaniline 137-17-7 21 2-methoxyaniline 90-04-0 22 4-aminoazobenzene 60-09-3
2.4 The ozone characters
Ozone is a gas with the property of low solubility and high reactivity that can oxidize organics and kill pathogens, it has been applied in many fields including drinking water and de-odor treatment. It is gaseous and colorless under room temperature but with strong smell which can be detected under very low concentration (0.02-0.05 ppm). Nonetheless, ozone (2.07 eV) is a strong oxidant and its oxidation ability is next to the hydroxyl free radicals (OH), 2.8 eV. As dissolved in water, ozone will stimulate the formation of OH that will react with organics or inorganics in water. As a result, the pollution level can be reduced and color remaining in water can be removed too.
Ozone will self-decompose into oxygen in water that may not cause pollution problems when apply ozone treatment to water. Under 20 oC, the solubility is only 570 mg/l whereas the solubility for chlorine gas is about 12 times of ozone. In general, the ozone concentration generated from ozone generator usually is less than 14 % (V/V) that may restrict the transportation between gas and liquid phases. Thus,
residual ozone concentration in water treatment ranges from 0.1 to 1 mg/l. Higher dissolved ozone concentration may happen only if under better mass transport conditions. Langlais et al. (1991) had reported that ozone solubility will decrease as temperature increasing that can apply to all cases of gas dissolve in water, and it is affected by [H+] and ionic strength, a regression was proposed as:
ln(HA) = 0.45 + 0.043T (oC) (1)
Per ozone decomposition, Qiu (2001) employed batch reactor to study the decomposition of ozone, under 25℃, the concentration of OH group has positive relationship with ozone reaction rate constant, which shows as first-order reaction:
kd=20[OH-]0.5+900[OH-] (2)
Gurol and Singer(1982) focused on the study of ozone decomposition in pure water and proposed following equation:
rO3=kd
[ ]
O3 2 (3)Gurol gave the kd definition as rate constant and ionic strength and the pH value
of buffer solution can affect kd value.
Some other researcher (Ku et al, 1996) used bubble column to analyze the decomposition behavior of ozone in water and proposed the equation as:
−d
[ ]
O3 /dt=23.47[ ] [ ]
O3 1.5 OH 0.359 +0.1414[ ] [ ] [ ]
Iuv 0.9 O3 1.5 OH 0.064 (4)Soleto used two film theory to illustrate the phenomena of ozone in liquid and gas phases under steady state, and the mass balance of ozone can be expressed as:
[ ]
(
[ ] [ ]
)
[ ]
[ ]
[ ]
1.5 3 5 . 0 3 3 3 3 3 k a O O k O k OH O dt O d b A LO − ∗ − − − = (5)Cogo et al. (1999) proposed the ozone concentration in gas phase (CG) and liquid
phase (CL) shall have linear relationship as expressed as
* L G mC
C = (6)
When quantified ozone mass transfer, Cogo proposed following equation:
(
L L)
L k aC C dt dC − = * 1 (7)Other researcher, Andreozzi (1999), used para-chlorophenol (CHP) as research target and emploted Hatta’s Number as the way to describe mass transfer
( )
2 0 3 o L in O k zkC D Ha = (8) where z = ozone coefficient,k = the ozonation rate constant of CHP
kL0= mass transfer coefficient in gas phase
CIn0= para- CHP initial concentration
DO3= dispersion coefficient of ozone in water
Ha = Hatta’s Number
equation for CHP and ozone as:
para-CHP+zO3 products (9)
Also, Andreozzi proposed the mass transfer relationship between ozone and CHP as following:
[ ]
(
[ ] [ ]
)
[ ]
L B B L B in B B V V E O a k O O V Q dt O d 0 3α
3 3 3 = − − . (10)[ ]
(
[ ] [ ]
)
F B F F O O V Q dt O d 3 3 3 = − (11)[
]
[ ]
z E O a k dt CHP d L 3 Bα
0 − = (12)Where VB = bubble volume
VF = freeboard volume
VL = reaction volume
t = reaction time
[O3]in = the initial concentration of ozone in gas phase
[O3]B = the volume of ozone bubble
[O3]F = ozone freeboard volume α = Ostwald coefficient
E = enhance factor
Beltràn employed semi-batch reactor and introduced ozone/UV, ozone/ H2O2 or
H2O2/UV to study and define enhance factor (E) as:
V aC k m m E O L i * 0 3 − = (13)
Where E was the enhance factor, mI and m0 are the ozone molar flow rate of inflow
and outflow respectively.
kLa = volumetric coefficient of mass transfer
C*O3 = the ozone equilibrium concentration in water
V = reaction volume
DO3 = dispersion coefficient of ozone (1.3×10⁻⁹m2s-1)
DI = dispersion coefficient of solute (10-10m2s-1)
kL = mass transfer coefficient in liquid phase (3×10⁻⁴m2s-1)
kd = reaction rate constant
Then, Beltràn defined the efficiency of ozonation (Ef) as:
100 0 × − = i i m m m Ef (14) and, the stochiometric of ozonation, z, will as
zO3+ M Products (15)
(
COD COD) (
V mit qt)
z − − = 0 3200 (16)where, COD and COD0 represent the concentration in the time t
qt = molar number of ozone under time t
Beltràn found out, no matter what condition had been conducted, z almost is a certain value, which locates between 1 and 2.
2.6 Reaction kinetics
the other is indirect reaction, ozone can produce OH• groups and that free radicals can react with reactant directly. The reaction mode can be shown as following
Direct Reaction
Indirect Reaction
Langlais et al. (1991), Beltràn et al. (1992), and Parishena et al. (2000) all proposed ozone could react with organic matters (M) and could be classified as a first-order reaction. Its reaction mechanisms are:
O3 + M products (17)
O3 + M OH•+ products (18)
M + OH• products (19)
M + OH• OH2•+ products (20)
Where the ks value represent the reaction rate. Hermanowicz (1999) proposed ozone decomposition could be described as first-order reaction kentics. Under batch reaction, the ozone decomposition were 0.2-4orders or n-th order kinetics.
For the decolor of dyeing water, Arslan (2000) used reactive dyes, Procion Yellow HE4R and Black SB, as target compounds and proposed following reaction kinetics equations: COD K dt dCOD COD = − (21)
where KCOD = K[COD]
2.7 Biodegradation O3 +M O H• MOX OH•M M’OX k2 k3 k4 k1
Usually, the biodegradation of azo dye in wastewater was difficult to be
enhanced without any further oxidation. Haug (1991) and Wuhrmann (1980) stated, no matter under aerobic or anaerobic conditions, it is difficult to employ biological treatment to treat textile dyeing wastewater alone.
As mentioned, the oxidation of azo dyes may produce amines that were toxic to aqueous ecosystem, nonetheless the activated sludge system. Ozonation may serve as an important and promising method in enhancing the biodegradation of azo dye that would benefit to the following treatment units. Hao et al. (2003) had pointed out ozone treatment could reduce COD and color significantly; the BOD would be
enhanced too. It thus, the BOD5/COD values usually would larger than 0.1,
indicating that the biodegradable organics increased after ozone treatment. Because of the structures of azo dyes, as described previously, it is difficult to use biological treatment to deal with wastewater that containing azo dyes.
O’Neill (1999) paper revealed that under the condition of without ozonation treatment unit, and to study the aerobic or anaerobic treatment processes of Procion Red H-E7B. O’Neill employ USAB reactor and inner-circulated digestor (ITD) to study the biodegradation of reactive dyes. He found out under the aerobic condition, COD and BOD removal rates could reach 347 and 71% respectively of 57 days, but no color removal function.
2.8 Ozonation vs. Biodegradation
Beltràn (1999) employed continuous activated sludge system combine with ozone/UV treatment to treat municipal sewage, he observed the COD and BOD/COD changes in activated sludge unit. As the results, he stated that if without adding post ozonation unit and retention time equaled to 5 hours, the COD removal rate was 59.1%, MLVSS was 37.2%, and BOD/COD was 0.16. But, if adding post ozonation unit, COD and MLVSS degradation ratio could reach 71 and 78.4%, respectively, and BOD/COD could be raised to 0.36. To sum up, post ozonation unit combined with continuous activated sludge system could treat municipal wastewater and reach
excellent results, other than that, post ozonation unit could reduce the concentration of total nitrite and benefit to biological treatment.
3. Materials and Methods
The experimental setup in this study can be divided into two systems, one is semibatch system and the other is continuous countercurrent bubble column system. Different azo dyes are applied in both systems to investigate the reaction kinetics, mass transfer efficiency, decolorization, and mineralization under various designed conditions.
3.1 Material
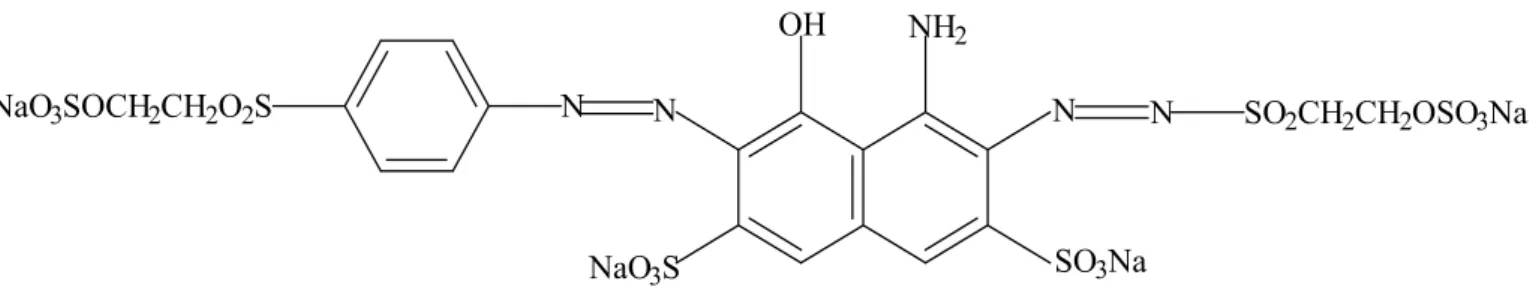
The target compounds used in this study included Acid Orange 6, AO 6, was provided by Sigma-Aldrich and Reactive Black 5, RB 5, was provided by Yi-Hwa Co., both structures were shown in Fig. 3.1. Both target compounds used without further purification. The physical and chemical properties of both compounds were shown in Table 3.1.
The chemicals for COD, TOC, and BOD5 were purchased from Sigma-Aldrich. (a) AO 6
NaSO3 N N
OH
(b) RB 5
Figure 3.1 The chemical structures of (a) AO 6 and (b) RB 5.
NaO3SOCH2CH2O2S N N
NaO3S SO3Na
N N
OH NH2
Table 3.1. Physical and chemical characterizations of AO 6 and RB 5
Property Acid Orange 6 Reactive Black 5
Class
Monoazo Disazo
Maximum wavelength (λmax) 490 nm 597 nm
Molecular formula C12H9O5SN2Na C26H21N5Na4O19S6
Molecular weight (g/mol) 316 991
COD (mg/L) TOC (mg/L) 188 77 Under [Dye]= 75 mg/L: 76 11
3.2 Experimental design and setup
The experimental design consideration for ozonation reactors in this research can be divided into two systems that are bubble column and semi-batch reactor. The unique characteristics of two systems are that comprises three major parts: feeding system, reactor, and monitoring system. The design considerations are quite different between to systems and illustrated as following sections.
3.2.1 Semi-batch system
Semi-batch reactor for ozonation is a typical and effective instrument to study reaction kinetics and Henry’s constants. The reactor design is followed McCabe, et al. (1993) a standard 6-bladed-disk turbine design and made of Pyrex glass, with an inner diameter of 17.2 cm (effective volume of 5.5 liters), and equipped with a water
jacket to maintain a constant solution temperature of 25 oC. The cylindrical gas
distributor with a pore size of 10 µm was located at the bottom of the reactor. The total sampling volume is less than 5% of total reaction volume to minimize the affect
of sampling on reaction.
The ozone was generated from pure oxygen in an ozone generator (model SG-01A, Sumitomo, Tokyo, Japan) that ozone-enriched gas was conducted from the distributor at the reactor bottom, and the feed rate might be controlled by a precision flow control meter (Cole-Parmer, MI, USA). The apparatus was shown in Fig. 3.2.
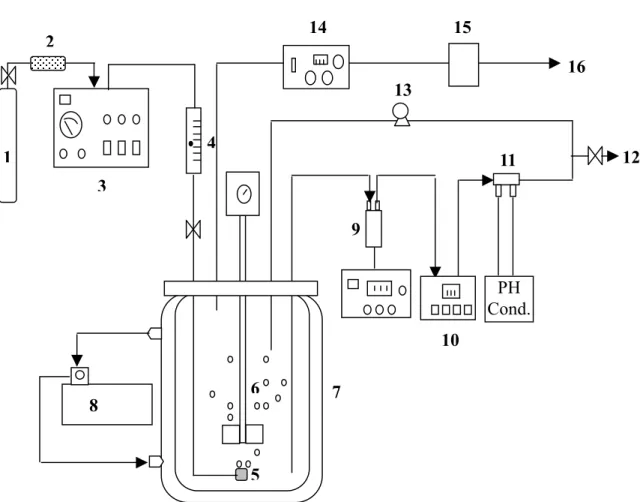
Figure 3.2 The experimental apparatus sketch of stirred reactor.
Components: 1. Oxygen cylinder, 2. Desiccative tube, 3. Ozone generator, 4. Digital flow meter with precision control, 5. Ozone gas distributor, 6. 6-bladed-disk turbine, 7. Reactor, 8. Thermostat, 9. Liquid ozone sensor, 10. Photospectrometer, 11. pH and conductivity sensors, 12. Sampling port, 13. Circulation pump, 14. Gaseous ozone detector, 15. Washing bottles with KI solution, 16. Ventilation.
13 PH Cond. 4 3 2 1 5 6 9 10 11 12 14 15 16 7 8
3.2.2 Countercurrent bubble column
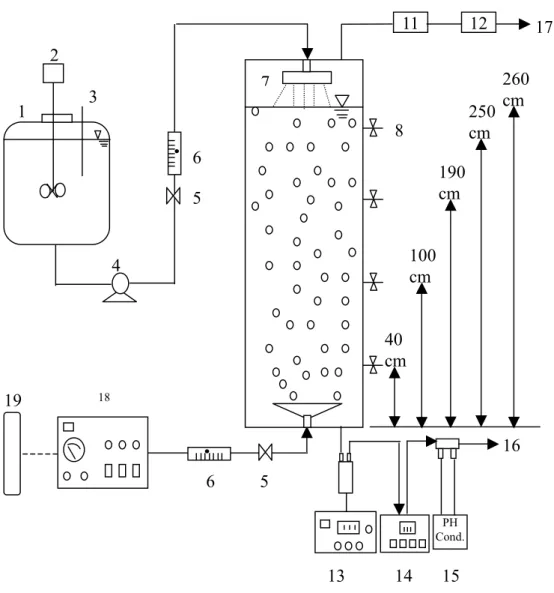
Fig. 3.3 shows the schematic diagram of ozone contacting bubble column. The column is made of PVC, 3.5-m high and 14.2-cm inner diameter, was operated in the countercurrent mode with water flowing downward and gas flowing upward. The upright bubble column was pre-customized and equipped with 7 sampling ports with ball valves. An overflow pipe was connected to column to prevent water overflowing into off gas monitoring instruments.
A stainless steel (SS 316) sparkle was facilitated on the top of column that was mounted on the cap. At the bottom, a ceramic filter plate was used to serve as gas distributor that average pore size was about 50 µm. Ozone-enriched gas was pumped through a one-way valve (Swiglog) and enter into bubble column system that could resist the pressure up to 3000 psi. The gas flow rate was controlled by a flow meter with precision control (Cole Parmer). Ozone gas and water were both introduced continuously into the contactor. Ozone-containing gas was generated with pure oxygen by a Sumitomo SG-01A generator and introduced into the column that mixed gas flowed through a ceramic diffuser located at 10 cm from the bottom of the contactor.
A circulation pump (IWAKI, Tokyo, Japan) with Teflon wet part was added to the system for further experiment on semibatch type. Effluent was discharged from the bottom of column that was conducted into sewer system, a pin valve with Teflon wet part was used to control the effluent discharge rate as well as the maintain the liquid level during the experimental course.
The liquid-storage tank was equipped with the thermostat to maintain a constant
temperature of solution at 25 oC in all experiments, and a stirring system to keep the
Figure 3.3 Experimental setup. The denoted numbers on above figure are described as follows: 1. Water Tank, 2. Stir, 3. Water leveling meter, 4. Thermostat w/ temperature controller, 5.Drainage, 6.Pump, 7. Flow control valve w/ PID control, 8. Digital flow meter, 9. Pressure transmitters, 10. Sparkle, 11. Bubble column reactor
(300 × 12.5 ID ), cm, 12. O3 gas distributor, 13. Sampling ports, 14. Sensor box (fitted
with pH, DO, Conductivity, dissolved O3), 15. O3 gas detector, 16. O3 gas destroyer
and 17. Vent to hood, 18. Ozone generator, 19. Oxygen supply.
11 12 17 19 13 18 7 40 cm 100 cm 190 cm 250 cm PH Cond. 1 2 3 5 4 6 8 5 6 14 15 16 260 cm
3.3 Experimental procedures 3.3.1 Semibatch system
Before starting a semi-batch experiment, following steps were preceded:
1. Prepare [AO 6] = 200 mg/L of stock solution for further experiments that may depend on the requirement to add buffers into solution, that buffers were comprised with the combination of phosphates.
2. Turn on the thermostat to maintain the desire temperature such as 15, 20, 25,
and 30 oC, and wait for the state become steady; that may need about 60 min.
3. Turn on ozone generator (Sumimoto SG-10A) and set the ozone generation node to certain mark that was pre-tested by directed ozone-containing gas to an ozone monitor (model 1008-HC, Dasibi, CA, USA), which was previously calibrated with the KI solution.
4. As the ozone concentration kept steady, turn the three way valve and let ozone-enriched gas bubbled into the solution that was prepared beforehand. 5. Meanwhile, record the monitoring data shown on the pH (Suntex),
conductivity (Suntex) and the visible light spectrum (model Cintra 20, GBC Scientific Equipment, Australia).
6. A dissolved ozone monitor (model 3600, Orbisphere Laboratory, Switzerland) with a membrane-containing cathode sensor was used for the analysis of dissolved ozone concentration.
7. At certain time interval, sample was draw from reactor for further parameters testing.
3.3.2 countercurrent bubble column reactor system
In this experiment, stock solution was prepared by dissolving RB 5 (75 mg/L) into water that was stored in a water tank. The solution temperature was kept at
25oC and the stir was on during the experimental runs. Follow the step 3 to 7 described in section 3.3.1. As experiment initiated, the steps for ozone generation, monitoring, and data collection were similar to semibatch system. It was very important to maintain the liquid level at 2.6 m throughout the experimental runs. The sampling was different to the semibatch system. Because the column height may refer to the contacting time of ozone with RB 5, thus, the samples were draw from bubble column system not only at effluent port but also from the sample port of four different height, 0.4 m, 1.0 m, 1.9 m, and 2.5 m. A set of monitors, including pH, conductivity, ORP, dissolved ozone sensor, and the absorbance of visible wavelength, were facilitated and the data was recorded.
3.4 Analytical Method
The analytical methods used in this study can be divided into following groups.
1. Ozone gas was determined by bubbled through a 250mL capacity gas wash bottle filled with 2% potassium iodide (KI) solution, then, titrated with sodium
thiosulfate (Na2S2O3) according to APHA. The off-gas is monitored by an
ozone analyzer (Dasibi model 1008-HC, California, USA) and calibrated by 2% KI solution as well.
2. The liquid dissolved ozone concentration is monitored by a liquid ozone monitor (model 3600, Orbisphere Laboratory, Neuchàtel, Switzerland) that equipped with a membrane-containing cathode sensor to analyze dissolved ozone concentration, and calibrated by the indigo method which are described in APHA.
3. The absorbance of λ597 nm (A597 nm) and UV254 is performed by a UV-Visible detector (model Cintra 20, GBC Scientific Equipment, Victoria,
Australia). The visible wavelength absorbance was examined by using wavelength scanning from 400 to 700 nm and integrated the area, expressed as integrated absorbance unit (IAU), under absorbance curve. The IAU is proportional to sample color which has been mentioned in previous study (Wu and Wang, 2001).
4. The UV254 absorbance was followed the method described in Standard Methods section 5910.
5. The calibration for dye concentration, AO 6 as an example. Take 6 different AO 6 concentrations and used UV-Visible detector to scan the absorbance from 200 nm to 900 nm, the results were shown in Fig. 3.4. It was found that there were two significant absorbance peaks appearing at 254 nm and 385 nm, indicating that the absorbance peak at 254 nm represented the existing of aromatic compound. For the [AO 6] = 0 – 50 mg/L, the scanning was shown in Fig. 3.5 indicating that the well distribution of absorbance peak at 385 nm and with low noise signals.
Figure 3.4 The UV – visible wavelength scanning (200 nm to 900nm) for
different AO 6 concentration ([AO 6]=0 to 200 mg/L)
Figure 3.5 The UV – visible wavelength scanning (200 nm to 900nm) for
6. The COD for the ozone treated and untreated dye solution were determined by APHA/AWWA/WCF Standard Method.
7. A TOC analyzer (model 1010, O.I Corporate, USA) was employed to analyze the TOC concentration, the referring document could be found in Standard Methods section 5310.
8. An ion analyzer (Capillary Ion Analyzer, Waters, USA) for the anion analysis. 9. The BOD5 testing was following the method described in NIEA W510.53A
and sludge was provided by Na-Hu sewage treatment plant.
10. Toxicity test was used the commercialized test kit to measure the 50% of effective concentration (EC50) for the samples. The Microtox test kit contains marine luminescent bacteria, Photobacterium phosphoreum, florescent monitor (model m500, AZUR Environmental), diluents. Microtox is the worldwide standard for rapid and accurate toxicity monitoring.
3.5 Tracer test
The tracer test was intended to understand the performance and flow conditions in bubble column. The test protocol was illustrated as follows:
1. Adjust the liquid level to preset height, then, adjusting the gas flow rate and continue to 3 times of hydraulic retention time (HRT).
2. Preparing the NaCl solution ([NaCl] = 100 g/L) and producing the NaCl concentration calibration.
3. Injecting the NaCl solution (about 10 mL) from the top of bubble column, meanwhile count up the time from the injection. After 10 seconds, collecting the samples from the exit of bubble column.
4.
Results and Discussion
4.1 The parameters of water quality for AO 6 and RB 5
The parameters of water quality for the oxidation of AO 6 by ozone was conducted in a semi-batch system. The results were as follows:
4.1.1 Decolorization and mineralization of AO 6 by ozonation with UV irradiation
As mentioned, one AO 6 molecule contains one azo bond that is easily been destroyed by ozone. Breaking the azo bond may disable the function of chromophores and decolorization may be enhanced. Thus, to observe the parameters change may explain the way of ozonated AO 6 and related mechanisms. In order to
compare the difference between O3 alone and O3 with UV irradiation (15 and
30W/m2), both systems will be discuss in the following section.
4.1.2 Variations of pH, Amax, and Color
The results of pH, conductivity, Amax, and color under the experimental
conditions of O3 alone and O3/UV are shown in Fig. 4.1. As ozonation proceeded,
due to organic and inorganic acids formation, the pH decreased rapidly. The pH gradually reached a stable value when organic acids were oxidized.
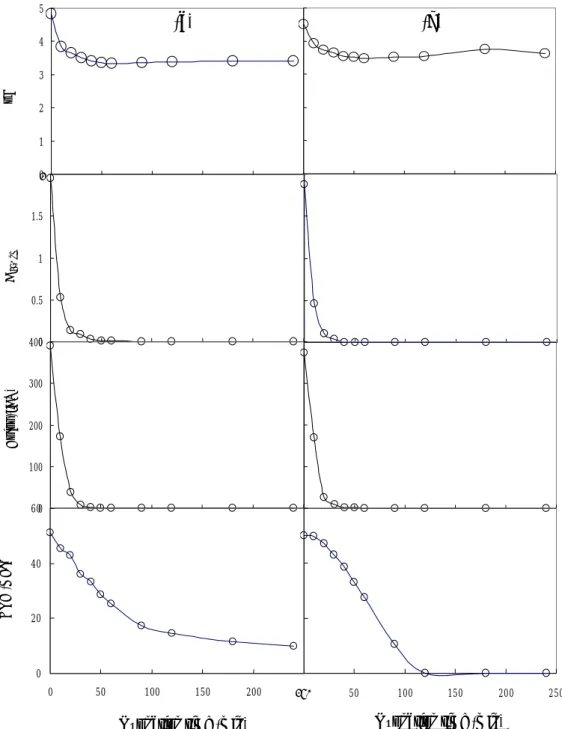
Figure 4.1. Concentration profile of pH, Amax, and color of AO 6 in a semibatch
system. (a) O3 = 18.7 mg/l-min, (b) O3 = 18.7 mg/l-min with UV intensity 30 Wm-2.
(Initial [AO 6] = 0.2 g/l, pH = 4.7±0.1, TOC = 52±2 mg/l, IAU = 390±10, gas flow
rate = 2.1 l/min, 25 oC). (a) (b) pH C ol or (IAU) 0 0.5 1 1.5 2
Ozonation time (min) Ozonation time (min)
2 0 100 200 300 400 0 20 40 60 0 50 100 150 200 2500 50 100 150 200 250 DOC (mg /l ) 250 0 1 2 3 4 5 A 490 nm
Figure 4.2 Concentration profile of DOC, SO42-, NO3-, and NH4+ of AO 6 in a
semibatch system. (a) O3 = 18.7 mg/l-min, (b) O3 = 18.7 mg/l-min with UV intensity
30 Wm-2. (Initial [AO 6] = 0.2 g/l, pH = 4.7±0.1, TOC = 52±2 mg/l, IAU = 390±10,
gas flow rate = 2.1 l/min, 25 oC).
(a) (b) 0 100 0 10 CSO 4 2-( mM ) C N-NO 3 -( mM )
Ozonation time (min) Ozonation time (min) 0 10 0 0.6 0 0.20 0.2 0.4 0.6 0.8 1 250 0.20 1.0 0.00 0.04 0.08 0.12 0.16 0.20 0.20 C N-NH 4 +( mM ) 0.20 0 50 100 150 200 250 0.00 0.04 0.08 0.12 0.16 0.20 0 50 100 150 200 250
The AO 6 species disappeared gradually as observing its absorbance at 490 nm,
the specific wavelength (A490 nm). It is noted that the disappearance of AO 6
followed a pattern almost the same for the O3 alone and the O3/UV system. As
ozonation continued, after 20 min, the rates of AO 6 consumption were much slower than the initial rates, and AO 6 species diminished to undetectable level within 30 min.
The reaction time for the total decolorization in both the O3 alone and the O3/UV
systems was almost the same at an O3 dosage of 18.7 mg/l-min (Figs. 4.1a and 4.1b);
the color disappeared at about 50 min. It, thus, suggested that the contribution of
UV irradiation to decolorization was not important. The xOH radicals generated by
UV are non-selective oxidizers, and under acidic conditions, lesser amount of xOH
radicals would produce and compete with dissolved O3 in reacting with organics. As
a result, the contribution of xOH to the decolorization was not significant. It can be
concluded that dye molecules with azo bond (N=N) were easily destroyed by ozone and generated intermediate products.
The theoretical TOC at AO 6 concentration of 200 mg/l was 92 mg/l. Since AO 6 has a 65% purity, this yield an initial TOC of 60 mg/l. The observed initial DOC
(at AO 6 = 200 mg/l) in this study was 54 ± 2 mg/l, less than the purity-corrected
theoretical TOC. The difference between theoretical and observed value was not
remarkable. DOC reduction in the O3/UV system proceeded faster than the O3 alone
system. Within 120 min, DOC approached zero in the O3/UV system (Fig. 4.1b),
while still remained even after 240 min in the O3 alone system (Fig. 4.1a). That
result clearly indicated that the contribution of UV irradiation on catalyzing O3 to
produce free radicals was remarkable in removing ozonation by-products. For
example, the DOC removal rates for the O3 alone and the O3/UV systems were 0.36
and 0.61 within first 50 min and between 50 and 90 min respectively, at an ozone dose of 0.92 mg/l-min. Evidently, after complete of decolorization (t = 50 min), the DOC
reduction rate was enhanced because most ozone was used to mineralize intermediate products. The results also suggested the remarkable contribution of UV irradiation on mineralization of persistent intermediate products. Pseudo-first order reaction pattern could explain DOC reduction as well as decolorization and the disappearance of AO 6 species.
4.1.3 Sulfate, nitrate, and ammonium formation
Referring to the chemical structure of AO 6, one AO 6 molecule contains one sulfate group and the purity-corrected theoretical sulfate concentration at the end of total minerization should be 0.41 mM. As shown in Fig. 4.2a and 4.2b, sulfate
( 2−
4
SO
C ) was present in the initial test solutions (~ 0.13 mM), indicating that a certain
amount of sulfate was already present in the AO 6 solution, due to the impurity. The
net 2−
4
SO
C production amounted to 0.43 and 0.46 mM at the end of treatment in the O3
alone and the O3/UV experiments, respectively; values agreed with the
purity-corrected theoretical sulfate concentrations. In Fig 4(a) and 4(b), within the
first 50 min of ozonation, the net 2−
4
SO
C generation rate for the O3 alone and the
O3/UV systems were 0.68 and 0.8 mM/min, 0.025 and 0.2 mM/min for the time from
50 to 90 min. The results indicated that sulfate groups were easily released from AO 6 molecules under ozone attack and most sulfate was released within the first 50 min. After 50 min, most of AO 6 species were destroyed and formed intermediate products
that were persistent with respect to be oxidation in the O3 alone system. Ozonation
with UV irradiation would enhance the removal of intermediates with the release of
anionic sulfate. The little difference of net 2−
4
SO
C between the O3 alone and the
O3/UV system at the end of experiments suggested that UV irradiation on sulfate
The nitrate concentrations ( −
3
NO
C ) were about 0.12 mM in both the O3 alone and
the O3/UV systems at the end of experiments. The concentration profiles during the
cause of oxidation were similar to that of sulfate as described above, only the
magnitude was lower. The ammonium ( +
4
NH
C ) was found in the initial solution and
the extent was less than 0.01 mM; that may due to the impurity existed in target
material. The accumulation of +
4
NH
C was insignificant (< 0.1 mM) as shown in Fig
4.2a and 4.2b. As comparing with the purity-corrected theoretical nitrogen concentration (0.83 mM), the observed nitrogen concentration (0.22 mM) was about a
quarter of its theoretical value. It was found that NO2, NO, CO2, and small amount
of SO2 was detected in the off-gas, and the NO2 concentration reached as high as 170
part per billion at the gas flow rate of 2.1 l/min conditions, suggesting that the low observed nitrogen concentration during the experimental course was because of gaseous nitrogen compounds formed. In fact, some researchers have already
reported that organic nitrogen could be oxidized and produced N2 and NOx. The wet
air oxidation of aniline, showed a distribution of the mineralized by-products of 50%
N2, 40% nitrate and nitrite and 10% NH4+ (Oliviero et al., 2003). Photocatalysis of
dichlofluanid generated nitrate and NH4+ (Sakkas and Albanis, 2003).
Photodegradation of direct yellow-12 by using UV/H2O2/Fe2+ generated CO2, CO,
NO, NO2, N2O, SO2 in a batch system (Rathi et al., 2003).
4.1.4 Ozone consumption associated with DOC removal and anionsformation
DOC removal efficiencies (ηDOC) for all experiments are shown in Fig. 4.3. At
O3 of 18.7 mg/l-min and in presence of UV irradiation, the ηDOC was 100% at about
120 min; whereas ηDOC was only 65% and 71% at O3 of 18.7 and 33.3 mg/l-min,
DOC removal, but not the extent of DOC removal. As seen in Fig 4.3, the DOC removal rates were enhanced when color removal at a certain level, indicating that the
availability of O3 molecules for DOC oxidation. Figure 4.4 shows the variation of
the mineralization rate, (DOC0-DOC)/t, with ηDOC under various experimental
conditions. The results illustrated the effects of ozone dose and UV irradiation on the elimination of DOC. It is seen that UV irradiation does not enhance the
mineralization rate significantly when ηDOC < 40%, but, the effect of ozone dose is
remarkable. For the stage of ηDOC > 40%, the value of (DOC0-DOC)/t via O3/UV
were still high while those of the O3 alone system become low. The intermediates in
the later stage of the ozonation of AO 6 such as oxalic acid and formic acid have low reactivity toward ozone molecule (Koch et al., 2002; Cheng et al., 2002). Noting
that the value of (DOC0-DOC)/t in the early stage of ozonation is low because ozone
is consumed mainly for breaking azo bond and opening the aromatic rings.
According to the previous studies on the O3 alone and O3/UV treatment of Acid
Orange 10 (Shu and Huang, 1995) and phenol (Huang and Shu, 1995), the O3/UV has
better performance for the degradation of Acid Orange 10 and phenol than O3 alone.
Thus, the oxidation reaction via xOH radicals is predominant to proceed in the regime
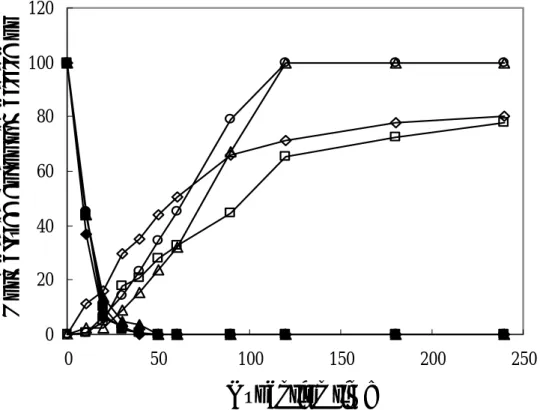
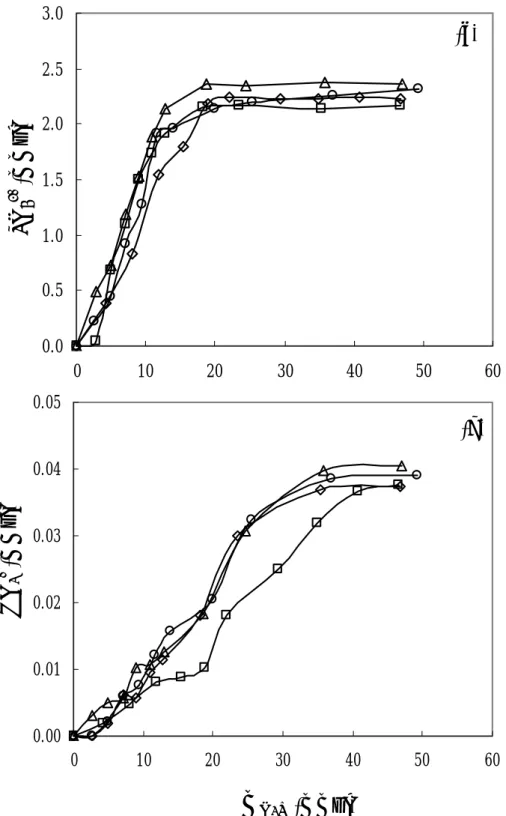
Figure 4.3 The time-course of normalized color remaining (%) and ηDOC (%) under
different experimental conditions: ■, □: color removal, ηDOC at O3 = 18.7 mg/l-min;
◆, ◇: color removal, ηDOC at O3 = 33.3 mg/l-min; ●, ○: color removal, ηDOC at
O3 = 18.7 mg/l-min with UV intensity 15 W/m2; ▲, △: color removal, ηDOC at O3 =
18.7 mg/l-min with UV intensity 30 W/m2
Ozoantion time
Normalized
color
remaining
or
0 20 40 60 80 100 120 0 50 100 150 200 250The ozone consumption (mO3R) and ozone applied (mO3A), eq. 4.1 and 4.2 taken
from literature (Chen et al., 2004) were used.
∫
− − − = t 0 G Ai Ae Al L Ae H R O Q (C C )dt C V C V m 3 (4.1) t C Q mOA G Ai 3 = (4.2)where QG as gas feed rate = 2.1 l/min;
CAi and CAe as the inlet and outlet O3 concentration (mg/min);
CAl represented the dissolved O3 in liquid phase;
VL as the reaction liquid volume = 5 l;
VH as the free space in reactor = 0.5 l;
t = reaction time (min).
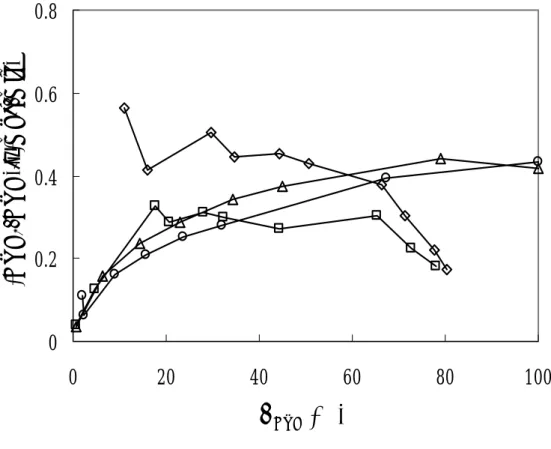
and the ozone consumption ratio (mO3R/mO3A) was determined as well. The
relationship between ozone consumption ratio and ηDOC under various experimental
conditions were shown in Fig. 4.5, which demonstrated ozone consumption ratio was consistent with DOC removal. Evidently, the ozone consumption ratio for all
experimental conditions decreased from 14 to 12% when ηDOC < 40% because the
decolorization in the early stage of the ozonation of AO 6 might consume relative large amount of ozone. When reaching comple decolorization, the ozone consumption ratio will decrease to a constant level. It is noted that the ozone
consumption ratio at high ozone dose (33.3 mg/l-min) decreased rapidly when ηDOC >
50%, suggesting that the amount of consumed ozone decreased as persistent
by-products formed. As seen in Fig. 4.5, the ozone consumption ratios of the O3/UV
system were slightly higher than that of the O3 alone system, indicating that UV
irradiation will catalyze the ozone decomposition (Hautaniemi et al., 1998).
Figure 4.6 illustrates the relationship between sulfate and nitrate generation ozone consumption. It is noted that UV irradiation slightly enhance the amount of
sulfate generation when mO3R < 20 mmole, as shown in Fig 4.6a. For the stage of
mO3R > 20 mmole, the sulfate generation amount via O3/UV was slightly higher than
those of the O3 alone system. For nitrate formation, as shown in Fig 4.6(b), the
enhancement of UV irradiation is not as significant as sulfate, but, the effect of ozone dose was remarkable. It is suggested that more sulfate is formed at early stage of ozonation than nitrate, proving that sulfate is easier to be released from AO 6 molecule than nitrate.
Figure 4.4 (DOC0-DOC)/t vs. ηDOC (%)under different experimental conditions:
□: O3 = 18.7 mg/l-min, ◇: O3 = 33.3 mg/l-min, ○: O3/UV at O3 = 18.7 mg/l-min
with UV intensity 15 W/m2, △: O3/UV at O3 = 18.7 mg/l-min with UV intensity 30
W/m2.
η
DOC(%)
(DOC
0-DOC)/t (mg/l-min)
0
0.2
0.4
0.6
0.8
0
20
40
60
80
100
Figure 4.5 Ozone consumption ratio (%) vs. ηDOC (%) under different experimental
conditions. Notation: □: O3 = 18.7 mg/l-min, ◇: O3 = 33.3 mg/l-min, ○: O3/UV
at O3 = 18.7 mg/l-min with UV intensity 15 W/m2, △: O3/UV at O3 = 18.7 mg/l-min
with UV intensity 30 W/m2.
η
DOC(%)
Ozone consum
ption r
atio
(%)
0
5
10
15
20
0
20
40
60
80
100
Figure 4.6 The variation of (a) SO42- and (b) NO3- vs. mO3R under different
experimental conditions. Notation: □: O3 = 18.7 mg/l-min, ◇: O3 = 33.3
mg/l-min, ○: O3/UV at O3 = 18.7 mg/l-min with UV intensity 15 W/m2, △: O3/UV
at O3 = 18.7 mg/l-min with UV intensity 30 W/m2.
(a)
(b)
SO
4 2-(mmol)
NO
3 -(mmol)
m
O3R(mmol)
0.0 0.5 1.0 1.5 2.0 2.5 3.0 0 10 20 30 40 50 60 0.00 0.01 0.02 0.03 0.04 0.05 0 10 20 30 40 50 604.1.5 The controlling factor effects on AO 6 reduction, decolorization, and TOC removal
1. Temperature
The AO 6 reduction exhibited an exponential decay trend which was similar to the decolorization of azo dye. Both reactions have been considered as a first order
reaction (Langlais and Reckhow, 1990). With sufficient ozone, the decolorization
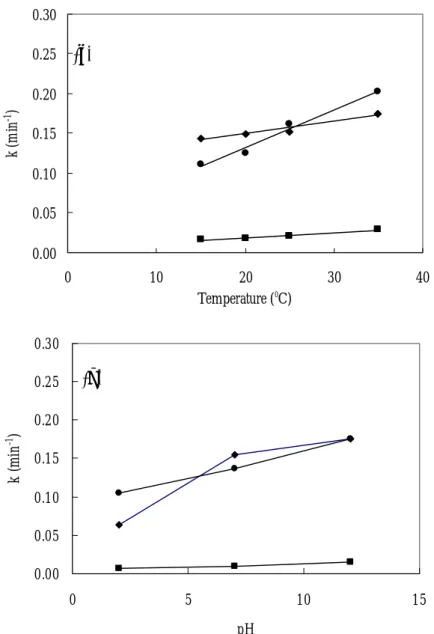
reaction of AO 6 can be described by a pseudo first-order reaction equation that has been reported elsewhere (Wu and Wang, 1998; Hao et al, 2000). As noted in the Arrhenius equation, the reaction rate of a given chemical reaction is increased with raising temperatures. This relationship was verified in this study and is shown in Fig. 4.7a. In Fig. 4.7a, as temperature increased, the AO 6 reduction, decolorization, and TOC removal also increased. The k for AO 6 reduction increased from 0.10 ~ 0.20
min-1 as temperature raised from 15 to 35 oC, the determined coefficient (R2) was 0.98;
for decolorization k increased from 0.14 ~ 0.17 min-1 and R2 was 0.98; for the k
values of TOC removal, it increased from 0.016 to 0.029 min-1 and R2 was 0.94.
The results revealed that the k values of AO 6 reduction, decolorization, and
TOC removal were affected by the rising temperature. The temperature effect on
TOC removal was more significant than on decolorization, the increment percentage
of the k values for TOC removal was 35% as temperature raised from 15 to 35 oC, the
(a)
(b)
Figure 4.7 The Effects of (a) Temperature and (b) pH on the Decolorization and
Removals of AO6 and TOC. Symbol: ●: AO 6, : TOC removal, : Decolorization.
0.00 0.05 0.10 0.15 0.20 0.25 0.30 0 5 10 15 pH k ( m in -1 ) 0.00 0.05 0.10 0.15 0.20 0.25 0.30 0 10 20 30 40 Temperature (0C) k (m in -1 )
2. pH change
Fig. 4.7b illustrates the effects of pH value on the k values of AO reduction, decolorization, and TOC removal. The results indicated that AO reduction, decolorization, and TOC removal rate constants were pH dependent. As pH varied from 2 to 12, the k values for AO 6 reduction, decoloriztion and TOC removal were enhanced with the increase of pH. This experiment was conducted under the following conditions: [AO 6] = 200 mg/l, ozone dose = 2.9 mg/l-min, and temperature
at 25 oC. As mentioned in the previous section ozonation in water could be divided
into direct and indirect reactions depending on pH (Rice, 1997). Under indirect
ozone reaction, ozone dissolved into aqueous solution and hydroxyl free radical (OHx)
was formed. It was reported that at a higher pH value with more OHx, indirect
ozone reaction is prevailing (Langlais et al 1991). In this study, it was found that the k values for AO reduction, decoloriztion, and TOC removal were higher at high pH conditions than that in low pH conditions. Findings from this study regarding the effect of hydroxyl free radicals confirm reports from previous investigators.
Because of the nature of OHx, the declorization processes became faster as more OHx
radicals were generated and attacked on N=N, that would cause the chromophores to detach from aromatic rings. At pH value higher than 7, no dissolved ozone was observed during experimental runs and indicated that indirect ozone reaction was
dominated and OHx were generated.
3. Ozone dose
It was reported that the AO6 decolorization process was strongly affected by the ozone dose and the chromophoric structures of dyes reacted rapidly with ozone and
OHx (Adams and Gorg, 2002). The effect of ozone dose on the k for AO6 reduction
from 2.7 to 3.5 mg/l-min, the k for AO 6 reduction increased from 0.13 to 0.22 min-1
and the k for decolorization increased from 0.14 to 0.27 min-1. Both rate increases
were more than 69%. The significant increase in k suggests that ozone dose plays an important role in AO 6 reduction and decolorization. It also was observed in this study that the k values were higher under basic conditions where OH ions are predominant. The chromophoric structures and azo bonds of AO6 were attacked by
ozone and OHx resulting in higher k values. The effect of ozonation on TOC
removal was not as significant as that on AO 6 reduction and decolorization. The k
value of TOC removal was increased only by approximately 20%. It revealed that decolorization was more vulnerable by the affect of ozone dose than TOC. Clearly,
it needs more dissolved ozone molecules and OHw to reduced TOC than that uses in
breaking N=N bonding. As a result, decolorization showed a significant linear trend
Figure 4.8 The effect of ozone dose on the decolorization and TOC removal. Symbol:
●: AO 6, : TOC removal, : Decolorization.
0.00
0.05
0.10
0.15
0.20
0.25
0.30
2
2.5
3
3.5
4
ln(Ozone Dose) (mg/l-min)
k (m
in
4. TOC removal associated with sulfate formation
As mentioned, sulfate formation was proportionally increased with TOC removal
efficiency (ηTOC). In the ozonation process, aromatic rings of AO6 were opened and
the TOC was oxidized to carbon dioxide. In this process, sulfate was released and
the amount of sulfate would increase as the process continued. The relationship
between sulfate yield ( 2−
4
SO
Y ), decolorization and ηTOC was investigated and the
results are shown in Fig. 5, where:
6 AO SO SO C /C Y 2 4 2 4− =∆ − (4.3) 0 TOC TOC TOC =1−C /C η (4.4)
The decolorization proceeded quickly when ηTOC increasing, indicating that TOC
removal accompanied with decolorization, nonetheless, the 2−
4
SO
Y increased too.
When ηTOC > 0.4, the decolorization almost was completed and the increment
of 2−
4
SO
Y was accelerated, indicating that most ozone or OHx were attacking TOC after
the completion of the decolorization process. From Fig. 4.9, it is observed that the
temperature effect on 2−
4
SO
Y values was significant when the 2−
4
SO
Y values ranged
Figure 4.9 The variation of 2−
4
SO
Y and color remaining vs. TOC removal efficiency
under 15, 25, and 35 ℃ with pH = 7, [AO 6] = 200 mg/l, ozone dose = 9 mg/l/min.
Symbol: 2−
4
SO
Y and color, and : 15 oC; and : 25 oC; S and U : 35 oC.
0.0 0.2 0.4 0.6 0.8 1.0 0.0 0.2 0.4 0.6 0.8 1.0 ηTOC
D
ec
olo
riz
atio
n
0.0 0.2 0.4 0.6 0.8 1.0Y
SO 42-η
TOC5. Toxicity assessment for selected ozonation processes
The toxicity assessment was conducted in this study that used Microtox reagent as an indicator by measuring the luminescent of photobacteria in cells. The toxicity for the samples collected at different reaction time (0, 1, 2, 3, 5, 10, and 20 min) was evaluated and the results were shown in Fig. 4.10. The results showed that AO 6 did inhibit the incubated cultures initially, than, after 30 min of ozone and/or
O3/UV treatment, the effect of inhibition on the luminescent of incubated cultures
disappeared. The initial 15 min-EC50 value for O3 alone and the O3/UV was
23.48%; as reaction time = 10 min, the 15 min-EC50 value increased to 100% for the
sample treated by O3/UV, but 15 min-EC50 value for the sample of O3 alone was only
49%. The results indicated that initial AO 6 solution was toxic, after treated by O3
alone and the O3/UV, the toxic reduction of AO 6 was observed clearly. However, as
decolorization approaching to 100%, the 15 min-EC50 values reached to 100%, indicating that the ozonated by-products were not toxic. The results suggested that
O3 alone and the O3/UV could enhance the decolorization, mineralization and toxic
Figure 4.10 Variation of EC50 (%) under O3 = 18.7 mg/l-min (□) and O3 = 18.7
mg/l-min with UV intensity 30 W/m2 (○)
0
20
40
60
80
100
120
0
5
10
15
20
Ozonation time (min)
EC
50
(
%
4.2 The reaction kinetics prediction of AO 6 by ozone
1. The Development of Simplified Multi-step Reaction Kinetic Model
The assumptions of the Multi-step Reaction Kinetic Model (MSRK) model in the semi-continuous ozonation condition is adopted from Chen (2004), the similar assumption are used that are as follows.
1. The homogeneous conditions with complete mixing of liquid and gas flows are valid in the reactor.
2. Series ozonation mechanism is applicable. 3. Second-order chemical reactions are bimolecular. 4. Henry’s law applies.
5. Reactions in the gas phase are neglected.
For the governing equation of holdup gas ozone (CAGi) can be expressed by eq
4.5.
dCAGi /dt = QG (CAGi0 – CAGi)/VH –k a(C0LA AGi /HA – CALb)/εG (4.5)
For the governing equations of dissovled ozone (CALb), CBLb and intermediates
(CjLb) in the liquid phase, the chemical reaction terms should be expressed as eq
4.6–4.9. For CALb,
dCALb /dt = k a(C0LA AGi /HA – CALb)/εL – kdCALb – kBCALbCBLb –
Σkj CALbCjLb (4.6) For CBLb, dCBLb /dt = – kBCALbCBLb (4.7) For CjLb dCjLb/dt = kj-1CALbCj-1Lb – kjCALbCjLb (4.8)
The concentration of ozonated product (CPLb), which has relatively low reactivity
CPLb = CBLb0 – CBLb –ΣCjLb (4.9)
The governing equation of off-gas ozone (CAGe) in the free space (Andreozzi et
al., 1991) is:
dCAGe /dt = QG (CAGi – CAGe)/VF (4.10)
where VF = volume of free space. The initial conditions of eqs 1–6 are:
t = 0, CAGi = CAGe = CALb = CjLb = CPLb = 0, CBLb = CBLb0 (4.11)
The variation of TOC can be estimated by eq 4.12:
CTOC /CTOC0 = (CBLb + ΣαjCjLb + αpCPLb)/CBLb0 (4.12)
where
a = specific gas-liquid interfacial area based on the volume of liquid and gas
CAGi, CAGi0 = gas concentrations of ozone of holdup and inlet gases
CAGe = gas concentration of ozone in free volume
CALb = dissolved ozone concentrations in bulk liquid
CBLb = concentration of pollutant in bulk liquid
CBLb0 = initial concentration of pollutant in bulk liquid
CPLb = concentration of ozonated product
Ce, Ce = experimental data and the corresponding average values
CjLb = concentration of intermediate j in bulk liquid
Cp = predicted values
CTOC = concentration of total organic carbons
CTOC0 = initial concentration of total organic carbons
HA = dimensionless Henry’s law constant of ozone, CAGi /CALS, He/(RGT)
He = Henry’s law constant of ozone, pAi/CALS
Ij = intermediate j
j = intermediate j, Arabic numbers
kB = ozonation rate constant of pollutant B
kd = self-decomposition rate constant of ozone
kj = ozonation rate constant of intermediate j
0 L
k = physical liquid-phase mass transfer coefficient
0 LA
k = physical liquid-phase mass transfer coefficient of ozone, m/s
0 LO
k = physical liquid-phase mass transfer coefficient of oxygen, m/s
R2 = determination coefficient, 1 – [Σ(Ce – Cp)2/Σ(C
e – Ce)2]
QG = gas flow rate
VF = volume of free space
VH = volume of holdup gas
VL = volume of bulk liquid
αj, αp = ratios of TOC contributions per mole of intermediate j and of product P to
that per mole of pollutant B
εG, εL = relative gas and liquid holdups, εG + εL = 1
θTOC = dimensionless TOCs concentration, CTOC/CTOC0
θAGe = dimensionless gas concentration of ozone in free volume
θALb = dimensionless concentration of ozone in bulk liquid
θBLb = dimensionless concentration of pollutant in bulk liquid
The actual reactions between ozone and pollutants may be more complex than the proposed multi-step reactions with these simplifying assumptions as
forementioned. However, the present reactions kinetic model provides a simplified explanation of the experimental data for practical engineering application. Thus, the validity of the model must be justified by comparing the agreeability of model and experimental results as examined in the latter sections.
2. The determination of parameters used
The fraction of εG is calculated by the volume-expanding method employing εG =
VH/(VH + VL) that is 0.023 for AO 6 solution and 0.017 for aqueous solutions,
respectively. The average dbs is about 0.729 mm by measuring the bubble images
dimensionless HA is 4.18 MM-1 (Chen et al., 2004). The volumetric mass transfer
coefficient of oxygen ( 0
LO
k a) in the aqueous solution is measured as 0.0268 s-1 by
oxygen aeration. The diffusion coefficients of oxygen (DO) and ozone (DA) in the
AO 6 solution are estimated according Wilke and Chang (1955). The values of 0
LO
k
and 0
LA
k can be estimated by using surface renew theory ( 0 0.5
Lå D
k ) that are
1.28×10⁻⁴ and 1.15×10⁻⁴ m s-1. The kd can be estimated as 1.45×10⁻⁴ s-1 by using the
formula proposed by Gurol and Singer (1982).
The variations of CBLb, CTOC, CALb and CAGe are simultaneously monitored for
the purpose of MSRK model verification. The normalized concentrations in the
dimensionless forms of CBLb, CTOC, CALb and CAGe are: θBLb (= CBLb/CBLb0), θALb (=
CALb/(CAGi0/HA)), θAGe (= CAGe/CAGi0), and θTOC (= CTOC/CTOC0).
3. Simulation of AO 6’s Ozonation
Appropriated kinetic parameters can be obtained by achieving the best fitting for the experimental data in the simulation with MSRK models with various steps of reactions, and the corresponding values of the parameters and determination
coefficient (R2) are summarized in Table 1. As the number of reaction step
ascending, the R2 values get improving, suggesting that adopting higher step of
reaction kinetic model may well predict the variation of CBLb, CTOC, CALb and CAGe.
The variation of dimensionless parameters, θALb, θAGe, θBLb, and θTOC, are predicted
and verified with experimental data. It is clearly that higher reaction steps of the
kinetic model would enhance the R2 value of data fitting, the results indicating that
the five-step reaction can well express the reaction kinetics simulation. Furthermore, five-step reaction may indicate four intermediates that are produced during ozonation.
As azo bond (N=N) attacking by ozone, the AO 6 molecules and color disappear rapidly that are measured in all experiments. It indicates that the reaction rate
constant of AO 6 with ozone (k1 = 120000 M-1s-1) is considerably high due to high
aromatic rings. The TOC contribution of the intermediate Ij is reflected by the factor
αj with smaller value of αj indicating higher mineralization degree or lower value of
CTOC/CTOC0 as revealed by eq 4.12. Based on the predict α1 (= 1.0) value, none of
the organic carbon of AO 6 is oxidized to CO2 in the initial reaction, indicating that
Table 4.1. Ozonation Kinetics of AO 6 Adopting Schemes with Various Reaction Steps
R2 value for predicted results
Reaction step Kinetic parameter
θBLb θTOC θALb θAGe
2 k1 = 120000 M-1s-1, k2 = 1.5 M-1s-1 0.877 0.918 < 0.1 0.975 3 k1 = 120000 M-1s-1, k2 = 24000 M-1s-1, k3 = 1.55 M-1s-1 0.90 0.939 < 0.1 0.980 4 k1 = 120000 M -1s-1, k 2 = 24000 M-1s-1, k3 = 3500 M-1s-1, k4 = 1.55 M-1s-1 0.973 0.961 0.680 0.983 5 k1 = 120000 M -1s-1, k 2 = 24000 M-1s-1, k3 = 3500 M-1s-1, k4 = 10 M-1s-1, k5 = 1.55 M-1s-1 0.979 0.989 0.756 0.984
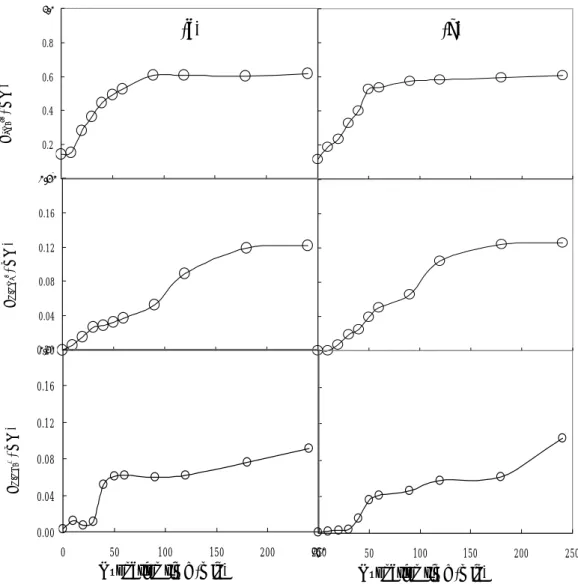
4. The variations of θBLb, θTOC, θALb, and θAGe
It is known that the removal amount of target compound is concerned with fed
ozone concentration (CAGi0). The higher CAGi0 provided, the less θBLb will be
achieved, as shown in Fig. 4.11. The times required for the complete removal of AO
6 with CAGi0 = 6 mg/L/min (30min) is about 6, 3, and 1.2 times of those with CAGi0 =
16 (5 min), 12 (10 min), and 9 mg/L/min (25 min), respectively. The
pseudo-first-order reaction rate expression can be proposed as θBLb = exp-kB,App with
kB,App = 0.0934 CAGi0 min-1 (where CAGi0 in mg/L) from the experimental data.
Again, the variation of TOC reduction may be observed by changing the CAGi0
value, as shown in Fig. 4.12, which illustrates the variation of θTOC under different
experimental conditions. It is clearly that the CAGi0 value can accelerate the
mineralization rate correspondingly, the same as observed in θBLb. As seen in Fig.
4.12, it is observed that the variation of θTOC can be divided into two segments, as
θTOC about 0.8 as the turning point. As in the case of CAGi0 = 16 mg/L/min, the value
of ∆θTOC /∆t is 0.039 for the reaction from 0 to 20 min and 0.0059 for the time from
20 to 60 min, indicating that the slow progress of the mineralization is happened after reaction time = 20 min.
As shown in Fig 4.13, the variations of θALb can be divided into three stages. In
the case of CAGi0 = 16 mg/L/min, in the first stage (with θTOC > 0.9), the θALb almost
undetectable and the variation of θBLb is very fast (Fig. 4.11), indicating that the ozone
transferred from the gas phase is consumed immediately in the solution by breaking
the azo bonds mostly. As decolorization completed, the θALb starts to increase
rapidly with ozonation time in the transient regime (with 0.77 ≤ θTOC < 0.97),
suggesting that the amount of dissolved ozone accumulation is larger than that of the consumption. The result may due to the generation of refractory intermediates
which reactivity is far lower than the target compound. In the final stage, the θALb
approaches to the constant value of about 0.5 and is independent of CAGi0.
The ozone concentration in the off-gas is monitored in this study and the results
are shown in Fig. 4.14. The θAGe increases consistently from the beginning to reach
the steady state; it is corresponding to the θBLb decreasing. The results suggest that
the amount of θALb is consumed in the ways of self-decomposition and chemical
reaction in early stage of ozonation, the θAGe will increase as reaction time increasing
the more unused ozone appears in off-gas, the amount is higher than that for the need of dissolves into liquid phase, self-decomposition, and chemical reaction, indicating that the ratio of ozone transferred from gas to liquid phases to that in feed gas decreases with ozonation time.
Figure 4.11. Time variations of θBLb for AO 6 ozonation in a semibatch system. θBLb
= CBLb/CBLb0. Symbols: experiments; lines: prediction based on five-step reaction
kinetics. □ and —— : CAGi0 = 6 mg/L/min. ◇ and : CAGi0 = 9 mg/L/min.
△ and : CAGi0 = 12 mg/L/min. ○ and : CAGi0 = 16 mg/L/min.
0
0.2
0.4
0.6
0.8
1
1.2
0
10
20
30
40
50
60
70
time (min)
θ
BLbFigure 4.12 Time variations of θTOC for AO 6 ozonation in semibatch system. θTOC =
CTOC/CTOC0. Symbols: experiments; lines: prediction based on five-step reaction
kinetics. Symbols: experiments; lines: prediction based on five-step reaction
kinetics. □ and —— : CAGi0 = 6 mg/L/min. ◇ and : CAGi0 = 9 mg/L/min.
△ and : CAGi0 = 12 mg/L/min. ○ and : CAGi0 = 16 mg/L/min.
0.5
0.6
0.7
0.8
0.9
1
0
10
20
30
40
50
60
70
Time (min)
θ
TO CFigure 4.13 Time variations of θALb for AO 6 ozonation in semibatch system. θALb =
CALb/(CAGi0/HA). Symbols: experiments; lines: prediction based on five-step
reaction kinetics. Symbols: experiments; lines: prediction based on five-step
reaction kinetics. □ and —— : CAGi0 = 6 mg/L/min. ◇ and : CAGi0 = 9
mg/L/min. △ and : CAGi0 = 12 mg/L/min. ○ and : CAGi0 = 16
mg/L/min.
0
0.1
0.2
0.3
0.4
0.5
0.6
0
10
20
30
40
50
60
70
Time (min)
θ
ALbFigure 4.14 Time variations of θAGe for AO 6 ozonation in semibatch system. θAGe =
CAGe/CAGi0. Symbols: experiments; lines: prediction based on five-step reaction
kinetics. Symbols: experiments; lines: prediction based on five-step reaction
kinetics. □ and —— : CAGi0 = 6 mg/L/min. ◇ and : CAGi0 = 9 mg/L/min.
△ and : CAGi0 = 12 mg/L/min. ○ and : CAGi0 = 16 mg/L/min.
0.5
0.6
0.7
0.8
0.9
1
0
10
20
30
40
50
60
70
Time (min)
θ
AGe4.3 Bubble column system 4.3.1 Tracer test
In order to testify the design feasibility of bubble column, following tracer tests are conducted under different flow conditions, i.e. liquid flow = 10, 12, 14 L/min and gas flow = 0.9, 2.1, 2.7 L/min respectively, that was the large flow rate patterns. For the small flow rate patterns, the liquid flow = 2, 2.4, 2.7, 3.2, 4, and 6 L/min and gas flow = 0.9, 2.1, 2.7, and 3.2 L/min respectively. The tracer test results for large and small flow rate patterns were shown as Table 4.2 and 4.3. The monitoring results of tracer flowed out from bubble column were shown as Fig. 4.10.
Based on the report written by Levenspiel (1972), the residence time distribution
(RTD) may relate to the mean residence time (MRT), denoted as
t
, andt
can beexpressed as follows:
∑
∑
∫
∫
∆ ∆ = = ∝ ∝ i i i i i 0 0 t C t C t Cdt tCdt t , (4.13)and the variance ( σ2)can illustrate as following form
![Figure 3.4 The UV – visible wavelength scanning (200 nm to 900nm) for different AO 6 concentration ([AO 6] = 0 to 200 mg/L)](https://thumb-ap.123doks.com/thumbv2/9libinfo/8871060.247927/26.892.132.759.109.517/figure-uv-visible-wavelength-scanning-different-ao-concentration.webp)