ABSTRACT. The role of corporate center in influencing the economic performance of business units has been a central research topic in the industrial organization and strategic management literature. A common finding is the limited corporate and business group effects. Recently, an emerging line of studies argues that the market inefficiencies and institutional voids in emerging markets can be overcome more efficiently by large diversified business groups than by non-group small firms. Some empirical evidence also shows that non-group small firms are significantly less profitable than group-affiliated firms. This paper raises this issue by empiri-cally investigating the influence of group affiliation on the return on assets and Tobin’s q of 340 group-affiliated firms versus 423 non-group firms in Taiwan, during the period of 1997–1999. The statistical results show that group affiliation can not always create value for member firms. The size of the business group matters. When affiliated with the largest business groups, member firms indeed show improved stock market performance, but when firms are affiliated with small-and medium-sized groups, their accounting performance suffers. Findings of this paper suggest a threshold effect and a U-shape relationship between group affiliation and prof-itability in emerging economies.
1. Introduction
The role of corporate center in influencing the economic performance of business units has been a central research topic in the industrial organiza-tion and strategic management literature. It has been an accepted knowledge that firm size or diversification strategy alone cannot promise success; internal organizations matter (Chandler, 1962). Porter’s (1987) study on 33 large
presti-gious U.S. companies over the 1950–1986 period shows that the diversification strategies of most companies have dissipated instead of created shareholder value. Downsizing and refocusing thus become the suggested strategy (Markides, 1995). Scholars also found that the major source of firm profitability is the business unit effect; the industry effect is minor; while the corporate or business group effect is negligible (McGahan and Porter, 1997; Rumelt, 1991; Schmalensee, 1985). All these studies propose that large diversified business groups do not necessarily create more value than non-group focused firms.
Recently, this conventional thought has been under attack by an emerging line of research. Some scholars argue that large business groups and conglomerates can be a source of value in emerging markets because they effectively fill in the institutional voids resulting from market inef-ficiencies (Chang and Choi, 1988; Chang and Hong, 2002; Ghemawat and Khanna, 1998; Khanna and Palepu, 1997, 1999, 2000a, 2000b). Their empirical studies show that firms affiliated with the most diversified business groups outper-form non-group small firms in emerging markets. In other words, group affiliation, and firm size serve as important sources of competitiveness in emerging markets.
However, it is still unclear whether it is a generic phenomenon in emerging markets that group affiliation can create value for individual lines of businesses. Specifically, whether the benefits of group affiliation in emerging markets are sufficient to setoff the associated informational and agency costs remains an open question. There-fore, the present research aims to investigate empirically this debatable issue, by using Tai-wanese firms as the research sample. TaiTai-wanese
Are Group-Affiliated Firms
Really More Profitable
than Nonaffiliated?
Wenyi ChuSmall Business Economics 22: 391–405, 2004.
2004 Kluwer Academic Publishers. Printed in the Netherlands. Final version accepted on 28 May 2002
College of Management National Taiwan University 50, Lane 144, Keelung Road, Sec. 4 Taipei, Taiwan 106
firms offer an ideal setting for the purpose of the present study because, as an emerging country, Taiwan represents an ideal case of the co-existence of small non-group firms and large business groups, both contributing significantly to the country’s economic activities (Chou, 1995; Wade, 1990). Almost 98 percent of business establish-ments in Taiwan are small- and medium-sized enterprises, contributing 29 percent to the country’s gross production (Taiwan Medium and Small Business Administration, 2001); while the top one hundred business groups contributing about 45 percent to the country’s gross production (Business Groups in Taiwan, 2000). Moreover, similar to the case of Korea (Chang and Hong, 2000, 2002) and India (Khanna and Palepu, 2000b) but unlike in Japan (Goto, 1982), group-affiliated firms in Taiwan are typically members of only one business group, so that it is possible to identify the group affiliation of each sample firm without ambiguity.
Univariate and multivariate regression analysis were employed, with reference to a sample of 763 companies listed in Taiwan Stock Exchange (TSE) Market and Over-The-Counter (OTC) Securities Exchange Market in the period 1997–1999. Results of the univariate analysis shows that non-group firms are the best performers, firms affili-ated with the largest groups show medium performance, while those firms affiliated with small- and medium-sized business groups are the worst performers. Multiple regression analysis further suggests a U-shape relationship between group affiliation and performance. That is, the costs and benefits of group affiliation are subject to the size of business groups. Affiliation with the largest business groups is associated with improved stock market performance for member firms, but affiliation with small- and medium-sized groups dispatches member firms’ accounting prof-itability.
The purpose of this study is to provide empir-ical evidence to clarify the influence of group affiliation and size on firms’ financial and stock market performance in emerging economies. The approach adopted in this study is thus a pragmatic one. The central research question is “how much does group affiliation matter?” In other words, the effect of business grouping and size can be evaluated through empirical work, but it does not
depend on whether a firm is categorized as an SME or not an SME.
The structure of the paper is as follows. Section 2 reviews the theoretical backgrounds and empir-ical evidence of the roles of group affiliation in determining the economic performance of firms in developed and emerging markets. In Section 3 the research methods are discussed; the research sample, analysis methods, and the measures of dependent and independent variables are intro-duced. The findings are presented in Section 4. Summaries and discussions in Section 5 conclude this paper.
2. Background
2.1. Sources of profitability
The source of persistently unequal performance among firms has long been a critical research topic in the academic literature (Hansen and Wernerfelt, 1989; McGahan and Porter, 1997; Rumelt, 1991; Schmalensee, 1985; Wernerfelt, 1984). Three major sources of profitability differences have been addressed: industry, corporate, and business unit effects. The classical industrial organization tradition makes the industry the unit of analysis and seeks a link between industry concentration, entry barriers, and profitability (e.g., Bain, 1968; Scherer, 1980). A second tradition regards the existence of persistent efficiency differences between sellers as the main reason for long-lived differences in returns, seeking explanation in terms of firm size and market share (e.g., Buzzel, Gale and Sultan, 1976; Demsetz, 1973). While the man-agerial and business strategy view regards profit differences as a result of different approaches to competition taken by different corporation or business groups (Perters and Waterman, 1982) and/or different business units (Rumelt, 1984; Wernerfelt, 1984).
A rich body of empirical studies has been devoted to this research topic. For example, by using regression and variance composition esti-mation, Schmalensee (1985) analyzed the 1975 data of the U.S. Federal Trade Commission on business units accounting rate of profitability for manufacturing industries. He concluded that firm/corporate effects are statistically non-existent, market share effects are significant but negligible,
while industry effects are the most significant factor. Rumelt (1991) recaptured and modified Schmalensee’s work by using four-year data and isolating the overall and industry-specific business cycle effects, and found quite opposite results. Rumelt reported that corporate effects remain negligible, stable industry effects account for only 8 percent of the variances in returns, while business unit effects are very significant and out-weight industry and corporate membership effects. By using similar statistical method and a new database, Compustat Business Segment Report, McGahan and Porter (1997) confirmed that business unit effects are the most important source of profitability differences, industry effects come next, and firm/corporate effects are very minor.
A common finding of these studies is the limited role of the corporate center in improving business units’ performance. As Rumelt (1991) concluded, “if one business-unit within a corpo-ration is very profitable, there is little reason to expect that any of the corporation’s other business-units will be performing at other than the norms set by industry, year, and industry-year effects” (1991, p. 182). Therefore, a business unit will not automatically show improved performance after being affiliated with a diversified business group. In other words, there is no evidence of synergy. Although Rumelt viewed it as a puzzle to find only vanishing small corporate effects in the data, studies on downsizing and refocusing often report improved accounting performance of re-focused firms (Hoskisson and Turk, 1990; Markides, 1995), further suggesting the existence of man-agerial and economic limits of corporate centers in large business groups (Berger and Ofek, 1995; Prahalad and Bettis, 1986).
2.2. New evidence from emerging markets Recently, an emerging line of studies has provided opposite research findings that challenge the conventional thoughts on the corporate effects (Chang and Choi, 1988; Chang and Hong, 2000, 2002; Ghemawat and Khanna, 1998; Khanna and Palepu, 1997, 1999, 2000a, b). Overall, these studies argue that although core competencies and focus are the mantras of corporate strategies in Western economies, emerging countries show different institutional contexts in which large
busi-ness groups can add significant value and become more profitable than non-group focused firms.
Leff (1978) first pointed out that the business group is a common phenomenon in developing countries because it serves as an intrafirm organi-zation that exists due to market imperfections in the domestic markets.1Khanna and Palepu (1997, 1999, 2000a, b) further argue that unlike advanced economies in which efficient institutions are taken for granted, emerging markets suffer from weak institutions so that basic business operations can not be supported. According to Khanna and Palepu, there exist three main sources of market failure in emerging markets, but conglomerates and business groups can overcome these imper-fections by imitating institutions. First, given information problems pertained to product markets, capital markets and factor markets, com-panies in developing countries spend much higher costs in building credible brands, in raising capital, and in searching and developing trustworthy and experienced managers. As to the information problems in the product markets, the umbrella branding effect helps group-affiliated firms gain brand loyalty in new business areas more easily than non-group firms. With regard to the ineffi-ciency in the capital markets, large groups can act as an internal capital market to help member firms obtain financial resources. Also the internal man-agement-development programs and the rotation policies in large groups promote experienced managers.
The second source of market failure in emerging markets pointed out by Khanna and Palepu is the regulation problems resulting from governments’ heavily involvement in an intricate array of business decisions. Regulations often place political goals over economic efficiency, further distorting the functioning of markets. Facing this problem, large groups own more resources to lobby against inappropriate regula-tions than small firms do. Finally, inefficient judicial systems in emerging markets often make the enforcement of contracts particularly difficult and add transaction costs for the arm’s-length contractual arrangements. Through vertical inte-gration and sharing credibility/reputation estab-lished from honest dealings of the whole group in the past with all group members, inefficiency in the judicial systems can be covered.
Empirical evidences also provide supports. From the chaebols of Korea (Chang and Choi, 1988; Chang and Hong, 2000, 2002) to the business houses of India (Khanna and Palepu, 2000b) to the business groups of Chile (Khanna and Palepu, 2000a), scholars report that affiliates of diversified business groups significantly out-perform small and non-affiliated focus firms. These studies strongly suggest that non-group small firms in emerging markets possess limited resources to overcome market inefficiencies so that they are likely to suffer from unsatisfactory economic performance.
2.3. Are non-group focused firms really less
2.3. profitable?
The benefits of group affiliation and diversifica-tion in emerging markets, however, may not be sufficient to setoff the informational and agency costs. As Khanna and Palepu (2000b) pointed out, the combination of family ownership from control may place conflicts of interest between controlling family shareholders and minority shareholders and lead to agency problems. Coordination costs and intrinsic diseconomies of scale (Keren and Levhari, 1983), X-inefficiencies due to misplace of dominant logics (Prahalad and Bettis, 1986), and sub-optimal decisions (Hoskisson and Turk, 1990) may take place due to the information pro-cessing limits of organizations and top manage-ment. On the other hand, non-group small firms have become increasingly important in the economic activities of both developed and devel-oping countries, particularly in the fast-changing and increasingly important markets (Acs and Preston, 1997; Aharoni, 1994; Mulhern, 1995). Even given constraints such as limited size, resources and market power, non-group small firms’ characteristics of being entrepreneurial, flexible, innovative and action-oriented have been reported as sources of competitive advantages (Aharoni, 1994; Carrier, 1994; Cooke and Wills, 1999; Hansen, 1992; Mulhern, 1995).
Given the significance of small focused firms in global economies, the three institutional voids and the institutional roles of business groups in emerging markets may need re-examination. Non-group small firms may deal effectively with
insti-tutional failures in emerging markets, by means different from large business groups.
As to the inefficiencies in product markets, for example, many non-group focused firms in Taiwan are engaged in exporting activities through original-equipment-manufacturing (OEM) in com-ponents and intermediate goods (Hu and Schive, 1998). In such activities the abilities of flexible and efficient production predominate over the effect of global brand loyalty. The advantages of conglomerates in building and sharing brand names proposed by Khanna and Palepu thus become less significant.
Moreover, the effective internal financing among individuals with personal and family ties stands for an alternative method to overcome the failure in capital markets due to the underdevel-opment of credit systems and financial institutions such as venture capital companies and risk man-agement companies (Orru et al., 1991). That is, entrepreneurs of small firms can raise capital through informal personal and family ties, rather than through the formal equity ties of business affiliation. Recent studies on Chinese family business networks provide strong evidence for this argument (Hamilton, 1996; Redding, 1996; Weidenbaum and Hughes, 1996).
Scholars also point out that in developing economies there usually exist informal financial practices and institutions that serve the financial needs of SMEs (Shea, 1994; Winn, 1994; Wade, 1990). For example, Shea reported that “financial dualism” is an important feature of the financial system in Taiwan. In addition to the formal (orga-nized, regulated) financial system, there exist an informal (unorganized, unregulated) system that engages in lending and borrowing activities without being under the direct regulation or supervision of financial authorities (Shea, 1994, p. 223). When small and medium-sized businesses are not able to rely completely on the formal system, they turn to rely heavily on the informal system, particularly the relational structure and networks of personal connections among relatives and families (Winn, 1994). The 1990 statistical data show that in Taiwan 24 percent of domestic borrowing by private (small) enterprises is under the informal system, while only 7 percent of domestic borrowing by public (large) enterprises is under the informal system (Shea, 1994).
Because the informal system can be employed by SMEs to overcome the financial market ineffi-ciency in emerging markets, it is not necessary that they underperform those large group-affiliated firms.
Furthermore, although being non-group-affili-ated, many small firms are engaged in nondepen-dent subcontracting relations of industrial networks (Perrow, 1992). Small firm networks (SFNs) actually represent another alternative to integrated organizations and business groups in response to high transactional hazards (Human and Pravon, 1995). Perrow (1992) observed a world-wide trend of the breaking up of integrated con-glomerates and multidivisional firms into loose alliances of small firm networks in modern economies. He attributed the economic efficiency of small firms to “some characteristics – all dis-tinctive of SFNs – that are more likely to generate trusting than self-interesting-maximizing behav-iors in a group of firms” (1992, p. 461). Perrow summarized the following characteristics of SFNs that generates trust relations among member firms: sharing market and technology information; suf-ficient similarity in process and techniques among firms; experience of getting helped by another firm; long-term relationships; little difference among firms by size, market power, or strategic position; rotation of leadership; and an awareness of bounded community of fate generated by trade or professional associations, municipal service groups, unions, and the like.
Given these past studies, it seems open that how much does group affiliation create value for member firms in emerging markets. In the fol-lowing sections, the present study provides empir-ical evidence in Taiwan to help understand this debatable issue.
3. Research method
3.1. Sample and data
Taiwanese firms were used as the research sample. The data are obtained from a publicly available database maintained by TEJ, Taiwan Economic Journal. TEJ is a leading credit analysis research agent in Taiwan, probably equivalent to Standard and Poor’s and Moody’s in the United States. TEJ is the most comprehensive database in Taiwan,
and is subscribed by many international research agents such as Datastream, Dialog, Reuters, and Capital International. TEJ provides detailed company profiles and financial information of 485 non-financial-sector companies publicly listed in the Taiwan Stock Exchange Market, and of 278 non-financial-sector companies listed in the Taiwan Over-The-Counter Securities Exchange Market. Therefore, there are a total of 763 firms in the research sample. The author decided not to include the financial service firms in the sample because their accounting schemes are not com-patible with those of firms in other industries. For most TSE companies nine-year (1991–99) data are available in the database, while only three-year (1997–99) data are covered for the OTC com-panies. Therefore, I analyze data from 1997 since it is the year for which I have the most coverage in the database.
3.2. Business groups affiliation
First the author needs to identify whether a sample firm is an affiliated company of a business group or not. Consistent with prior studies (Chang and Choi, 1988; Chang and Hong, 2000, 2002; Khanna and Palepu, 2000a, b), this study defines the “business group” as a gathering of formally inde-pendent firms under single common administra-tive and financial control. While a non-affiliated firm is defined as a firm that is not under the common administrative and financial control of any business groups. Similar to the business groups in Korea and India, member firms of business groups in Taiwan are tied by common ownership. The principal owners (who is usually the founding entrepreneur, the chairman, or his/her family members and relatives) holds just enough shares in the core/major companies to control them, and to control and rest of the affiliated companies by way of cross-shareholdings. Through this compli-cated ownership structure, the principal owner can control the entire business group with only minor shareholdings. The principal owner of the Formosa Plastics Group, for instance, owns only about 5 percent of the total shares of the group. Also, dif-ferent from Japanese Keiretsu in which a company can be identified as the member of several Keiretsu in the same time, firms in Taiwan are typically members of only one business group.
The business group membership was identified by using the data provided by TEJ. Group mem-berships were further consolidated through a double check with data provided by another database, Business Groups in Taiwan published by the China Credit Information Service Company. After a close check of the membership of the top 30 business groups, the group memberships of the two databases were identical. Out of the 485 TSE firms, 269 firms are associated with 174 business groups, with the remaining 216 firms non-group-affiliated. For the 278 OTC firms, 71 firms are associated with 55 groups, while the remaining 207 firm are non-group-affiliated. In total, 340 firms out of the 763 firms (44.6%) are associated with 198 diversified business groups, and the rest (423 firms, 55.4%) are focused firms unaffiliated with any business groups.
3.3. Firm size
Before the investigation of the relative size of group-affiliated and non-group firms, the term “SMEs” and its definition need some discussion.2 As widely stated by scholars (e.g., Brooksbank, 1991; Daily and Dollinger, 1993; Osteryoung and Newman, 1993), there does not exist a generally accepted definition of SMEs. A commonly employed approach is the quantitative definition, which uses measures such as number of employees, sales turnover and total sales. Another method is the qualitative approach, which empha-sizes the existence of non-publicly listed stock and owners’ personal guarantees (Osteryoung and Newman, 1993), or the early development stage and limited product/diversification strategy of a firm (Brooksbank, 1991). However, the definitions and criteria of dividing lines remain varying. For example, in terms of the number of employees, Brooksbank (1991) suggest that firms with fewer than 100 employees as small firms, firms with 100–499 employees as medium firms, while firms with more than 500 employees as large ones. Daily and Dollinger (1993) defined SMEs as firms that have fewer than 500 full-time employees. In Taiwan, manufacturing firms with fewer than 200 employees are considered as SMEs, but this definition can be extended to some larger firms that have a number of employees grows beyond 200 within 2–3 years (While Book of Small and
Medium-Sized Enterprises, 2000). In Korea, small enterprises are defined as those with up to 20 employees, medium-sized enterprises are those with 21–300 employees, but for some labor-inten-sive subsectors the definition of medium-sized enterprises are expanded to 1000 employees (Regnier, 1993).
Given all these, as UNCTAD (1998) stated, the purpose and research questions of a study are more important than whether it has adopted a particular definition of SMEs or not. The effect of size and grouping can be evaluated through empirical work, but it does not depend on whether a firm is categorized as an SME or not an SME (UNCTAD, 1998, p. 6). The purpose of this study is to provide empirical evidence to investigate the influence of group affiliation on firms’ financial and stock market performance in emerging economies, not to compare the economic performance between SMEs and non-SMEs. Therefore, the approach adopted in this study is a pragmatic one. The question is “how much does group affiliation and size matter?”, and not so much “is it an SME or not according to a particular definition?”.
Therefore, this study employed two simplified rather than comprehensive measures of firm size: number of employees and firm assets. As to the number of employees, consistent with UNCTAD (1998), the author used 100 and 500 employees as the dividing lines to sort group-affiliated and non-group firms into small, medium and large ones. Firm size, in terms of assets, was also con-sidered in the construction of the regression analysis models. As to the qualitative approach, a firm’s product diversification strategy was measured and controlled in the regression models. 3.4. Measures
For the performance measures, the author used both the accounting and stock market indexes. The first measure is the average annual rate of profit after tax but before interest on total assets (ROA) for the years 1997–1999. According to Chang and Choi (1988), this index is a more accurate measure for operating efficiency because in most devel-oping countries the capital markets are imperfect and the debt-equity ratio is usually high. Although the three-year data may not be long enough to smooth out all possible economic and industrial
fluctuations, they are the only complete data available for both TSE and OTC companies. Also, this period is well before Taiwan’s economic downtrend that started from early 2000; the extreme macro economic situations are thus avoided. The second index is Tobin’s q, a measure that has been often employed (e.g., Lindenberg and Ross, 1981; Werrnerfelt and Montgomery, 1988) to examine the sources of unequal prof-itability. A proxy for Tobin’s q was constructed, which was defined as (market value of equity + book value of preferred stock + book value of debt) / (book value of assets), where the market value of equity is calculated using closing stock prices on the last trading day of the year 1999. Tobin’s q was constructed only for 1999 because otherwise 311 cases would be missing for 1997 and 227 cases would be missing for 1998, due to the late entry of many companies into the TSE and OTC markets.
Measures for the explanatory variables are dis-cussed as follows.
Group affiliation (GPI, GPII, GPIII). Three dummy independent variables were constructed. GPI simply specified whether a company is group-affiliated (= 1) or non-group-group-affiliated (= 0). According to the Business Group in Taiwan pub-lished by the China Credit Information Service Company (1999), the largest groups are very diversified, across unrelated businesses in a product market sense. The top 30 largest business groups have an average number of 17.2 affiliated companies, and 13,046 full-time employees; while the top 31–100 business groups are much smaller in size, with an average of 8.4 affiliated com-panies, and 2,241 full-time employees. Therefore, the separation of the top-30-group affiliation from the non-top-30-group affiliation is important because they may possess different resources and capabilities of imitating institutions. GPII was thus introduced to specify whether a company belongs to the top 30 largest business group (= 1) or not (= 0), while GPIII indicates whether a company belongs to a non-top-30 business group (= 1) or not (= 0).
Diversification index (SR). The development stage and diversification strategy of a firm has been proposed as a qualitative criterion for identifying
small- and medium-sized enterprises (Brooksbank, 1991). Following the classification method proposed by Rumelt (1974), diversification is measured by the specialized ratio. The specialized ratio (SR) is defined as the proportion of a firm’s revenue that is attributable to its largest 4-digit CSIC (Chinese Standard Industry Classification) group of businesses, in 1999. The larger the value of the specialization ratio, the more focused and less diversified is a firm. Unlike in U.S. data, there is no ready-made industry classification of firms in the TEJ data. Therefore, the author first needed to identify the proportion of revenue of the largest industry for each sample firm,3and then to decide its associated 4-digit CSIC code.
Market share (MS). Market share has been reported to influence profits due to monopoly power (Buzzell et al., 1976). This variable is measured as the ratio of a firm’s sales on its largest 4-digic CSIC industry to the total sales of this 4-digic CSIC industry in Taiwan, as of 1997–99. As have been discussed in the earlier section, the 4-digit CSIC industry was obtained through a hand-made classification by the author.
Firm size (SIZE). In the industrial organization literature, firm size reflects the existence of economies and diseconomies of scale and may form barriers to entry (Bain, 1968). In order to avoid the problems of extreme values, firm size is controlled by using the natural logarithms of the 1997–99 three-year average of firm assets. R&D intensity (RD). Product differentiation and flexible manufacturing through innovation are possible sources of above-average profits (Porter, 1980). This variable is measured by using the three-year average ratio of research and develop-ment spending to total sales between 1997–1999. Industry (INDUS). Possible profitability differ-ences resulting from different industrial features are also controlled. Based on the industry classi-fication of the Taiwan Stock Exchange Market, seventeen dummy variables were utilized to sort all firms into eighteen industries. These industries include: cements, food and beverage, plastics, textile, electronic machinery, wire and cable, chemicals, glass and pottery, paper, steel, rubbers,
motor vehicles, information and electronics, con-struction, transportation, hotels, wholesale and retail trading, and other miscellaneous industries. Descriptive statistics as well as the correlation coefficients among all variables are summarized in Table I.
3.5. Analytical methods
Univariate comparisons and multivariate regres-sion analysis were both employed. For the uni-variate analysis, independent sample t-test, one-way ANOVA and Scheffee’s tests were employed to specify whether there exists signifi-cant difference among top-30-group firms, non-top-30-group (top 31–100) firms, and non-group firms. Scheffe’s test is a pairwise comparison of differences in group means. For instance, for the comparison of three group means, Scheffe’s test will produce 3 pairwise comparisons: Group 1 versus Group 2, Group 1 versus Group 3, and Group 2 versus Group 3. A multivariate regres-sion model was then constructed to examine the overall influences of group affiliation, firm size and diversification on the accounting performance and stock market performance of Taiwanese firms.
4. Results
4.1. Univariate analysis
This section reports the results of descriptive statistics and univariate analysis. It is found that
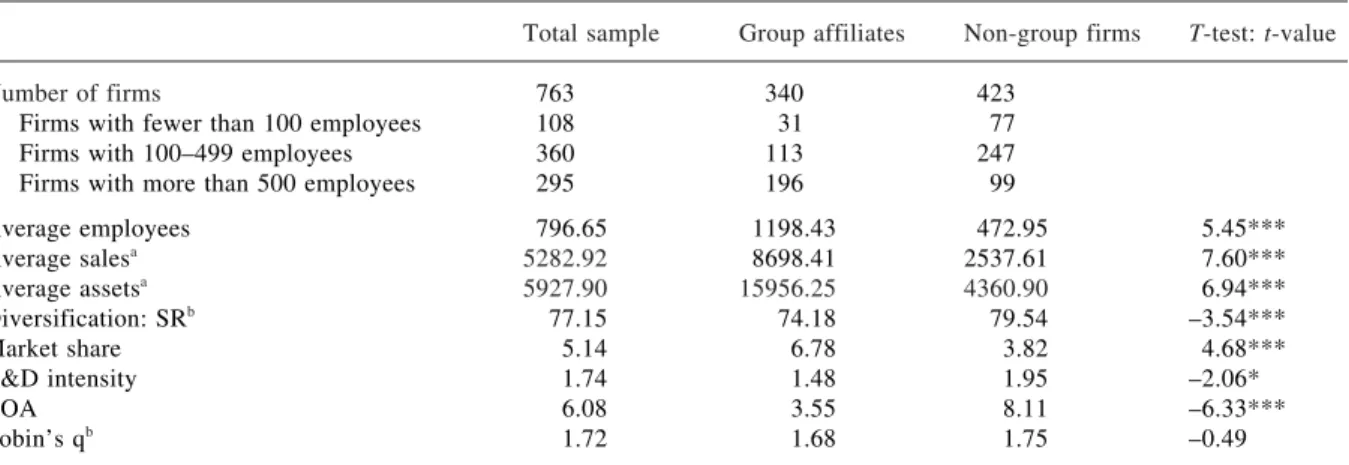
group-affiliated firms are significantly different from non-group firms with respect to size, market power, diversification, R&D strategy, and associ-ated economic performance (see Table II).
On average, non-group firms have 423 full-time employees, while group-affiliated firms are much larger, with an average of 1,198 employees. Among the 423 non-group firms, 77 firms (18.2%) have fewer than 100 employees and thus can be identified as small-sized firms, while 247 firms (58.4%) have a number of employees between 100 and 500 and can be identified as medium-sized firms, with the remaining 99 firms (23.4%) as large-sized firms. Among the 340 group-affiliated firms, only 31 firms (9.1%) have fewer than 100 employees and are identified as small-sized firms, 113 firms (33.2%) are medium-sized, while the remaining 196 group-firms (57.6%) are large-scale firms. These statistics strongly suggest that business groups in Taiwan are often composed of large firms (57.6%), while most non-group firms are SMEs (76.6%).
Their sizes in terms of sales and assets also differ significantly: a group affiliate’s sales and assets are about three to four times of those of non-group firms. This is consistent again with the findings of prior studies in other emerging markets, that is: business groups are often composed of large firms, while non-group firms are usually small- and medium-sized firms. These statistics also echo with the observation of existing studies (e.g., Chou, 1995; Wade, 1990), which argue that Taiwan’s industrial economy is
dual-TABLE I
Descriptive statistics and correlation coefficients of Variables* (n = 763)
Mean s.d. 1 2 3 4 5 6 7 8 1. ROA 06.08 10.14 0– 2. Tobin’s q 01.72 01.56 00.51 0– 3. GPI 00.45 00.50 –0.22 –0.02 0– 4. GPII 00.11 00.32 –0.02 00.06 00.40 0– 5. GPIII 00.33 00.47 –0.22 –0.06 00.79 –0.25 0– 6. SR 77.15 20.98 00.10 00.04 –0.13 –0.08 –0.08 0– 7. MS 05.14 08.82 –0.03 –0.01 00.17 00.16 00.07 –0.03 0– 8. SIZE 14.73 01.21 00.01 00.08 00.40 00.34 00.20 –0.12 00.36 – 9. RD 01.74 03.12 00.21 00.50 –0.08 00.01 –0.09 00.07 –0.07 –0.07
* For presentation parsimony, the 17 industrial dummy variables are not included in this table. Their correlation coefficients with other independent variables are all below 0.43 (the highest correlation, 0.43 occurs between the information and electronics industry and R&D intensity).
istic, with a large sector of SMEs and another large sector of large-scale group firms, both playing significant roles in Taiwan’s economic develop-ment. Many small firms have sprung up in higher-technology sectors, such as computers, integrated circuit design, and machine tools, and they become medium-sized firms and public-listed in Taiwan’s stock exchange market.
It is important to point out here that the sample firms in the current research may not efficiently represent the general distribution of firm size for all industrial firms in Taiwan. Because TSE and OTC firms provide the only one reliable data source for systematic analysis, companies covered in this study are all public firms. It is thus likely that SMEs in reality account for a higher per-centage of group- and non-group firms, but they are not included in this study because they are private firms. This sampling constraint certainly places limitations to this study.
It is also found that group firms’ advantage in size also reflects on their market power: the average market share of group-affiliated firms is almost the double of non-group firms. With respect to their investment in research and devel-opment, the R&D intensity of non-group firms is significantly higher than that of group firms, sug-gesting that although owning limited resources, non-group small firms try to create value by pursuing cost or differentiation advantages through innovation. As to the diversification strategy, the
specialization ratio of non-group firms is signifi-cantly higher than that of group-affiliated firms. This shows that non-group firms have a higher level of specialization by focusing on their core businesses, while group-affiliated firms tend to be more diversified.
For the performance comparison between group and non-group firms, the results of t-test show that non-group firms significantly outperform group-affiliated firms on ROA; while for Tobin’s q, no significant difference was detected.
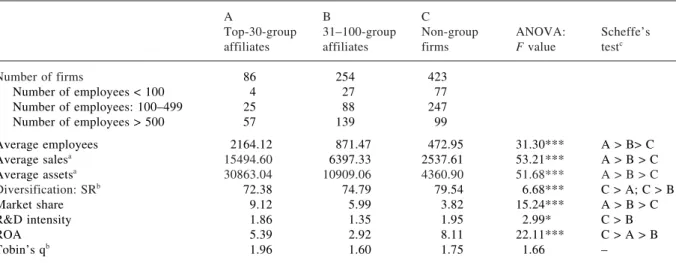
In order to examine more closely the possible influence of group affiliation, the total sample was further divided into three categories of firms: (a) firms that are affiliated with the largest 30 business groups (n = 86), (b) firms that are affil-iated with other smaller (top 31–100) business groups (n = 254), and (c) focused firms that are not affiliated with any business groups (n = 432). Table III summarizes the descriptive statistics as well as the results of one-way ANOVA and Scheffe’s test for the three categories of firms. The ANOVA results show that there indeed exist dif-ferences among the three categories of firms, in terms of size, market power, R&D strategy, diver-sification, and, most importantly, accounting performance. Results of the Scheffe’s test further indicate that non-group firms are the best per-formers (panel C), firms affiliated with the largest groups show medium performance (panel A), while those firms affiliated with small- and
TABLE II
Comparison of group and non-group firms (1997–99)
Total sample Group affiliates Non-group firms T-test: t-value
Number of firms 0763 00340 0423
Firms with fewer than 100 employees 0108 00031 0077
Firms with 100–499 employees 0360 00113 0247
Firms with more than 500 employees 0295 00196 0099
Average employees 0796.65 01198.43 0472.95 05.45*** Average salesa 5282.92 08698.41 2537.61 07.60*** Average assetsa 5927.90 15956.25 4360.90 06.94*** Diversification: SRb 0077.15 00074.18 0079.54 –3.54*** Market share 0005.14 00006.78 0003.82 04.68*** R&D intensity 0001.74 00001.48 0001.95 –2.06* ROA 0006.08 00003.55 0008.11 –6.33*** Tobin’s qb 0001.72 00001.68 0001.75 –0.49
***, **, * denote significance at the 1, 5 and 10 percent levels, respectively. aMillion new Taiwanese dollars.
medium-sized business groups are the worst per-formers.
4.2. Multiple regression analysis
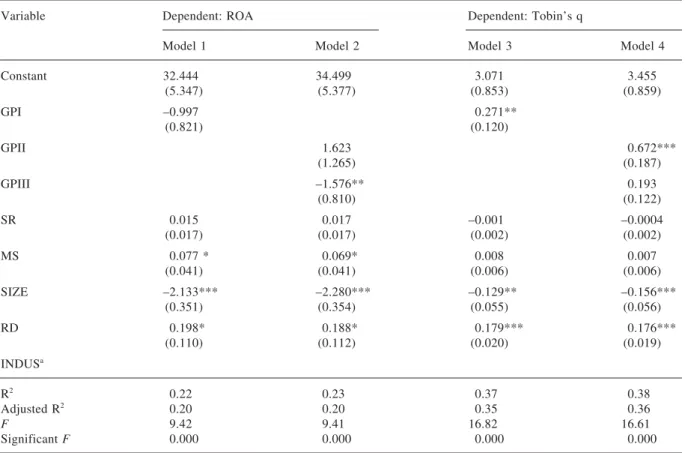
This section reports the results of the multiple regression analysis to investigate the relationships between group affiliation and firm performance, after controlling for a number of other variables such as firm size, diversification, market share, R&D strategy, and industry affiliation. Two dependent variables, ROA and Tobin’s q, were employed and four models were constructed. Table IV summarizes the results.
For the accounting performance ROA, in Model 1 the influence of group affiliation on profitability is not significant. After controlling for the size of business groups by separating the influence of group affiliation into two variables (GPII and GPIII), GPIII stands out significant in Model 2, with a negative sign. This indicates that firms associated with small (top 31–100) business groups significantly underperform other firms. This finding suggests that group affiliation can not always create value for member firms. The size of the business group matters. The findings are also different from the value-creation hypothesis
of business groups in emerging markets proposed by other scholars, and thus need to be interpreted carefully. Possible explanations of these findings will be discussed in a later section.
Other variables that stand out significantly in the ROA models are market share, firm size, and R&D intensity. The larger the market share of a firm, the higher the profitability of the firm. Firm size is negatively associated with profitability, suggesting the existence of diseconomy of scale. With respect to the R&D intensity, it is found that the higher the R&D intensity of a firm, the higher the profitability of the firm. This echoes with the traditional industrial organization literature. That is: the investment in research and development can create entry barriers as well as imitation barriers and thus raises the profits of the firm. Also it is consistent with the viewpoint of strategic man-agement that a company can pursue cost and dif-ferentiation advantages and above-average profitability through innovation.
With regard to the stock market performance, the results are different. In Model 3, I found a significant and positive relationship between group affiliation and Tobin’s q. Then I separated the influence of group affiliation into two variables in Model 4, and GPII stands out significant at the
TABLE III
Comparison of top-30, non-top-30, and non-group affiliations (1997–99)
A B C
Top-30-group 31–100-group Non-group ANOVA: Scheffe’s
affiliates affiliates firms F value testc
Number of firms 00086 00254 0423 Number of employees < 100 00004 00027 0077 Number of employees: 100–499 00025 00088 0247 Number of employees > 500 00057 00139 0099 Average employees 02164.12 00871.47 0472.95 31.30*** A > B> C Average salesa 15494.60 06397.33 2537.61 53.21*** A > B > C Average assetsa 30863.04 10909.06 4360.90 51.68*** A > B > C Diversification: SRb 00072.38 00074.79 0079.54 06.68*** C > A; C > B Market share 00009.12 00005.99 0003.82 15.24*** A > B > C R&D intensity 00001.86 00001.35 0001.95 02.99* C > B ROA 00005.39 00002.92 0008.11 22.11*** C > A > B Tobin’s qb 00001.96 00001.60 0001.75 01.66 –
***, **, * denote significance at the 1, 5 and 10 percent levels, respectively. aMillion new Taiwanese dollars.
bStatistics of 1999.
cThe pairs listed here are those categories of business groups (i.e., panels A, B, and C) for which the means are significantly
1 percent level, with a positive sign. This indicates that the affiliation with the largest 30 business groups indeed improves member firms’ stock market outcome, but the affiliation with small business groups does not influence the perfor-mance of member firms. Therefore, the stock market benefits of group affiliation in Taiwan are only contingent to the case of very large groups. Firm size again comes out negatively signifi-cant in Models 3 and 4, confirming the existence of diseconomies of scale. That is, the larger the size of a firm, the less profitable is the firm. Also, R&D intensity is significant in all the four models, and can be seen as a critical source of profitability for firms in Taiwan.
In order to further examine the influence of group affiliation on the performance of small and medium-sized firms, I constructed additional
regression models with only those firms that have fewer than 500 employees (n = 468 firms) included in the analysis (see Table V). This means that only small- and medium-sized firms are included in the models. The results are consistent with my earlier findings: association with large-scale (top 30) business groups indeed increases the accounting as well as stock market performance of SMEs, but affiliation with small-scale (top 31–100) groups yields a significant and negative influence on their accounting performance. These findings reconfirm the existence of the threshold effect of business group affiliation in emerging markets.
Findings of the multiple regression analysis suggest that the relationship between group affil-iation and firm performance in emerging markets needs further investigation. It emerges from the
TABLE IV
Results of multiple regression analysis (N = 763)
Variable Dependent: ROA Dependent: Tobin’s q
Model 1 Model 2 Model 3 Model 4
Constant 32.444 34.499 3.071 3.455 (5.347) (5.377) (0.853) (0.859) GPI –0.997 0.271** (0.821) (0.120) GPII 1.623 0.672*** (1.265) (0.187) GPIII –1.576** 0.193 (0.810) (0.122) SR 0.015 0.017 –0.001 –0.0004 (0.017) (0.017) (0.002) (0.002) MS 0.077 * 0.069* 0.008 0.007 (0.041) (0.041) (0.006) (0.006) SIZE –2.133*** –2.280*** –0.129** –0.156*** (0.351) (0.354) (0.055) (0.056) RD 0.198* 0.188* 0.179*** 0.176*** (0.110) (0.112) (0.020) (0.019) INDUSa R2 0.22 0.23 0.37 0.38 Adjusted R2 0.20 0.20 0.35 0.36 F 9.42 9.41 16.82 16.61 Significant F 0.000 0.000 0.000 0.000 a
For presentation parsimony, the seventeen industrial dummy variables are included in the regression models but are not shown in this table. Some industries came out significant in the equations, suggesting that favorable industrial structures indeed place influences on firm profitability. These industries include: electronic machinery, chemicals, information and electronics, and tourism. ***, **, * denote significance at the 1, 5 and 10 percent levels, respectively.
Taiwanese data that the influence of group affili-ation is mixed. When being affiliated with a very large (top 30) business group, member firms indeed show improved stock market performance. However, when a firm is affiliated with a small business group, its accounting performance suffers.
5. Discussion and conclusion
This paper seeks to provide empirical evidence on the influence of group affiliation on profitability in Taiwan. Traditional theories state that the most important source of profitability is the business unit effect, rather than the industry or corporate effects. This long-held belief has been challenged by some recent studies that propose the superior economic performance of large group-affiliated companies over non-group firms in emerging markets. By using 763 Taiwanese firms as the research sample, this paper found that the
proposed costs and benefits of group affiliation are subject to the size of business groups. Affiliation with the largest business groups is associated with stock market performance for member firms, but affiliation with small- and medium-sized groups dispatches member firms’ accounting profitability. These findings can be discussed in two aspects. First, potential advantages of group affiliation in emerging markets may be overemphasized in prior studies. If the inefficiencies pertained to emerging markets (including failure in product, capital and factor markets) can be overcome by business groups, the business groups must be large enough so that they can imitate institutions effectively. It is not simply the case that any business groups can successfully resolve the information and transac-tional costs in emerging markets.
Also, inefficiencies in emerging markets can be overcome by non-group small firms, in different ways, so that non-group firms also show satisfied
TABLE V
Regression results of SMEs profitability (N = 468 SMEs)
Variable Dependent: ROA Dependent: Tobin’s q
Model 1 Model 2 Model 3 Model 4
Constant 55.90 56.072 4.303 4.384 (8.152) (8.101) (1.453) (1.443) GPI –0.894 0.278* (1.042) (0.165) GPII 2.935* 0.862*** (1.712) (0.286) GPIII –1.901* 0.142 (1.107) (0.173) SR 0.022 0.024 0.002 0.002 (0.022) (0.021) (0.004) (0.003) MS 0.098 0.080 0.005 0.003 (0.071) (0.071) (0.014) (0.014) SIZE –3.805*** –3.825*** –0.231** –0.238** (0.550) (0.546) (0.097) (0.096) RD 0.369** 0.361** 0.241*** 0.238*** (0.145) (0.144) (0.026) (0.026) INDUS R2 0.32 0.34 0.44 0.45 Adjusted R2 0.30 0.31 0.41 0.42 F 10.28 10.23 13.01 12.89 Significant F 0.000 0.000 0.000 0.000
accounting performance. The success of exporting and original-equipment-manufacturing of Taiwan-ese small firms relies mainly on operational effi-ciency and flexibility, rather than on group-carried brand names. Complicated cross financing between individuals linked by personal and social ties may represent a more important source of capital raising than formal ties such as equity and group affiliation. The inefficiency of the judicial systems in emerging market usually leads to a low-trust institution in which personal/relational trust plays a more important role than system/ institutional trust (Fukuyama, 1995). What group affiliation represents is a formal and impersonal tie; its efficacy in substituting the judicial system in emerging markets remains questionable.
Secondly, the costs of group affiliation in emerging markets may be understated. By associ-ated with a business group, a company inevitably reduces its flexibility. Especially when the business group is vertically integrated, guaranteed internal purchases may lead to declining entre-preneurship and innovation of firms. Resource sharing and transactions among group members may be a source of value, but the profitability of a company suffers when it is engaged in cross-subsidization between member companies of the same business group. Finally, although large con-glomerates own certain power to lobby against regulations in emerging markets, they also rely on political connections more heavily than non-group small firms (Chu and MacMurray, 1993). Given their high dependence on policy makers, group-affiliated firms may be adopted to some govern-ment policies that serve political rather than economic goals. Especially when the business group is not large enough to imitate institutions, these costs may overweight the potential benefits of group affiliation and sacrifice the profitability of member firms.
Findings of this paper suggest a threshold effect and a U-shape relationship between group affilia-tion and profitability in Taiwan. That is, non-group firms and firms affiliated with the largest business groups show higher performance than those firms affiliated with small- and medium-sized groups. These finding are expected to expand our existing knowledge on the role and influence of business groups in emerging markets.
This paper also involves several limitations.
First of all, companies covered in this paper are the TSE and OTC companies, which are all public companies. Non-listed private enterprises are not included in the analysis. Therefore, the proportion of small, medium, and large firms found in this study may not be able to indicate the situation of all manufacturing firms in Taiwan. According to the definition of some scholars (e.g., Osteryoung and Newman, 1993), only those firms in which there is no public negotiability of common stock are considered as SMEs. The availability of sys-tematic and reliable data certainly constrains this study from meeting all definitional criteria of existing research.
Second, although the importance of informal financial systems in the survival and development of small firms in emerging markets was recog-nized, at the present time there is no scientific method to accommodate their influence on prof-itability into the statistical analysis. Informal financial systems, by definition, are those bor-rowing and lending activities that are not under the regulations of financial authorities. How and to what extend each sample firm uses such an informal system can not be detected from the financial statements. Finally, we can not rule out the possibility that factors not accounted for in this study might have some influence over profitability, for example, political and personal connections between large business groups and the government policy makers. Longitudinal and qualitative research might be a direction for future research to incorporate the murkier factors into the analysis.
Notes
1
According to Leff (1978), the business group plays three main structure roles. First, it can appropriate quasi-rents accruing from access to scarce resources and imperfect markets for inputs, such as capital, information, as well as honest and trustworthy high-level managers. Second, it provides an alternative to portfolio diversification due to the absence of markets for risk and uncertainty. Third, through vertical integration it overcomes the structural limit of monopoly or bilateral oligopoly.
2
The author owes special thanks to an anonymous reviewer, for pointing out the importance of the definitional issues of SMEs.
3
The entry of a business group into a new line of business is normally carried out through floating a new firm, rather than by adding a new business unit within an existing member firm. The individual firm of a business group thus tends to be
remarkably undiversified. This makes the affiliated firms of Taiwanese business groups equivalent to the business units or divisions within multibusiness firms or conglomerates in the U.S.A.
References
Ace, Z. J. and L. Preston, 1997, ‘Small and Medium-Sized Enterprises, Technology, and Globalization: Introduction to a Special Issue on Small and Medium-Sized Enterprises in the Global Economy’, Small Business Economics 9(1), 1–6.
Aharoni, Y. 1994, ‘How Small Firms Can Achieve Competitive Advantages in An Independent World’, in T. Agmon and R. Drobbnick (ed.), Small Firms in Global
Competition, New York: Oxford University Press.
Bain, J. S., 1968, Industrial Organization, New York: Wiley. Berger, P. and E. Ofek, 1995, ‘Diversification’s Effect on Firm
Value’, Journal of Financial Economics 37, 39–65. Brooksbank, R., 1991, ‘Defining the Small Business: A New
Classification of Company Size’, Entrepreneurship and
Regional Development 3, 17–31.
Buzzel, R. D., B. T. Gale and R. G. M. Sultan, 1976, ‘Market Share: A Key to Profitability’, Harvard Business Review
53 (January–February), 97–106.
Carrier, C., 1994, ‘Entrepreneurship in Large Firms and SMEs: A Comparative Study’, International Small Business
Journal 12(3), 54–61.
Chandler, A. D., 1962, Strategy and Structure: Chapters in
the History of the Industrial Enterprises, Cambridge: MIT
Press.
Chang, S. J. and U. Choi, 1988, ‘Strategy, Structure and Performance of Korean Business Groups: A Transactions Cost Approach’, Journal of Industrial Economics 37(2), 141–158.
Chang, S. J. and J. Hong, 2000, ‘Economic Performance of Group-Affiliated Companies in Korea: Intergroup Resource Sharing and Internal Business Transactions’,
Academy of Management Journal 43(3), 429–448.
Chang, S. J. and J. Hong, 2002. ‘How Much Does the Business Group Matter in Korea?’, Strategic Management Journal
23(3), 265–274.
Chou, T. C., 1995, Industrial Organizations in a Dichotomous
Economy: The Case of Taiwan, Avebury: Ashgate
Publishing.
Chu, T. C. and T. MacMurray, 1993, ‘The Road Ahead for Asia’s Leading Conglomerates’, The McKinsey Quarterly
3, 117–126.
Cooke, P. and D. Wills, 1999, ‘Small Firms, Social Capital and the Enhancement of Business Performance Through Innovative Programmes’, Small Business Economics 13, 219–234.
Daily, C. M. and M. J. Dollinger, 1993, ‘Alternative Methodologies for Identifying Family- versus Nonfamily-Managed Businesses’, Journal of Small Business
Management (April), 79–90.
Demsetz, H., 1973, ‘Industry Structure, Market Rivalry, and Public Policy’, Journal of Law and Economics 16, 1–9.
Fukuyama, F., 1995, Trust: The Social Virtues and the
Creation of Prosperity, New York: Free Press.
Ghemawat, P. and T. Khanna, 1998, ‘The Nature of Diversified Business Groups: A Research Design and Two Case Studies’, The Journal of Industrial Economics
XLVI(1), 35–61.
Goto, A., 1975, ‘Business Groups in A Market Economy’,
European Economic Review 19, 53–70.
Hamilton, G. G., 1996, Asian Business Networks, New York: Walter de Gruyter.
Hansen, G. S. and B. Wernerfelt, 1989, ‘Determinants of Firm Performance: The Relative Importance of Economic and Organizational Factors’, Strategic Management Journal 10, 399–411.
Hansen, J. A., 1992, ‘Innovation, Firm Size and Firm Age’,
Small Business Economics 4(1), 37–44.
Hoskisson, R. E. and T. A. Turk, 1990, ‘Corporate Restructuring: Governance and Control Limits of the Internal Capital Market’, Academy of Management Review
15, 459–477.
Hu, M. W. and C. Schive, 1998, ‘The Changing Competitiveness of Taiwan’s Manufacturing SMEs’, Small
Business Economics 11, 315–326.
Human S. E. and K. G. Provan, 1997, ‘An Emergent Theory of Structure and Outcomes in Small-firm Strategic Manufacturing Networks’, Academy of Management
Journal 40(2), 368–403
Keren, M. and D. Levhari, 1983, ‘The Internal Organization of the Firm and the Shape of Average Costs’, Bell Journal
of Economics 14, 474–486.
Khanna, T. and K. Palepu, 1997, ‘Why Focuses Strategies May Be Wrong for Emerging Markets’, Harvard Business
Review (July–August), 3–10.
Khanna, T. and K. Palepu, 1999, ‘The Right Way to Restructure Conglomerates in Emerging Markets’,
Harvard Business Review (July–August), 125–134.
Khanna, T. and K. Palepu, 2000a, ‘The Future of Business Groups in Emerging Markets: Long Run Evidence from Chile’, Academy of Management Journal 43(3), 268–285. Khanna, T. and K. Palepu, 2000b, ‘Is Group Affiliation Profitable in Emerging Markets? An Analysis of Diversified Indian Business Groups’, Journal of Finance
55(2), 867–822.
Leff, N. H., 1978, ‘Industrial Organizations and Entrepreneurship in the Developing Countries: The Economic Groups’, Economic Development and Cultural
Change 27, 661–675.
Lindenberg, E. B. and S. A. Ross, 1981, ‘Tobin’s q Ratio and Industrial Organization’, Journal of Business 54(1), 1–32. Markides, C. C., 1995, ‘Diversification, Restructuring and Economic Performance’, Strategic Management Journal
16, 101–118.
McGahan, A. M. and M. E. Porter, 1997, ‘How Much Does Industry Matter, Really?’, Strategic Management Journal
18, 15–30.
Mulhern, A., 1995, ‘The SME Sector in Europe: A Broad Perspective’, Journal of Small Business Management
33(3), 83–87.
‘Organizational Isomorphism in East Asia’, in Walter W. Powell and Paul J. DiMaggio (ed.), The New
Institutionalism in Organizational Analysis, Chicago:
University of Chicago Press, pp. 361–389.
Osteryoung, J. S. and D. Newman, 1993. ‘What Is A Small Business?’, Journal of Small Business Finance 2(3), 219–231.
Perrow, C., 1992, ‘Small-Firm Networks’, in Nitin Nohria and Robert Eccles (ed.), Networks and Organizations:
Structure, Form, and Action, Boston: Harvard Business
School Press, pp. 445–470.
Peters, T. J. and R. H. Waterman, 1982, In Search of
Excellence, London: Harper and Row.
Porter. M. E., 1980, Competitive Strategy, New York: Free Press.
Porter, M. E., 1987, ‘From Competitive Advantage to Corporate Strategy’, Harvard Business Review (May–June), 43–59.
Prahalad, C. K. and R. A. Bettis, 1986, ‘The Dominant Logic: A New Linkage between Diversity and Performance’,
Strategic Management Journal 7, 485–501.
Ravenscraft, D. J. and F. M. Scherer, 1987, Mergers, Sell-Offs,
and Economic Efficiency, Washington: Brookings
Institution.
Redding, S. G., 1996, ‘Weak Organizations and Strong Linkages: Managerial Ideology and Chinese Family Business Networks’, in G. G. Hamilton (ed.), Asian
Business Networks, New York: de Gruyter, pp. 27–42.
Regnier, P., 1993. ‘The Dynamics of Small and Medium-Sized Enterprises in Korea nd other Asian NICs’, Small Business
Economics 5, 23–36.
Rumelt, R. P., 1974, Strategy, Structure, and Economic
Performance, Boston: Harvard Business School Press.
Rumelt, R. P., 1984, ‘Toward A Strategic Theory of the Firm’, in Robert Lamb (ed.), Competitive Strategic Management, New York: Prentice Hall, pp. 557–570.
Rumelt, R. P., 1991, ‘How Much Does Industry Matter?’,
Strategic Management Journal 12, 167–185.
Scherer, F. M., 1980, Industrial Market Structure and
Economic Performance, 2nd ed., Chicago: Rand-McNally.
Schmalensee, R., 1985, ‘Do Markets Differ Much?’, American
Economic Review, 341–351.
Shea, J-D., 1994, ‘Taiwan: Development and Structure Change of the Financial System’, in Hugh T. Patrick and Yung Chul Park (eds.), The Financial Development of Japan,
Korea, and Taiwan: Growth, Regression and Liberalization, Oxford: Oxford University Press, pp.
222–187.
UNCTAD, United Nations Conference on Trade and Development, 1998, Handbook on Foreign direct
Investment by Small and Medium-sized Enterprises: Lessons from Asia, New York and Geneva.
Wade, R., 1990, Governing the Market: Economic Theory and
the Role of Government in East Asian Industrialization,
New Jersey: Princeton University Press.
Weidenbaum, M. and S. Hughes, 1996, The Bamboo Network, New York: The Free Press.
Wernerfelt, B., 1984, ‘A Resource-Based View of the Firm’,
Strategic Management Journal (April–June), 171–180.
Wernerfelt, M. and C. A. Montgomery, 1988, ‘Tobin’s q and the Importance of Focus in Firm Performance’, American
Economic Review 78, 246–250.
Winn, J. K., 1994, ‘Relational Practice and the Marginalization of Law: Informal Financial Practices of Small Businesses in Taiwan’, Law and Society Review 28(2), 193–232.