© 2010 TFSA
An Active Multidimensional Association Mining Framework with User
Preference Ontology
Chin-Ang Wu, Wen-Yang Lin, and Chuan-Chun Wu
Abstract
1Business data are subject to change by time or by the modifications of business rules. New knowledge needs to be extracted to reflect the most up to date situations hence periodic or occasional re-mining is essential. This paper proposes an active multidimensional association mining framework that incorporates with user preference ontology, which contains surrogate queries that represent frequently used queries in the query history log. The representative power and the user preference of the surrogate queries are derived and expressed in fuzzy linguistic terms. The construction of the ontology is demonstrated. How it can assist the active mining mechanism is also described. Specifically, the connection of the user preference ontology to the user profile in the enterprise database allows dispatching of new mining results to specific users automatically. A prototype implementation of the proposed system framework is provided and an effectiveness experiment for the user preference ontology is also conducted.
Keywords: Active mining, fuzzy set, multidimensional association mining, user preference ontology.
1. Introduction
Data mining is to discover knowledge from large amounts of data and is widely used in business world. The previously unknown knowledge mined increases business intelligence, provides better support for decision making and consequently promotes the business competition. In order to discover rich and useful knowledge, many different types of data mining techniques are used. For example, association mining explores the associations among data and is vastly used in market basket analysis. Multidimensional association
Corresponding Author: Wen-Yang Lin is with the Department of Computer Science and Information Engineering, National University of Kaohsiung, 700 Kaohsiung University Rd., Kaohsiung, Taiwan, 811.
E-mail: [email protected]
Manuscript received 20 Dec. 2009; revised 20 Feb. 2010; accepted 20 March. 2010.
mining makes association mining robust because it provides more specific settings for mining query. As a result managers obtain useful knowledge that is closer to their need.
However business data grows through time and subject to change when the business rules change. New knowledge needs to be extracted to reflect the most up to date situations hence periodic or occasional re-mining is essential. Current data mining paradigm is passive: a mining process is executed only when the user submits a mining query. In mining associations, a user forms a query to pursue his or her mining intension which is not always concrete. The situation is even more complex for multidimensional association mining; it is not easy for an inexperienced user to handle and needs more knowledge or an expert’s involvement.
Can a data mining be processed in an active way? For example, suppose a retailer integrates new data for mining every month, as a result re-mining to get new knowledge each month is important. Consider the following scenario: upon loading of the new month’s data, an active mining system automatically triggers mining processes, the mining results are stored in a rule base and managers receive the newly discovered knowledge of their interest through e-mails without delay. Thus the managers save tedious re-mining work each month and receive new knowledge in no time. Nevertheless two problems occur in such scenario. First, what queries are used for re-mining; second, what events trigger active mining? If each time each user has to formulate each query repeatedly, it will be time consuming and lack of efficiency.
To solve the problems, we propose in this paper a system framework of active multidimensional association mining with the support of user preference ontology. This system framework intends to provide automatic triggering of a mining process without the involvement of a user’s query formulation and submission. The user preference ontology maintains the frequently used and representative queries in the mining history. The user profile such as e-mail, department and job title are also connected to it. The events to trigger the active mining are defined and categorized according to their essence. When an event turns true, the system triggers a mining action on the queries in the user preference ontology according to the user’s setting. The
re-mining results are automatically dispatched to specific users via e-mails and also stored in the rule base for further analysis.
The mining queries in the user preference ontology are called surrogate queries that represent the mining log. The representative power and the user preference of a surrogate query is derived and expressed by fuzzy linguistic terms which are used to select the rules for active mining. A user defines specifically what representative power and what preference of the surrogate queries that he wants for re-mining. The objects the re-mining results dispatched to can be defined based on the user’s need. A prototype of the proposed system framework is implemented and the experiment is also conducted to test the effectiveness of the user preference ontology.
The rest of this paper is organized as follows. Section 2 introduces multidimensional association mining. Section 3 briefly presents the mining log and the architecture of the user preference ontology is presented in Section 4. Section 5 describes the proposed active mining framework. The prototype implementation and the experiment of the effectiveness of the user preference ontology are shown in Section 6. Section 7 summarizes related work and finally the conclusions are given in Section 8.
2. Multidimensional Association Mining
An association rule is an expression, A ⇒ B, where A and B are sets of items and A ∩ B = ∅. A is the body or the antecedent of the rule and B is the head or the
consequent of the rule. This rule suggests that
transactions in the data set contain A will very possible to also contain B. The support of the rule, P(A ∪ B), is the percentage of the total transactions that contain both
A and B. The confidence of the rule, P(B|A), is the
percentage of transactions that contain A also contain B. For example, a user may find that “75 percent of total transactions show that customers who bought both bread and milk” and “85 percent of all customers who bought bread also bought milk”, then the support is 75% and the confidence is 85%. For this rule to be interesting, A and
B should exceed the user specified minimum support and
minimum confidence.
In [11, 27] multidimensional association mining from data cube and data warehouse has been used. The query for a multidimensional association mining becomes robust because multiple dimensions in user specified granularity under certain settings of filtering conditions are allowed. This type of query allows a user to specify more precisely the data set they are interested in for analyzing. Hence the rules mined tend to be closer to what the user wants. The mining query of a
multidimensional association mining is defined as follows:
MP: <tG, tM, [wc], ms, mc>,
where tG, tM, wc, ms and mc are components of a query, tG:the set of transaction ID (data granularity),
tM:the set of interested mining attributes, wc: the optional “where” condition(s), ms: the minimum support and mc: the minimum confidence.
In this model, data granularity determines the transaction IDs of the mining data, which the users are allowed to set differently. Filtering conditions are also allowed to let users set the specific range of the mining data he or she wants. Following is an example query of a multidimensional association mining:
tG: StoreID, Category, TimeID tM: ProdName, Education wc: Country=”Japan” ms: 68%
mc: 80%
This example shows that the user wants to learn the associations of customers’ education and products bought among daily transactions by each store’s product category in Japan with minimum support 68% and minimum confidence 80%.
The format of a “wc” is
wc: (wca θ wcv) [, (wca θ wcv)],
where wca, θ and wcv are attribute, relational operator and value within a “where” condition. For example,
wc: Country = ”Japan”,
where “Country” is the wca, “=” is the θ and ”Japan” is the wcv.
3. Mining Log
A query reflects a user’s mining intension. For each successful mining process, the query and its user information are maintained in a log. In [12], for analysis purpose, the authors constructed web logs into a data warehouse which reduces the time to query data from huge volume. In this paper, the mining log is structured in a star schema as shown in Figure 1. A star
schema, proposed by Kimball [15], is a
multidimensional data model which is convenient for online analytical processing (OLAP). The purpose of structuring the mining log in a star schema is for its necessity to perform OLAP operations while condensing the log to the user preference ontology. OLAP provides operations namely, roll-up, drill-down, slice and dice. It also offers capabilities of calculating ratios and variance and generates summarizations, aggregations at a specific granularity level.
The information maintained in the mining log includes the elements of a query (tG, tM, wc, ms and mc), the
related user information and the mining statistics, for example, the rule count. A mining log grows by time and will be too tedious to be utilized in the active mining mechanism. Therefore the condensation of the mining log to get the representative queries is necessary.
Figure 1. Mining log constructed in star schema.
4. Architecture of User Preference Ontology
The user preference ontology contains the representative queries with the user information derived from the mining log. The user preference ontology provides two approaches of supports. First, it helps or inspires users’ expression of their mining intension by browsing its contents; second, it provides the mining query for active re-mining. The user preference ontology can be regarded as a concise version of the mining log that contains surrogate queries, the frequently used queries with representative power.
Figure 2 shows an example of user preference ontology. The surrogate queries are structured in hierarchies of (tG) ⎯ (tM) ⎯ (ms, mc). The attribute
index provides fast access to tG and tM. The user profile index connects to the users in the user preference ontology and also to the user profile database in the enterprise. Each user connects to a surrogate query with a user preference associated with it and each surrogate query also associates with a representative power (Rep_Power). Both Rep_Power and User_Pref can be query conditions for a user to access the surrogate queries he or she desires. For example, a user can access the surrogate queries with high representative power that he or she has medium preference for them. Following describes the construction details.
Figure 2. An example of user preference ontology.
Figure 3. Construction steps of user preference ontology. The construction of the user preference ontology is a pre-processed procedure thus the construction time is not a major concern. Figure 3 shows the construction steps. A. Aggregate mining log by tG, tM and UserID
In the mining log, any successful mining is recorded hence a query can be used by a user many times in the history. Summarizing the frequencies of queries by tG, tM
and User_ID are used for generating the surrogate queries. The averages of ms and mc are calculated for deriving the ms and mc for the surrogate queries. A SQL like language to express this process is:
select count(*), avg(ms), avg(mc) from MiningLogStar
grouping by tG, tM, User_ID
into Table GM-Pattern Table.
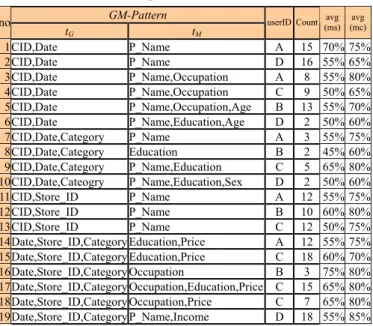
Table 1 is an example of the aggregation table, called a
GM-Pattern Table.
Table 1. Example of a GM-Pattern table. GM-Pattern
no
tG tM
userID Count (ms)avg (mc)avg
1CID,Date P_Name A 15 70% 75% 2CID,Date P_Name D 16 55% 65% 3CID,Date P_Name,Occupation A 8 55% 80% 4CID,Date P_Name,Occupation C 9 50% 65% 5CID,Date P_Name,Occupation,Age B 13 55% 70% 6CID,Date P_Name,Education,Age D 2 50% 60% 7CID,Date,Category P_Name A 3 55% 75% 8CID,Date,Category Education B 2 45% 60% 9CID,Date,Category P_Name,Education C 5 65% 80% 10CID,Date,Cateogry P_Name,Education,Sex D 2 50% 60% 11CID,Store_ID P_Name A 12 55% 75% 12CID,Store_ID P_Name B 10 60% 80% 13CID,Store_ID P_Name C 12 50% 75% 14Date,Store_ID,Category Education,Price A 12 55% 75% 15Date,Store_ID,Category Education,Price C 18 60% 70% 16Date,Store_ID,Category Occupation B 3 75% 80% 17Date,Store_ID,Category Occupation,Education,Price C 15 65% 80% 18Date,Store_ID,Category Occupation,Price C 7 65% 80% 19Date,Store_ID,Category P_Name,Income D 18 55% 85% Mining
L… 1. Aggregate mining log by tG, tM, UserID 2. Generate surrogate
queries 3. Decide the
representative power of the surrogate queries 4. Prune the surrogate
queries with sparse representative power
5. Integrate the user profile User
Preference ...
Input: the GM-Pattern table Output: the surrogate queries Step 1: sort the GM-Pattern table by tG.
Step 2: for each tG cluster in the GM-Pattern table, get tM with maximum
items (surrogate tM) among non-surrogate GM-Patterns in the same
cluster.
Step 3: for each redundant GM-Pattern to be pruned in the same tG cluster,
do 3.1-3.4.
3.1: accumulate query frequency by users.
3.2: increment by one the GM-Pattern count, if it is new. 3.3: increment by one the user count, if the user is new. 3.4: calculate new average support and confidence.
Step 4: for each surrogate tM, prune the redundant GM-Patterns in the
same tG cluster.
Step 5: mark <tG ◊ surrogate tM> a surrogate GM-Pattern. Update values
of 3.1 to 3.4.
Step 6: for each surrogate GM-Pattern calculate its average query frequency.
Step 7: if no more non-surrogate query then finish, go to Step 8 else go back to Step 2
Step 8: end.
Figure 4. Procedure for generating surrogate queries.
Definition 1. A GM-Pattern: <tG◊ tM> is any couple
of tG and tM in the GM-Pattern table. For example, in
Table 1 GM-Pattern of query no. 10 is <{CID, Date,
Category} ◊ {P_Name, Education, Sex}>.
Definition 2. Surrogate GM-Pattern vs. Redundant
GM-Pattern: suppose <tGs ◊ tMs> and <tGi ◊ tMi> are two GM-patterns. <tGs ◊ tMs> is said to be the Surrogate GM-Pattern of <tGi ◊ tMi> and <tGi ◊ tMi> be the Redundant GM-Pattern if tGs = tGi and tMs ⊇ tMi.
The reason a surrogate GM-Pattern can represent a redundant GM-Pattern is because the tM of a surrogate GM-Pattern is a super set of that of the redundant GM-Pattern it represents. Thus the association rules
generated by a surrogate GM-Pattern will also be a super set of those generated by the redundant GM-Patterns it represents.
B. Generate surrogate queries
Figure 4 describes the process for generating surrogate queries from GM-Pattern table.
Example 1: In Table 1, the cluster tG = {CID, Date}
has the maximum item set of tM = {P_Name, Education, Sex}, thus it is initially selected as a surrogate tM.
Queries in the same cluster with tM being the subset of
the surrogate tM, namely, {P_Name}, {Education},
{Sex}, {P_Name, Education}, {P_Name, Sex}, {Education, Sex} are redundant GM-Patterns and will be pruned if exist. Each tG cluster is represented by one or
more surrogate GM-Patterns.
The effectiveness of a surrogate query is fairly decided by the setting of its ms and mc. Intuitively, if the minimum values of ms and mc among the queries that the surrogate GM-Patterns represent are adopted, the recall shall be the highest yet the precision will be affected. To balance the tradeoffs of recall andprecision,
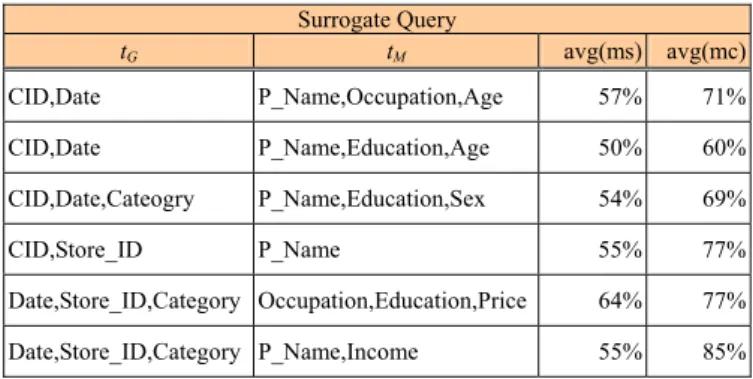
averaging values of ms and mc are calculated for each surrogate GM-Pattern. Statistic values of performing steps 3.1 to 3.4 of the proposed algorithm over the example in Table 1 are shown in Table 2 and Table 3. C. Decide the representative power of a surrogate
query
(1) Calculate the value of the representative power The representative power of a surrogate query is evaluated with the following factors (see Table 2):
z number of total query frequency it represents
(sum of freq. by users)
z number of distinct GM-Patterns it represents
(GM-Pattern count)
z number of users it represents (user count)
z average frequency of the GM-Patterns it
represents (avg. freq)
Suppose that the mining log has N_Q of queries and involved with User_Ct of total users. Let p be the total number of distinct tG, q the total number of distinct GM-Patterns in the GM-Pattern table and r the number
of surrogate tMs within each tG cluster. For each GM-Pattern in the GM-Pattern table, GMij, where 1 < i
< p and 1 < j <r, Tot_QFG M i j, Dist_GMG M i j, Dist_UserGMij, and Avg_QFGMij are the total query
Table 2. Example of surrogate GM-Patterns based on Table 1 (User and Query).
Surrogate GM-Pattern Freq. by users
tG tM A B C D User Count GM-P attern Count Avg. Freq CID,Date P_Name,Occupation,Age 23 13 9 16 4 3 20 CID,Date P_Name,Education,Age 2 1 1 2 CID,Date,Cate ogry P_Name,Educati on,Sex 3 2 5 2 4 4 3 CID,Store_ID P_Name 12 10 12 3 1 34 Date,Store_ID ,Category Occupation,Educ ation,Price 12 3 40 3 4 14 Date,Store_ID ,Category P_Name,Income 18 1 1 18
Table 3. Example of surrogate queries based on Table 1 (ms and mc). Surrogate Query tG tM avg(ms) avg(mc) CID,Date P_Name,Occupation,Age 57% 71% CID,Date P_Name,Education,Age 50% 60% CID,Date,Cateogry P_Name,Education,Sex 54% 69% CID,Store_ID P_Name 55% 77% Date,Store_ID,Category Occupation,Education,Price 64% 77% Date,Store_ID,Category P_Name,Income 55% 85%
frequency, distinct GM-Patterns, distinct user count and average query frequency, respectively. The value of representative power VRep_Power, of a surrogate query,
SQGMij, is calculated as follows:
∑
< < < < × ⎟⎟ ⎠ ⎞ + ⎜⎜ ⎝ ⎛ + = r j p i GMij GMij GMij GMij GMij GMij QF Avg QF Avg q GM Dist Q N QF TOT User_Ct Dist_User SQ VRep_Power 1 1 _ _ _ _ _ ) ( (1)The average query frequency over the sum of all the average query frequency makes the values of representative power relative to each other. Consider the following example in the GM-Pattern table,
N_Q = 182, User_Ct = 4, p = 4, q = 14, Dist_User({CID,Date},{P_Name,Occupation,Age}) = 4, Tot_QF({CID,Date},{P_Name,Occupation,Age}) = 61, Dist_GM({CID,Date},{P_Name,Occupation,Age}) = 3, AVG_QF({CID,Date},{P_Name,Occupation,Age}) = 20, . 3459 . 0 91 20 ) 14 3 182 61 4 4 ( ) ( ({CID, Date},{P_Name,Occupation ,Age})
= × + + = SQ VRep_Power
(2) Transform the value of representative power into fuzzy linguistic terms
The representative power of a surrogate query, expressed in crisp value, is hard for users to appreciate to what extent the value indicates. Fuzzy approach is closer to human thought and allows broader selection to include a group of closely related data [14]. Thus, we adopt the concept of fuzzy sets [26] to transform the value of representative power into fuzzy linguistic terms, such as strong, weak or other degree. Nowadays in order to get data easily and make the computation efficiently, trapezoidal membership functions are used often and triangular membership function is a special case of this [28].
Definition 3: A triangular membership function for fuzzy set à has fuzzy intervals triMFVà = <a, b, c>,
where a, b, c ∈ R and a < b < c. The membership functions of triMFVÃ are defined as:
⎪ ⎪ ⎪ ⎩ ⎪⎪ ⎪ ⎨ ⎧ ∈ − − = ∈ − − = otherwise c b x b c x c x b b a x a b a x c b a x
μ
Α triMFV , 0 ] , [ , , 1 ] , [ , ) , , ; ( ~ (2)Membership functions are assigned subjectively in general, usually by a domain expert. In [21], for generating membership functions, some factors used by the experts are introduced and some methods proposed by different researches are surveyed too. In this paper,
T(Rep_Power) = {sparse, weak, moderate, strong} is
defined as the linguistic terms to represent surrogate queries. Four membership functions of triangular are defined below by the experts for each of the fuzzy sets, respectively.
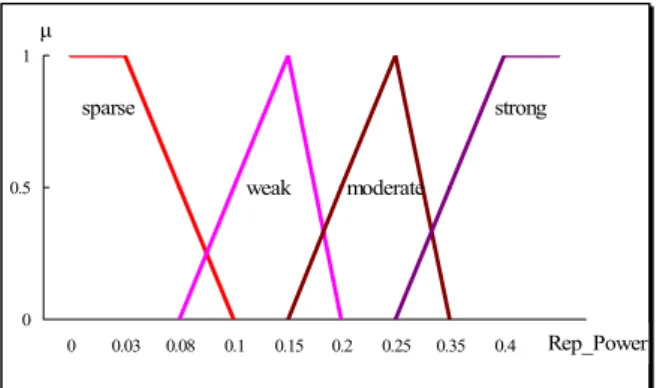
triMFVsparse = <-, 0.03, 0.1> triMFVweak = <0.08, 0.15, 0.2> triMFVmoderate = <0.15, 0.25, 0.35> triMFVstrong = <0.25, 0.4, ->
The graph of fuzzy set is shown in Figure 5. The ends of sparse and strong extend the maximum degree of the membership.
Each VRep_Power is mapped into a linguistic term
Rep_Power and stored in the user preference ontology.
For example the representative power of surrogate query calculated earlier:
VRep_Power({CID,Date},{P_Name,Occupation,Age}) = 0.3459,
is transformed into a linguistic value as follows: the degree of membership for each linguistic values are
μsparse(0.3459) = 0, μweak(0.3459) = 0, μmoderate(0.3459) =
0.041, μstrong(0.3459)=0.361, respectively. The maximum
is μstrong(0.3459), as a result strong is the suggested Rep_Power.
D. Prune the surrogate queries of sparse representative
power
The user preference ontology is used to represent the mining log. Surrogate queries with sparse representative power are pruned for its lack of representing queries in the mining log.
E.
Integrate the user profile
The frequency of each surrogate query used by a user in the history is recorded to reflect the interestingness, importance or user preference of this query. Despite the recorded frequency, it is still difficult to learn its implications. Thus the mapping of such a frequency to a linguistic term is necessary. The linguistic terms to express the user preference of a surrogate query are defined as T(User_Pref) = {low, medium, high}. The intervals of membership functions for each of the terms are also provided by the experts as follows:
0 0.5 1 0 0.03 0.08 0.1 0.15 0.2 0.25 0.35 0.4 Rep_Power1 μ sparse weak moderate strong
Figure 5. Membership function graph for representative power.
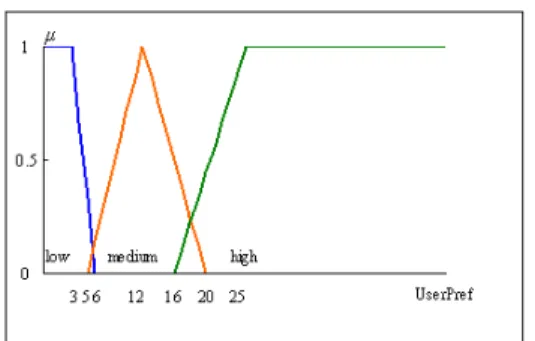
Figure 6. Membership function graph for user preference. triMFVlow = <-, 3, 6>
triMFVmedium = <5, 12, 20> triMFVhigh = <16, 25, ->
The graph of the corresponding fuzzy set is shown in Figure 6.
The frequency of each surrogate query used by a user is mapped to a linguistic term User_Pref to represent the user preference and stored in the user preference ontology. For example, from Table 2, the frequency of surrogate query with GM-Pattern= <{CID, Date} ◊ {P_Name, Occupation, Age}> used by user A is 23. The membership degrees of the linguistic values are μlow(23)
= 0, μmedium(23) = 0, μhigh(23) = 0.778, respectively.
μhigh(23) has the maximum value, thus the user
preference User_Pref is high. The user preference of a surrogate query is used by the users to specify a rule in the active mining mechanism proposed in next section.
5. Active Multidimensional Association Mining
Framework with User Preference Ontology
This section describes the proposed active multidimensional association mining framework that incorporates with user preference ontology. The structure is shown in Figure 7. Both regular and active paths are depicted in the system framework. A regular multidimensional association mining pathstarts from the query formulation by a user. The mining engine then runs the query the user submitted and returns with the resulting rules. The user preference ontology contains surrogate queries that are constructed from the mining history. It provides recommendations for a user while formulating a query in the regular mining pathand also provides queries for active re-mining in the active path. The active path initiates from the database alert system which monitors events that are defined for triggering active actions. The active rule and dispatch unit defines rules and action details to be performed when the triggering events turn true. The mining action will be performed automatically without a user’s specification of a query. The active rules define conditions of queries to be retrieved in the user preference ontology for active mining. The query will then be applied to the mining
engine and the results will be saved in the rule base and dispatched according to the active rules.
Figure 7. Active multidimensional association mining framework.
As discussed in [6, 22], the approach of event-condition-action (ECA) rules toward active database systems is common. The event part of a rule defines something that happens at a point in time and will trigger the rule, the condition part of a rule evaluates if an action should be started and the action part of a rule defines the tasks to be carried out when the event occurred and the condition is true. In some proposals of active database systems event-action or condition-action are also used [22]. Some commercial database products, such as SQL Server and Oracle, do provide active triggers and notification services [29, 30]. For example, in SQL Server 2005 a notification can be subscribed by a user according to the predefined schedule or the occurrence of a triggering event he or she specifies. SQL Server Agent also provides mechanism for automatic responses to the occurrences of schedules and alarms by processing jobs [32]. SQL Server Integration Services [31] can also send e-mail messages in response to certain events. The source that triggers an event can be inside or outside of the database. The active mechanism is feasible via these commercial tools. In this paper, event-action type of rules is adopted to enable the proposed active mechanism. As shown in Figure an active mining is initiated from the occurrence of an event and triggers a data mining process with queries in user preference ontology. The mining results are not only dispatched to the user but also stored in the rule base for further query trend analysis. Next, the event-action rule proposed for active mining is demonstrated.
A. Event
Events are distinguished into three categories:
z Business data change: for example, total sales
amount increases abnormally, a product is out of
Active Rule (Flag) & Dispatch
Database Alert
System Condensation
Enterprise User
Profile Database User Preference Ontology
... Query Formulation Mining Log Data Cube Data Mart Data Mart Data Warehouse
…
User … Regular path Active path Rule Base … … … Mining Engine … … …stock too soon and too often abnormally or the new month’s data is ready for mining.
z Business rule change: for example, the small note
book originally belonging to the notebook category will now have a category of its own.
z Time setting: the event turns true on certain point
of time. The timer setting types include period, absolute or relative [5]. For example, “on 15th of
each month” or “on 1st Sunday of a quarter” are
periodic, “on Jan. 8, 2009” is an absolute date, and “7 days before accounting is closing” is a relative date.
The database alert system, as shown in Figure 7, contains procedures that monitor the events defined for triggering active mining. The active rule in Figure 7 defines rules and triggering flags for active mining. Generators of events include the system clock and the database alert system. The database alert system will detect if any events occur and erect a flag to send to the active rule unit dynamically. Once the active rule unit is notified of the erected flag, the corresponding action will be taken.
B. Action
An action in the active mining mechanism has two processes:
z Mining: it always triggers a data mining process
with one or more than one query.
z Dispatch: it dispatches the results to one or more
than one user.
The surrogate queries used for active mining are determined by the following factors: the transaction ID (tG), the interested mining attribute (tM), the
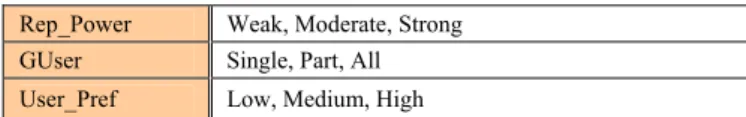
representative power of a surrogate query in linguistic term (Rep_Power), the user group (GUser) and the user preference of a query (User_Pref). These factors are optional in that if any of them is missing, all its members are included. That means no specifications about that particular factor. Table 4 shows the conditions which determine the surrogate queries to be used in active mining.
Combined with the enterprise user profile database,
GUser can be defined according to the departmental
information, position level or working experience, etc. Assorted combinations of the factors can be specified. For example, one may specify queries of all users with high user preference and representative power greater than or equal to moderate. The GUser in selecting mining queries are not necessarily the GUser for dispatching. Some examples are: user can subscribe and dispatch singly for himself, capable people can subscribe active mining for inexperienced ones, a supervisor can subscribe for his or her team or a departmental head can subscribe for all members in the department, etc.
Table 4. Filtering conditions of surrogate queries for active mining.
Rep_Power Weak, Moderate, Strong
GUser Single, Part, All
User_Pref Low, Medium, High
C. Rule
An expert or a user defines an active mining rule when he or she needs it. A rule, composed of event and action parts, has the following format:
On (Event) Begin
Mining queries: [tG],[tM],[Rep_Power], [GUsermining], [User_Pref]
Dispatch to: GUserdispatch
End
Following are some examples: Example 2:
On (Date(day) = 1 ) Begin
Mining queries: Rep_Power = Moderate, GUsermining = {A}, User_Pref = High
Dispatch to: GUserdispatch = {Sales Department}
End
This example indicates that when it is the first day of a month, mine actively with only user A’s queries, which have high user preference and moderate representative power. When finish, dispatch the results to all members in the sales department.
Example 3:
On (Date(day) = 1 ) Begin
Mining queries: Rep_Power = Moderate, GUsermining = {A}, User_Pref = High
Dispatch to: GUserdispatch = {Sales Department}
End
This example shows that when the flag of event “total sales tripled” is on, do mining on strong representative and high user preference queries used by users A and B for finding associations between product and customer’s income. The results are then sent to users A and B.
In summary, the mining system incorporated with user preference ontology enables the following functions:
z Active mining actions, supported by the surrogate
queries in the user preference ontology.
z Dispatch of new rules to users according to their
preference, supported by the user profile connections in the user preference ontology.
z System’s recommendation of query formulation,
supported by the surrogate queries in the user preference ontology.
6. Experiment
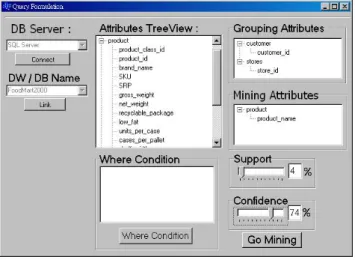
A prototype implementation of the proposed system framework is delivered by using Borland C++ Builder and SQL Server 2008 to demonstrate our study. As shown in Figure , the regular data mining started with a query formulation by a user, the correctly formed query is then fed into the mining engine. While the mining task is successfully finished, the query is accumulated into the mining log. The user preference ontology is created from the mining log by the algorithm proposed in Section IV. Figure 8 shows the query formulation interface of the prototype system.
The active mining mechanism proposed in this paper is also tested for its feasibility by using SQL Server Agent in SQL Server 2008 which integrates event monitoring and action processing. The Database Alert System in Figure 7 is realized by defining, in SQL Server Agent, schedules and alarms which trigger jobs. The jobs as a whole correspond to the Active Rule & Dispatch unit in Figure 7, which describe rules that process the active events, actions, and the dispatching tasks. Figure 9 shows the relationships of active mining mechanism with SQL Server Agent.
SQL Server Agent can be implemented with TSQL or SQL Server Management Objects (SMO) using languages such as Microsoft Visual Basic, Visual C++ and C#. We have tested the related functions in fraction while the overall implementation is in a drafting stage and the construction will be a future work. Figure 10 shows some partial codes in TSQL for defining a SQL Server Agent job which performs a routine monthly job with two sub-tasks under a monthly schedule.
Figure 8. Interface for query formulation.
Figure 9. Active mining mechanism with SQL Server Agent.
BEGIN TRANSACTION ...
DECLARE @ReturnCode INT SELECT @ReturnCode = 0 DECLARE @jobId BINARY(16)
EXEC @ReturnCode = msdb.dbo.sp_add_job @job_name=N'RoutineMonthlyJob', @enabled=1, @notify_level_eventlog=0, @notify_level_email=1, @notify_level_netsend=0, @notify_level_page=0, @delete_level=0,
@description=N'Actively Re-Mining Monthly。', @category_name=N'ActiveMining',
@owner_login_name=N'CSU-E2BD3D8FAA3\Teajean', @notify_email_operator_name=N'cwu', @job_id = @jobId OUTPUT EXEC @ReturnCode = msdb.dbo.sp_add_jobstep @job_id=@jobId, @step_name=N'GetMonthlyQuery', @step_id=1, @cmdexec_success_code=0, @on_success_action=3, @on_success_step_id=0, @on_fail_action=2, @on_fail_step_id=0, @retry_attempts=0, @retry_interval=0, @os_run_priority=0, @subsystem=N'TSQL', @command=N'USE [master] @database_name=N'FoodMart2000', @flags=0 …
EXEC @ReturnCode = msdb.dbo.sp_add_jobstep @job_id=@jobId, @step_name=N'DoMiningTask', @step_id=2, @cmdexec_success_code=0, @on_success_action=1, @on_success_step_id=0, @on_fail_action=2, @on_fail_step_id=0, @retry_attempts=0, @retry_interval=0, @os_run_priority=0, @subsystem=N'TSQL', @command=N'USE [master] @database_name=N'FoodMart2000', @flags=0 …
EXEC @ReturnCode = msdb.dbo.sp_add_jobschedule @job_id=@jobId, @name=N'ScheduleMonthly', @enabled=1, @freq_type=16, @freq_interval=2, @freq_subday_type=1, @freq_subday_interval=0, @freq_relative_interval=0, @freq_recurrence_factor=1, @active_start_date=20091116, @active_end_date=99991231, @active_start_time=0, @active_end_time=235959, @schedule_uid=N'f95c24fe-a42a-4ee5-bf8b-888cccd1b911' …
Figure 10. Partial job definition codes in TSQL. The effectiveness of the user preference ontology is also tested by comparing the recalls and precisions of two example surrogate queries under two different support specifications, by average and minimum values. Microsoft Foodmart 2000 database is the utilized dataset. The recall and precision of a surrogate query (SQ) over the queries it represented (RQ) is defined as follows:
True Positive (TP): what SQ mined that RQ does too, False Positive (FP): what SQ mined that RQ does not, False Negative (FN): what RQ mined that SQ does not.
Database Alert System Schedules
Alarms
Active Rule & Dispatch Jobs SQL Server Agent
Recall =
FN
TP
TP
+
, and Precision =TP
FP
TP
+
.The GM-Patterns of the example RQs are listed in the following,
RQ1: <{CID, Date} ◊ {P_Name}>, ms= 0.06%, RQ2: <{CID, Date} ◊ {P_Name, Occupation}>,
ms= 0.2%,
RQ3: <{CID, Date, Category} ◊ {P_Name}>, ms= 0.00426%,
RQ4: <{CID, Date, Category} ◊ {P_Name,
Education}>, ms= 0.0043%.
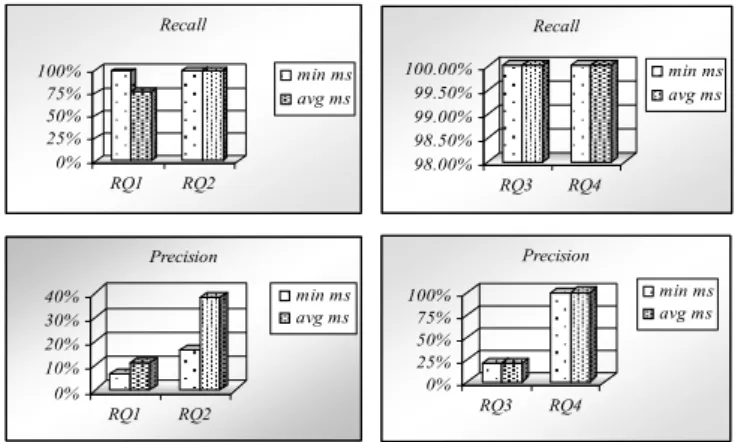
The GM-Patterns of RQ2 and RQ4 are also SQs which have been tested by using average supports (1.3% and 0.00428%) and minimum supports (0.06% and 0.00426%) of RQs, respectively. Figure 11 shows the corresponding recalls and precisions.
In the case that the RQ supports are of drastic variance, i.e., RQ1 and RQ2, the recalls of using minimum values as supports are always very high, yet their precisions tend to be low; the recalls of using average values as supports are generally high and the precisions are almost double of the ones using minimum values. On the other hand, in the case that RQ supports are close to each other, the minimum and average values are close to each too, such as the case of RQ3 and RQ4; their recalls are always high and the precisions are similar. According to the experiment, adopting average support values for surrogate queries provides good recalls and high precisions. In the meantime it also avoids extreme minimum support in mining which decrease the precision dramatically and might cause excessive running time and memory space.
7. Related Work
Considerable proposals and applications have been provided to the active database systems [22], yet not much research on the active data mining has been given.
Figure 11. The recalls and precisions of the example surrogate queries.
Agrawal and Psaila [2] first introduced the term of active data mining, considering data mining under changing environment. They presented active data mining from accumulated association rules when certain trend of rules is found, and focused on defining shapes of trends and query languages for getting the shape. Their work also has stimulated the closely related theme about change detection from dynamically evolving data [10, 18, 23]. Recently, the research of active data mining has been broadened extensively [20], referring to any effort in automating the processes within the generic KDD framework [8], such as data collection, model selection [4], pattern discovery [24], rule evaluation [16, 17], etc. Our study of active mining in this context involves target data selection, pattern discovery and deployment, which to the best of our knowledge has not been investigated in the literature.
In summary, our work focuses on activating data re-mining with the queries in the user preference ontology that embodies the representative of queries used in history. Many concepts or techniques used in our framework in some way resemble those adopted in the recommender system community [1], for example, incorporating user preferences [3, 9], learning user preference without intrusively monitoring the user’s activities [13, 19], ontological representation of user preferences [19], and query log analysis [7, 25]. Nevertheless, the main purpose of our work is quite different. Rather than recommending unseen items or subjects in which the user interested, we aim at capturing what data mining queries interest the user the most and build an activating mechanism to re-execute these queries, keeping the users aware of the newest updates of the evolving environment. Yet we believe that the experiences learned in the recommender system community can shed light on promising research issues on the active data mining.
8. Conclusions
Active data mining is a new direction of data mining which aims at making a better data mining process. Some major jobs of a data mining process [8] includes: defining an objective for data mining, collecting necessary data from heterogeneous sources, cleaning and transforming data, selecting target data for mining, pattern discovery, pattern deployment and knowledge interpretation. The idealistic situation is integrating all steps into an automatic system so that even an inexperience user can handle it well. It is a challenge and not much related research has been conducted. In this paper, focusing on target data selection, pattern discovery and deployment, we have presented an active multidimensional association mining framework with the 0% 25% 50% 75% 100% RQ1 RQ2 Recall min ms avg ms 0% 10% 20% 30% 40% RQ1 RQ2 Precision min ms avg ms 0% 25% 50% 75% 100% RQ3 RQ4 Precision min ms avg ms 98.00% 98.50% 99.00% 99.50% 100.00% RQ3 RQ4 Recall min ms avg ms
help of the user preference ontology, which intends to integrate the system in a way that reduces a user’s involvement, especially an inexperienced one, and hence lessens his or her work load. How the user preference ontology is constructed, how an active rule is defined and how an active mining works has been described. The user preference ontology contains the surrogate queries whose representative power and the user preference are calculated and expressed in fuzzy linguistic terms. Different sets of queries in the user preference ontology can be selected for active re-mining by specifying the user group and the degrees of the representative power and the user preference of a surrogate query. The dispatch of the active mining results is allowed to set as needed. We have shown that this active mining mechanism has the following benefits:
1. The queries maintained in the user preference ontology can be referred to by inexperienced users; 2. Active mining based on user preference ontology
obtains overall up-to-date information automatically; 3. Specific re-mining queries can be set according to
the users’ requirements; and
4. The results can be dispatched automatically to specific users according to their preference.
Data mining results are maintained in a rule base in the proposed active mining framework. A focus further on interpretation of the knowledge, for example, the pattern trend analysis is an intension of our future work, for this can extend business intelligence and improve enterprise competition.
Acknowledgment
This work is partially supported by National Science Council of Taiwan under grant No. NSC95-2221- E-390-024.
References
[1] G. Adomavicius and A. Tuzhilin, “Towards the next generation of recommender systems: A survey of the state-of-the-art and possible extension,” IEEE
Trans. on Knowledge and Data Engineering, vol.
17, no. 6, pp. 734-749, 2005.
[2] R. Agrawal and G. Psaila, “Active data mining,” in
Proc. of 1st International Conference on Knowledge Discovery and Data Mining, pp. 3-8,
1995.
[3] S. Ansari, R. Kohavi, L. Mason, and Z. Zheng, “Integrating e-commerce and data mining: Architecture and challenges,” in Proc. of IEEE
International Conference on Data Mining, pp.
27-34, 2001.
[4] C. Bailey-Kellogg and N. Ramakrishnan, “Active data mining of correspondence for qualitative
assessment of scientific computations,” in Proc. of
17th International Workshop on Qualitative Reasoning, pp.23-30, 2003.
[5] U. Dayal, A. Buchmann, and D. McCarthy, “Rules are objects too: A knowledge model for an active, object-oriented database system,” in Proc. of 2nd
International Workshop on OODBS, pp. 129-143,
1988.
[6] K. R. Dittrich, S. Gatziu, and A. Geppert, “The active database management system manifesto: A rulebase of ADBMS features,” in Proc. of 2nd
International Workshop on Rules in Database Systems, pp. 1-17, 1995.
[7] F. M. Facca and P. L. Lanzi, “Mining interesting knowledge from weblogs: A survey,” Data and
Knowledge Engineering, vol. 53, no. 3, pp.
225-241, 2005.
[8] U. M. Fayyad, P. S. Gregory, and S. Padhraic, “The KDD process for extracting useful knowledge from volumes of data,” Communications of the ACM, vol. 39, no. 11, pp. 27-34, 1996.
[9] R. Forsati, M. R. Meybodi, and A. Rahbar, “An efficient algorithm for web recommendation systems,” in Proc. of IEEE International
Conference on Computer Systems and Applications,
pp. 579-586, 2009.
[10] V. Ganti, J. Gehrke, and R. Ramakrishnan, “A framework for measuring changes in data characteristics,” in Proc. of 8th ACM
SIGMOD-SIGACT-SIGART Symposium on Principles of Database Systems, pp. 126-137, 1999.
[11] J. Han and M. Kamber, Data Mining: Concepts
and Techniques, Morgan Kaufmann, 2001.
[12] K. P. Joshi, A. Joshi, and Y. Yesha, “On using a warehouse to analyze web logs,” Distributed and
Parallel Databases, vol. 13, no. 2, pp. 161-180,
2003.
[13] S. Y. Jung, J. H. Hong, and T. S. Kim, “A statistical model for user preference,” IEEE Transactions on
Knowledge and Data Engineering, vol. 17, no. 6,
pp. 834-843, 2005.
[14] V. Kapoor, S. S. Tak, and V. Sharma, “Location selection – A fuzzy clustering approach,”
International Journal of Fuzzy Systems, vol. 10, no.
2, pp. 123-128, 2008.
[15] R. Kimball, The Data Warehouse Toolkit: Practical
Techniques for Building Dimensional Data Warehouses, John Wiley & Sons, INC., 1996.
[16] Y. Kitamura, A. Iida, K. Park, and S. Tatsumi, “Micro-view and macro-view approaches to discovered rule filtering,” in Proc. of 2nd
International Workshop on Active Mining, pp.
[17] Y. Kitamura, K. Park, A. Iida, and S. Tatsumi, “Discovered rule filtering using information retrieval technique,” in Proc. of 1st International
Workshop on Active Mining, pp. 80-84, 2002.
[18] B. Liu, W. Hsu, H. S. Han, and Y. Xia, “Mining changes for real-life applications,” in Proc. of 2nd
International Conference on Data Warehouse and Knowledge Discovery, pp. 337-346, 2000.
[19] S. E. Middleton, D. C. De Roure and N. R. Shadbolt, “Capturing knowledge of user preferences: Ontologies in recommender systems,” in Proc. of 1st International Conference on
Knowledge Capture, pp. 100-107, 2001.
[20] H. Motoda (ed.), Active Mining: New Directions of
Data Mining, IOS Press, 2002.
[21] H. T. Nguyen, “On foundations of fuzzy theory for soft computing,” International Journal of Fuzzy
Systems, vol. 8, no. 1, pp. 39-45, 2006.
[22] N. W. Paton and O. Diaz, “Active database systems,” ACM Computing Surveys, vol. 31, no. 1, pp. 63-103, 1999.
[23] K. Wang, S. Zhou, C. A. Fu, and J. X. Yu, “Mining changes of classification by correspondence tracing,” in Proc. of SIAM International
Conference on Data Mining, pp. 97-106, 2003.
[24] W. Wang, J. Yang, and R. Muntz, “An approach to active spatial data mining based on statistical information,” IEEE Trans. on Knowledge and Data
Engineering, vol. 12, no. 5, pp. 715-728, 2000.
[25] S. Wedig and O. Madani, “A large-scale analysis of query logs for assessing personalization opportunities,” in Proc. of 12th ACM SIGKDD
International Conference on Knowledge Discovery and Data Mining, pp. 742-747, 2006.
[26] L. A. Zadeh, “Fuzzy sets,” Information and Control, vol. 8, pp. 338-353, 1965.
[27] H. Zhu, On-Line Analytical Mining of Association
Rules, Master’s Thesis, Simon Fraser University,
Canada, 1998.
[28] H. J. Zimmermann, Fuzzy Set Theory and Its
Applications, Kluwer, 1996. [29] http://msdn.microsoft.com/en-us/library/ms166495 (SQL.90).aspx [30] http://www.oracle.com/technology/products/reports /apis/plugNotification/NOT_1.html [31] http://msdn.microsoft.com/en-us/library/ms141026. aspx [32] http://msdn.microsoft.com/en-us/library/ms187880. aspx Chin-Ang Wu is a PhD candidate in
the Department of Information Engineering at the I-Shou University, Taiwan. She received her MS degree in Computer Science from George Washington University, Washington D.C., USA in 1988. Her research interests include data mining, data warehousing and database systems.
Wen-Yang Lin is a Professor of
Department of Computer Science and Information Engineering and the Director of Library and Information Center in National University of Kaohsiung. He received his B. S. and M. S. both in Computer Science and Information Engineering from National Chiao-Tung University in 1988 and 1990, respectively. He then received his Ph.D. in Computer Science and Information Engineering from National Taiwan University in 1994. Dr. Lin has published more than 30 journal publications and 80 conference publications in the area of data warehousing, data mining, evolutionary computation, sparse matrix technology and large-scale supercomputing. Dr. Lin is a member of IEEE, the Taiwanese AI Association and the Institute of Information and Computing Machinery.
Chuan-Chun Wu is an Associate
Professor in the Department of Information Management at I-Shou University, Kaohsiung, Taiwan. He received his MS in the Department of Technology at Minnesota State University, Mankato, USA and PhD in the Department of Industrial Technology from University of Northern Iowa, Cedar Falls, Iowa, USA. His research interests include knowledge management, supply chain management and technology management.