汽車客運業績效評估之研究-資料包絡分析法
184
0
0
全文
(2) 汽車客運業績效評估之研究-資料包絡分析法 Evaluating Bus Transit Performance-A Data Envelopment Analysis Approach. 研 究 生: 范植谷. Student: Chih-Ku Fan. 指導教授: 卓訓榮. Advisor: Hsun-Jung Cho. 國 立 交 通 大 學 運輸科技與管理學系 博士論文 A Dissertation Submitted to Department of Transportation Technology and Management College of Management National Chiao Tung University in Partial Fulfillment of the Requirements for the Degree of Doctor of Philosophy in Transportation Technology and Management June 2004 Hsinchu, Taiwan, Republic of China. 中華民國九十三年六月.
(3) 汽車客運業績效評估之研究-資料包絡分析法 學生:范植谷. 指導教授:卓訓榮. 國立交通大學運輸科技與管理系博士班 摘要 本論文首先應用資料包絡分析法中之拋物線圖形效率測量法及方向性產出距離函 數,來評量台灣汽車客運公司各車站在民營化前後利潤率及風險調整效率變化的情形, 研究結果顯示,民營化後利潤率的增加可歸因於技術效率與配置效率兩者均有進步所 致,惟配置效率因素所扮演的角色較為重要,而無論是公營的台汽公司或民營的國光公 司都有價格扭曲的現象發生,這可能是兩家公司都試圖涵蓋無效率所導致的損失所致; 其次,經整合意欲(好的)產出和非意欲(壞的)產出結果,發現台汽民營化後風險調 整效率有顯著改進,而此效率改進可能係導致其成本降低的主因。 其次,因多模式汽車客運公司係台灣地區客運業之特色,此種公司同時從事不同模 式(如長途客運和市區客運)的運輸服務,其特點為不同模式的服務雖使用不同的生產 技術,但卻使用某些共同的投入(如管理人員),因此本論文不僅考慮多模式客運公司 內部生產技術之差異,也將運輸服務的不可儲藏性(或稱產銷同時性)涵蓋在內,以便 同時測量多模式客運公司的成本效率,服務效果與成本效果;由本論文所應用之多活動 資料包絡分析模式與網路包絡分析模式分別與傳統模式比較發現,無論就有效率(果) 的公司數,公司效率(果)排序與相互關聯效果等之評量結果顯示,兩種模式與傳統模 式間有顯著性差異,且前兩者較後者更為嚴謹。 本論文之主要貢獻可歸納如下: (一) 以往有關客運業配置效率及其相關問題之文獻甚為少見,本論文首度應用拋物 線圖形效率法來評量民營化前後利潤率變化問題,這項利潤率指標可被分解為 技術效率與配置效率,而配置效率則可進一步用來衡量價格扭曲的程度,此種. -i-.
(4) 配置效率不同於傳統方法之處,在於它可僅需藉由觀察收入與觀察成本,而無 需價格資訊即可予以衡量。 (二) 本論文首次提出將運輸風險定位為非意欲產出的觀念,應用方向性產出距離函 數,整合意欲(好的)產出與非意欲(壞的)產出,用來測量民營化對風險調 整效率所產生之衝擊,以有別於傳統客運業績效評估之研究,只著重在意欲產 出之重大缺陷上。 (三) 台灣地區客運業,尤其老客運公司,大多屬於所謂多模式汽車客運公司,同時 經營公路汽車客運及市區汽車客運,其特色為不同模式服務,係使用不同的生 產技術,但卻也使用某些共同的投入,因此,亟不宜如傳統方式將其視為一整 體,進行績效評比。本論文應用多模式資料包絡分析法,將共同投入合理配置 至不同模式,以求得個別模式之效率值,以提供整體及個別模式之經營績效評 比,以及公司內部決策之參考。 (四) 有別於傳統研究忽略運輸服務之不可儲藏性,而分開評量其三種效率(果)之 缺點,本論文不僅考慮多模式客運公司內部生產技術之差異,更進一步將運輸 服務的不可儲藏性(產銷同時性)涵蓋在內,並應用修正式網路包絡分析法模 式將生產與消費技術納入此一模式內,以便同時測量多模式客運公司之成本效 率、服務效果與成本效果,以資評比其績效差異。. - ii -.
(5) Evaluating Bus Transit Performance -A Data Envelopment Analysis Approach Chih-ku Fan. Advisor: Prof. Hsun-Jung Cho. Department of Transportation Technology and Management National Chiao Tung University. Abstract With the aim of capturing the essence of transit performance, this dissertation addresses four crucial but often neglected issues regarding efficiency measurement for bus transit industry, and thereby using a novel refinement of conventional DEA (Data Envelopment Analysis) models to deal with these issues, in order to shed new light on the facts relevant to transit performance. In contrast to these four issues, this dissertation consists of four essays, with particular reference to the transit performance measure in Taiwan. The first two essays pertain to the impact of privatization on bus firm’s efficiency and talk about to what extent the various efficiency changes before and after privatization. The first essay applies a hyperbolic graph efficiency approach to measure “return to the dollar” at the station-level of Taiwan Motor Transport Company (TMTC) over the pre- and post- privatization period. This measure is further decomposed into its technical and allocative efficiency components. Price distortions can be measured by allocative efficiency using data on observed costs and revenues without requiring explicit information on prices. The decomposition results indicate that both technical and allocative efficiencies contribute to the growth of “return to the dollar”, with the allocative component playing a more important role than the technical component. Perhaps in an attempt to cover the - iii -.
(6) inefficiency-induced losses, both the public and private firms apparently resort to distorting relative output prices with respect to input prices, and the distortion is more pronounced in the private firm than in the public firm. In the second essay, a directional output distance function which incorporates both desirable and undesirable outputs is employed to investigate the effects of privatization experienced by the TMTC. For the first time, the risk-adjusted efficiency change following privatization are estimated by treating transport risk as a joint but undesirable output. The empirical results demonstrate that TMTC’s privatization has produced a distinct improvement in efficiency enhancement and as such may be considered to be a source of cost reduction. The last two essays shift the focus from investigating the influence of privatization on the transit firm to the efficiency measurement of some transportation organizations which engage in various activities (services) simultaneously. This third essay focuses most attention on the technical aspect of how to determine the efficiency of individual services within different but highly homogeneous multimode transit firms which engage in their services with non-identical technologies and use shared inputs. The empirical findings indicate that the multiactivity model used is more demanding than the conventional DEA model. The fourth essay expands the analysis of the third essay to consider both the unstorable characteristics of transportation service and the technological differences within multimode transit firms. The proposed network DEA model allows a representation of both production and consumption technologies in a unified framework and thereby can be used to simultaneously estimate the cost efficiency, the service effectiveness and the cost effectiveness of multimode transit firms. The results obtained from the network model compared to those of a conventional model are quite different in terms of the number of efficient or effective units, rank comparisons of DMUs performance as well as inter-related effects. Throughout the dissertation, the non-parametric technique, also known as DEA, is used as the common approach which integrates the four essays into a dissertation. - iv -.
(7) Acknowledgements It has been nearly nine years since professor Hsin-Li Chang asked me if I was interested in participating in the part-time degree program in this department. My dissertation’s origin can be traced to this unforgetable and thankful moment. I would like to express my sincerest thanks and gratitude to my adviser, professor Hsun-Jung Cho, for the generous sharing of his time, advice, wisdom and encouragement during the conceptualization and completion of this dissertation. Special thanks are due to Professor Shih-Hsun Hsu for his enthusiastic support and encouragement. His knowledgeable explanations of various data envelopment analysis models were invaluable. The author expresses his personal gratitude to Dr. Ming-Miin Yu who believes in this efficiency research and made it possible. His thoughtful suggestions were a sustaining force for me through the many critical issues confronted while reviewing the drafts of this dissertation. I would like to gratefully acknowledge my dissertation committee: Professors Wu-Cheng Chen, Hsin-Li Chang, Shih-Hsun Hsu, Heuy-Kuo Chen. Their beneficial influence, valuable suggestions and helpful discussions are reflected in various parts of this dissertation. Special thanks to Professor Wu-Cheng Chen, once a senior official of mine. Without his permission and encouragement, I wouldn’t be able to keep on my doctoral program. I was also indebted to the faculty and staff of this department who shared their knowledge, their professional experience and their values with the author. I also appreciate the supportive deeds and words of encouragement given by Dr. Shih-Ching Lo who has been there through the good times and helped to make the rough times bearable, and for this I will always be thankful. The TMTC’s privatization program offers a unique opportunity to analyze the effects on the performance of its kind. Special thanks go to former Minister of Transportation and Communications (incumbent Vice Premier of Cabinet), Chu-Lan Ye, and the incumbent Vice -v-.
(8) Minister, Chia-Juch Chang. Without their strong leadership, great decision-making and determined support, I , as the Chairman of Board of the Directors of TMTC, wouldn’t be able to accomplish the extremely difficult task of the well-known TMTC’s privatization with my outstanding colleagues in July, 2001. I would like to thank my wonderful and supportive family. My sincere thanks go to Yuan-Jin (Jennifer), my wife and faithful companion, for her love, inspiration and unconditional support. She has been a prime motivation in my academic pursuit: without a secure home base and strong foundation, none of this would have been imaginable. I am thankful to my lovely daughters, Ming-huei (Tina) and Sui-huei (Christina), who patiently adjusted to my long working hours, for allowing their father to work during late night, weekends and holidays, for continually asking when would I finish. My sincere gratitude goes to my dear mother, mother-in-law, sister, and brothers for their continuous encouragement during the many years of my education. I am happy to share the delight of my family that finally it has been done. Finally, I like to dedicate this work to my late father, no words could fully express my everlasting love, respect and sorrow to him.. - vi -.
(9) Contents 摘要 .............................................................................................................................................i Abstract......................................................................................................................................iii Acknowledgements ....................................................................................................................v Contents ....................................................................................................................................vii List of Tables .............................................................................................................................xi List of Figures...........................................................................................................................xii APPENDIX Glossary of Symbols...........................................................................................xiii CHAPTER 1. Introduction .......................................................................................................1. 1.1. Motivation and problem statement ....................................................................2. 1.2. Research objectives ...........................................................................................8. 1.3. Study approach ..................................................................................................9. 1.4. Framework of the dissertation ......................................................................... 11. CHAPTER 2. An Overview of Taiwanese Bus Transit Sector...............................................14. 2.1. Deregulation feature ........................................................................................14. 2.2. Changes to the structure of the bus service industry .......................................15. 2.3. Market shares by ownership types of highway bus operator...........................16. 2.4. Privatization of the Taiwan Motor Transport Company ..................................17. CHAPTER 3 3.1. Literature Review ............................................................................................21 Frontier studies of transit systems ...................................................................21. 3.1.1. Non-parametric approach ................................................................................21. 3.1.2. Parametric approach ........................................................................................29. 3.1.3. Frontier studies in Taiwan................................................................................33. 3.1.4. Input and output measures in transit................................................................37. 3.2. Related studies of transit performance ............................................................40 - vii -.
(10) 3.3. Related studies of transit privatization ............................................................42. 3.4. Limitations of previous research .....................................................................45. CHAPTER 4. The Basic Data Envelopment Analysis (DEA) Model....................................46. 4.1. Efficiency and productivity .............................................................................46. 4.2. Frontier methodologies....................................................................................49. 4.3. Relative merits and drawbacks of the methods ...............................................51. 4.4. Distance functions ...........................................................................................53. 4.4.1 4.5 4.5.1 4.6. Input and output distance functions.................................................................53 Efficiency measurement concepts ...................................................................55 Input-oriented and output-oriented measures ..................................................55 Basic concept of DEA method ........................................................................57. 4.6.1. The constant returns to scale (CRS) DEA model ............................................58. 4.6.2. The variable returns to scale (VRS) and scale efficiencies .............................60. 4.6.3. Price information and allocative efficiency .....................................................62. 4.7 CHAPTER 5. Environmental factors in DEA analysis ..........................................................65 The Case Study 1 ─ The Effects of Privatization on Return to the Dollar: A Case Study on Technical Efficiency and Price Distortions of Taiwan’s Intercity Bus Services...............................................................................67. 5.1. Introduction .....................................................................................................67. 5.2. Model formulation...........................................................................................70. 5.2.1. The hyperbolic graph measure.........................................................................70. 5.2.2. “Return to the dollar” and the hyperbolic graph measure ...............................72. 5.3. The data ...........................................................................................................75. 5.4. Results and discussions ...................................................................................78. 5.5. Conclusions .....................................................................................................84 - viii -.
(11) CHAPTER 6. The Case Study 2 ─ Measuring the Risk-Adjusted Efficiency of Taiwan Motor Transport Company Before and After Privatization .................................................86. 6.1. Introduction .....................................................................................................86. 6.2. Model formulation...........................................................................................87. 6.3. The data ...........................................................................................................89. 6.4. Results and discussions ...................................................................................91. 6.5. Conclusions .....................................................................................................93. CHAPTER 7. The Case Study 3 ─ The Joint Determination of Efficiency in Multi-Mode Bus Transit .........95. 7.1. Introduction .....................................................................................................95. 7.2. Model formulation...........................................................................................98. 7.3. The data .........................................................................................................100. 7.4. Results and discussions .................................................................................103. 7.5. Conclusions ...................................................................................................106. CHAPTER 8. The Case Study 4 ─ Measuring the Performance of Multimode Bus Transit: A Network DEA Model ..........................................................................107. 8.1. Introduction ...................................................................................................107. 8.2. The framework of performance evaluation ...................................................109. 8.3. Model formulation......................................................................................... 112. 8.3.1. Network production possibility set ................................................................ 113. 8.3.2. Directional distance function ......................................................................... 118. 8.4. The data .........................................................................................................125. 8.5. Results and discussions .................................................................................131. 8.6. Conclusions ...................................................................................................139 - ix -.
(12) CHAPTER 9. Summary and Policy Implications ................................................................141. 9.1. Contributions to the literature........................................................................141. 9.2. Summary........................................................................................................143. 9.3. Policy implications of the dissertation ..........................................................147. 9.4. Area for further research................................................................................151. REFERENCES .......................................................................................................................152 Vita(簡歷)..........................................................................................................................163 Publication Lists .....................................................................................................................164. -x-.
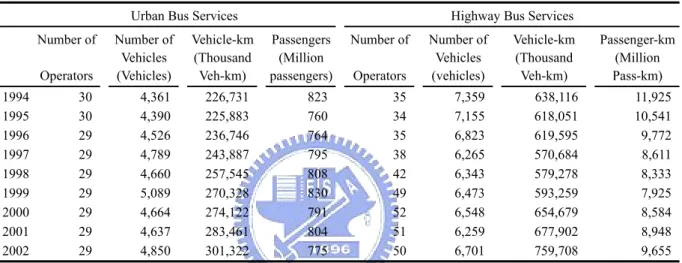
(13) List of Tables Table 2.1 Changes in Number of Operators and Vehicles, Vehicle-kilometer and Passenger-kilometer by Type of Operator in Taiwan ............................................16 Table 2.2 Market Shares by Owership types of Highway Bus Operator in Taiwan ..............17 Table 3.1 Classification of the Reviewed Literature .............................................................37 Table 4.1 Taxonomy of Frontier Methodologies ...................................................................50 Table 4.2 Comparison between DEA and SFA Approaches ..................................................52 Table 5.1 Data Summary for TMTC and GGBC by Station Type.........................................77 Table 5.2 Decomposition of “Return to Dollar”....................................................................79 Table 5.3 Decomposition of “Return to Dollar” by station type ...........................................81 Table 6.1 Data Summary for TMTC and GGBC Station ......................................................91 Table 6.2 Comparison of Directional Distance Function and Standard DEA Model to Estimate Efficiencies of the TMTC before and after Privatization.......................92 Table 7.1 Variables and Descriptive Statistics.....................................................................102 Table 7.2 Comparison of the CCR and Multiactivity Models’ Efficiency Scores...............103 Table 7.3 Efficiency Scores of the Mutiactivity DEA Model..............................................105 Table 8.1. Inputs and Outputs Measures Used in the Model................................................129. Table 8.2 Variables and Descriptive Statistics.....................................................................130 Table 8.3 Efficiency or Effectiveness Scores of the Network Model..................................132 Table 8.4 Descriptive Statistics of the Conventional and Network Models’ Performance Scores and the Results of Test of Significance....................................................134 Table 8.5 Comparison of the Conventional and Network Models' Performance Scores ....136. - xi -.
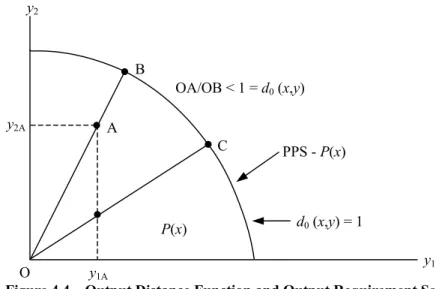
(14) List of Figures Figure 3.1 Framework for Transit Performance Concepts ....................................................41 Figure 4.1 Production Frontiers and Technical Efficiency ....................................................47 Figure 4.2 Productivity, Technical Efficiency, Technical change and Scale Economies ......48 Figure 4.3 Input Distance Function and Input Requirement Set ...........................................54 Figure 4.4 Output Distance Function and Output Requirement Set......................................54 Figure 4.5 Input-oriented Technical and Allocative Efficiencies ..........................................56 Figure 4.6 Output-oriented Technical and Allocative Efficiencies........................................56 Figure 5.1 Comparison of Hyperbolic, Input, and Output Measures of Technical Efficiency .............................................................................................................72 Figure 5.2 TR/TC rating versus number of vehicles (KKTC, 2002).....................................83 Figure 5.3 Technical efficiency rating versus number of vehicles (KKTC, 2002)................83 Figure 5.4 Allocative efficiency rating versus number of vehicles (KKTC, 2002) ..............83 Figure 6.1 Directional Distance Function for Desirable and Undesirable Output Performance .........................................................................................................88 Figure 7.1 Performance dimensions of Multi-mode Transit System.....................................98 Figure 8.1 Framework for Transit Performance Concepts ..................................................109 Figure 8.2 Framework of Transit Firm Performance........................................................... 111 Figure 8.3 Performance Dimensions of Multi-mode Transit System.................................. 115. - xii -.
(15) APPENDIX Glossary of Symbols 1. Chapter 4 Notations: x. : input vector. y. : output vector. (x, y ). : input-output vector. S. : production possibility (or technology) set. di. : input distance function. d0. : output distance function. L( y ). : input set. P(x ). : output set. X. : input matrix. Y. : output matrix. N. : number of firms (DMUs). K. : number of inputs. M. : number of outputs. u. : vector of output weights. v. : vector of input weights. ρ. : value of output distance function. δ. : value of input distance function. z. : intensity vector. θ. : efficiency score of input-orientation. φ. : efficiency score of output-orientation. - xiii -.
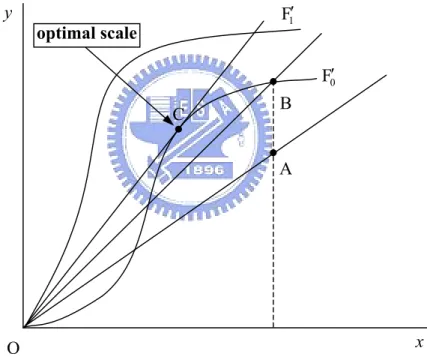
(16) λ. : vector of constants. wi. : vector of input price. xi. *. : cost-minimizing vector of input quantities. yi. : output level. pi. : vector of output price. yi. *. xi. : revenue-maximizing vector of output quantities : input level. 2. Chapter 5 Notations: T. : graph reference set. Fg. : hyperbolic graph measure. Fi. : Farrell measure of input technical efficiency. Fo. : Farrell measure of output technical efficiency. λ. : proportional (or scaling or contraction) factor corresponding to the level of efficiency. x. : input vector. y. : output vector. ws. : input price. ps. : output price. Og. : overall efficiency. Ag. : allocative efficiency. π. : profit. π*. : maximum feasible profit. - xiv -.
(17) p. : short-run output price. pˆ. : long-run output price. w. : short-run input price. wˆ. : long-run input price. k′. : station (DMU). k. : number of stations (DMUs). P. : number of environmental variables. N. : number of inputs. M. : number of outputs. Z. : intensity variable. e. : environmental variable. 3. Chapter 6 Notations:. X. : input vector. U. : output vector. P( X ). : output set. y. : good(s). b. : bad(s). D0. : directional output distance function. 4. Chapter 7 Notations: x. : input vector. y. : output vector. p( x). : output set - xv -.
(18) M. : number of inputs associated soly with HB. Q. : number of outputs associated soly with HB. R. : number of outputs associated soly with UB. α. : positive constant associated with the HB or UB production process. θ. : efficiency score. w. : priority given to HB or UB. Superscripts: H. : input associated with highway bus service (HB). U. : input associated with urban bus service (UB). S. : input associated in part with HB and in part with UB. E. : environmental factors. Subscripts: d. : driver. v. : vehicle. f. : fuel. l. : network length. t. : mechanics. k. : firm (DMU). z. : long-haul transportation demand. s. : short-haul transportation demand. - xvi -.
(19) 5. Chapter 8 Notations:. X. : input vector. Y. : output vector. x. : shared input. u. : the proportion of the shared inputs assigned to each service. αd. : the proportion of the shared inputs assigned to each service or consumption process. n. : number of firms (DMUs). A. : production possibility set. P( y ). : input set. P(x ). : output set. λ. : intensity vector. θ. : efficiency score. w. : the priority given to the two service and processes. v D. : general form of directional distance function. Superscripts: PH. : input soly associated with HB. PU. : input soly associated with UB. PC. : inputs contribute to both HB and UB. C. : inputs soly associated with the consumption process. PCC. : inputs contribute to HB, UB and consumption process. E. : environmental factor. - xvii -.
(20) Subscripts: k. : firm (DMU). d. : driver. f. : fuel. v. : vehicle. l. : network length. t. : technical (mechanics). c. : car ownership. p. : population density. s. : sale staff. m. : management labor. h. : veh-kms or pass-kms. u. : frequencies of service or passengers. a , b, c , d , e. : input items. f ⋅g. : intermediate output items. z, o. : final output items. - xviii -.
(21) CHAPTER 1 Introduction This dissertation is composed of four essays which deal with four crucial but often neglected issues concerning transit performance, with particular reference to Taiwanese bus transit industry. The first two essays pertain to the impact of privatization on bus firm’s efficiency and talk about to what extent the various efficiencies or effcetivenesses change before and after privatization. The first essay measure the “return to the dollar” (profitability, profit margin), technical efficiency (TE) and allocative efficiency (AE), and thereby estimating price distortions at the station-level of Taiwan Motor Transport Company (TMTC) over the pre- and post- privatization period, so as to explore the effects of privatization on the transit firm. In the second essay, both desirable and undesirable outputs are incorporated in the model to investigate the effects of privatization experienced by a transit firm. For the first time, the risk-adjusted efficiency changes following privatization is estimated by treating transport risk as a joint but undesirable output. The last two essays shift the focus from investigating the influence of privatization on the transit firm to the efficiency measurement of some transportation organizations which engage in various activities (services) simultaneously, such as multimode bus transit. The third essay focuse on the technical aspect of how to determine the efficiency of individual services within different but highly homogeneous multimode transit firms which engage in their services with non-identical technologies and use shared inputs. The fourth essay expands the analysis of the third essay to consider both the unstorable characteristics of transportation service and the technological differences within multimode transit firms in efficiency and effectiveness measurement. The proposed DEA model differs. -1-.
(22) from conventional models in two respects: First, the consumed services occurring concurrently with the produced services are explicitly taken into account, and second, the model allows a representation of both production and consumption technologies in a unified framework and thereby can be used to simultaneously estimate the cost efficiency, the service effectiveness and the cost effectiveness of multimode transit firms. This chapter gives an overview of the motivation and problem statement, research objectives and study approaches, as well as depicts the framework of this dissertation.. 1.1. Motivation and problem statement The 1996 new legislation concerning the partial deregulation of bus industry led to a. major structural change in the whole industry in Taiwan and provide a new framework for all bus operation (as will be seen below in Chapter 2). This dissertation intends to study the impacts of privatization and regulatory changes in the public transport industry, with special reference to efficiency and/or effectiveness measurement. On one hand, the TMTC’s privatization programme offers a unique opportunity to analyze the effects on the efficiency change of its kind. On the other hand, except a few cases, most of long established operators, so-called multimode transit firms, seem to have worked effectively and have still survived following deregulation. Therefore there is a requirement to examine carefully transit performance based on the concepts of efficiency and/or effectiveness. The study of TMTC's privatization is of particular interest in several respects. First, it is especially unfortunate that few frontier studies have focused on the effects of privatization and regulatory changes in the public transport industry (De Borger et al., 2002). Second, it has been the first privatization case through employee buy-out (EBO) since the beginning of Taiwanese government's privatization programs in 1989. The combination of the direct employee shareholding in buy-out and a sector where individual skills are important may be. -2-.
(23) expected to generate significant effects on performance (Wright et al., 1992). Third, TMTC has been facing long-term financial difficulties due mainly to its inefficiency since 1988. The most notable have focused on the after-effects of transferring to the private sector, that is, whether the newly privatized firm Kuo Kuang Motor Transport Company (KKTC) is capable of improving this situation or is quickly driven out of market. Fourth, the economic literature that deals with the existence of employee-owned firms has paid little attention to EBOs (Bonnie and Putterman, 1987; Bonnie et al., 1993). And lastly, as an important case study, the comparison of TMTC's performance before and after privatization provides new empirical evidence and theoretical extension on the property right theory, focusing upon the privatization of the Taiwanese bus industry. Therefore, the TMTC’s privatization program offers a unique opportunity to analyze the effects on the performance of its kind. On the other hand, despite the transit sector has been experiencing declining ridership in the early 1990s, bus transit remains an important mode in Taiwan. Bus transit systems are, therefore, increasingly under pressure to improve their performance, both from the point of view of technical and allocative efficiencies as they yield complementary information about the management effectiveness of an individual bus firm. Technical efficiency has a diagnostic purpose as it yields comparative information about the effectiveness with which individual units convert their input resource into outputs. On the other hand, allocative efficiency has a planning orientation since the objective of assessment is to gauge efficiency improvements by means of resource reallocation. However, most of the extant literature on performance measurement for transit firms restrict their analyses to the use of technical efficiency (see e.g., Gathon 1989; Chang and Kao 1992; Fazioli et al. 1993; Obeng, 1994; Bhattacharyya et al. 1995; Sakano et al. 1997; Costa 1998; Lijesen 1998; Cowie and Asenove 1999; Kerstens 1999; Nolan et al. 2002; Odeck 2003; Karlaftis 2004). The reasons for studying technical efficiency stem from several factors. Allocative efficiency calculation requires input prices (Lovell, 1993). The data needed for this -3-.
(24) calculation were not readily available. Allocative efficiency assumes that firms are cost minimizing (Viton, 1995). This assumption may not be valid for the urban transit industry. As indicated by some literature, transit firms have a variety of goals, including but not limited to cost minimization. The second reason for choosing technical efficiency is that it provides some insight into underlying research issues such as how economies of scale and density of the urban center relate to transit efficiency. From efficiency scores one can judge whether a firm is using its inputs in the most productive way relative to the sampled firms (Labrecque, 1996). However, the lack of published research on combining technical efficiency and allocative efficiency measures of performance and thereby measuring further price distortions in the bus transit market places a limit on our understanding of production processes, or even market mechanism. In light of this, a novel approach leads to a derivation of an allocative efficiency index, which measures price distortions using data on observed costs and revenues without requiring explicit information on prices is clearly needed to deal with this problem, under the assumption of cost minimization. As indicated by Tomazinis (1975), one of the major problem in productivity studies of a social system (such as a transportation system) is based on the handling of undesirable (bad) outputs of the process. All desirable (good) inputs can be added of course, either as physical units or on the basis of their market prices. Undesirable outputs, however, are negative by-products with no market value. If such undesirable by-products are left alone (not sold and not requiring any cost for their disposal), as has been the case for air pollution for many years, the undesirable outputs do not enter any productivity analysis of the production process. In case special costs are required for the treatment or disposal of such undesirable by-products, their cost should enter somewhere in the productivity analysis. From many points of view the most effective treatment of this issue would be to include the additional costs as part of the production process of the desirable output itself. In other -4-.
(25) words, when evaluating the performance of producers it makes sense to credit them for their provision of desirable outputs and penalize them for their provision of undesirable outputs. That is to say, “goods” and “bads” should be treated asymmetrically in gauging producer performance. In fact, most currently available performance measures do treat the two asymmetrically, by valuing goods and ignoring bads (Fare et al. 1989). On the other hand, due to the development of frontier methods for the study of efficiency there is a large strain of literature on the efficiency of bus transportation. Moreover, a comprehensive survey of frontier methodologies and empirical results for public transit has been presented by De Borger et al. (2002). Relevant performance indicators and the methods to measure them have been reviewed. The existing frontier studies measuring transit performance have also been systematically summarized and critically assessed (see e.g., Chang and Kao, 1992; Chu et al., 1992; Bhattacharyya et al., 1995; Viton, 1997; Cowie and Asenova, 1999; Nolan et al. 2002). Most of these previous research studies on measuring firms’ efficiency and productivity are typically conducted without taking into account undesirable outputs which may not be freely or costlessly disposable. Accidents of all kinds are an inescapable part of bus operations, however much one seeks to avoid them. Inevitably, they involve insurance procedures and very often the intervention of police; perhaps even court proceedings of one kind or another. The manager of a bus firm will have clear duties in the case of an accident within his area of responsibility (Hibbs, 1985). In other words, transportation safety has bee paramount issue, due mainly to producers (operators), consumers, and policy makers have paid increasing attention to the safety performance of bus transport. Operators no longer consider the transport risks as a secondary concern of the service produced. One component of the public debate on the competitiveness of transport services has focused on the role of transportation safety. In fact, the reputation for safety has been one of -5-.
(26) the key qualities of transportation that contribute to market segment. Such opportunities are regarded as a “win-win” situation, because business and social goals are both met. Many public policy efforts seek to identify and eliminate the production inefficiency that prevents simultaneous improvements in both efficiency and transportation safety. Whether these types of public policy initiatives are successful depends on the extent to which such inefficiencies are widespread in transport services, especially in intercity bus services. There is a requirement to measure the magnitude of these “double wins” opportunities where transport risks can be reduced with efficiency improved concurrently among a set of DMUs producing bus services. This may help both operators and policy makers to set up their targets to reduce the inefficiencies. Improved efficiency will, ceteris paribus, reduce cost, boost transit ridership, as well as reduce the need to subsidize the transit systems, and hence it has been widely held to be one of the principal objectives in most transportation organizations. In light of this, it is an appropriate way to measure and compare performance with peer groups, in particular reference to the efficient use of resources. Some transportation organizations engage in various activities (services) simultaneously; for example, an airline, railway, or marine company may simultaneously provide passenger, freight, and other services respectively. Another famous example could be a public transit company, which involves various transportation modes simultaneously. On the other hand, for a variety of applications to which DEA could be applied, there is often a shared resource (or cost) which is imposed on some (or all) decision making units (DMUs, refer to transit firms here). A problem then arises with respect to how this resource (or cost) can be assigned in an equitable or optimal way to the various DMUs. Few DEA studies relating to multimode transit agencies deal with the shared input problem in a proper way. For example, Viton (1997, 1998) analyzed the efficiency of U.S. multimode bus transit systems operating conventional -6-.
(27) motor-bus (MB) and demand-responsive (DR) services using DEA. However, the allocation problems of the system costs data appear to have been ignored. Clearly, the allocation problem of shared inputs need to be considered and dealt with properly, and thereby estimating the efficiency or effectiveness of transportation organizations that engage in several services simultaneously. DMUs in this situation may have some inputs and outputs among all the services, and in doing so, estimate the efficiency or effectiveness with a given organization carries out each activity. A wide variety of methods can be derived for measuring performance based on the concepts of efficiency and effectiveness. However, while evaluating transit performance it is worth noting that, unlike the production and consumption processes of the manufacturing sectors a transit service cannot be stored, and therefore the output consumed or the final output produced, such as passenger-kms may vary considerably from the output produced or the intermediate output, such as vehicle-kms, in a transit system. Specifically, the consumed services occur concurrently with the produced services, If the final output is not consumed simultaneously with the intermediate output, it is lost (Tomazinis, 1975). This perishability of the commodity produced, and the fact that only a proportion of the services produced are actually consumed is often neglected in transit performance measures (see for example, De Borger et al., 2002). If these unique unstorable characteristics of transit services are justified, then it is vitally important to obtain valid estimates of transit performance. These estimates must be obtained by combining the cost efficiency measure, service effectiveness measure and cost effectiveness measure into a single model, taking into account explicit modeling of produced services and consumed services inside the technology. In addition, as indicated by Beasley (2003), organizations of any complexity typically consist of a number of individually identifiable units. For example, within a transit firm these units may correspond to different transit services. Such units are linked at the company level in the way of allocating resources (such as management and sales staff) to individual units. -7-.
(28) The total amount of resources that the firm can allocate will be limited. This problem is plainly important in a number of transit firms. It is currently, for the most part, dealt with through a mixture of standard accounting approaches and negotiations between individual services and the organization, or even ignored (see Vition 1997,1998). To estimate the efficiency and effectiveness achieved by multimode transit firms with the two production functions using shared inputs, a specific model needs to be developed and incorporated into aforementioned single model, so as to solve these problems mentioned above.. 1.2. Research objectives Based on the motivation and problem statement mentioned in previous section and with. the aim of capturing the essence of transit performance, this dissertation has addressed four crucial but often neglected issues regarding efficiency measurement for bus transit industry, and thereby using a novel refinement of conventional DEA models to deal with these issues, in order to shed new light on the facts relevant to transit performance. Specifically, the following research objectives corresponding to four essays are presented in this dissertation, respectively. 1. Aside from describing the operating changes of the TMTC and the KKTC response to privatization which ultimately resulted in a profit change in the KKTC, the first essay seeks to identify two critical issue. First, whether or not technical efficiency improved following privatization? And second, to what extent price distortions were created in the transportation market under each ownership type before and after privatization? 2. To evaluate the after-effects of privatization on the KKTC’s performance, the second essay intends to employ a model which allows to consider both the desirable production output, “good”, and the undesirable production output, “bad”, and to. -8-.
(29) assess the level of production inefficiency that gives rise to opportunities in improving efficiency and overall performance simultaneously. In addition, transport risk will be treated as a joint but undesirable output while measuring the risk-adjusted efficiency. Ideally, this may help both operators and policy makers to set up their targets to reduce the inefficiency. 3. The third essay is to measure and compare performance of 24 multimode transit firms with peer groups, focusing most attention to how the shared input resources can be assigned in an equitable or optimal way to the various DMUs which engage in their services with non-identical technologies and use shared inputs. This will permit the operators to discover, understand and illuminated accurately the situation at any given moment and the reasons behind any overall system rating. 4. To fill a void in the literature, the fourth essay tries to propose a model that allows a representation of both production and consumption technologies in a unified framework, and hence can be used to simultaneously estimate the cost efficiency, service effectiveness and cost effectiveness of multimode transit firms which carry out their services with non-identical technologies using common inputs.. 1.3. Study approach To reach various aforementioned research objectives, the study approaches used in this. dissertation are specified as follows. Fare et al. (2002) establish the relations between hyperbolic graph measure of technical efficiency and the radial measures of technical efficiency and show the dual cost and revenue interpretation of the hyperbolic efficiency measure are related to Georgescu-Roegen’s (1951) notion of “ Return to the dollar”. Once this relation is established, it leads to a derivation of an allocative efficiency index, and thereby measuring the price distortions in the transportation market. -9-.
(30) The first essay is to apply a hyperbolic graph efficiency approach to measure “return to the dollar” at the station-level of TMTC before and after privatization. The “return to the dollar” measure is decomposed into two components: a technical efficiency index and an allocative efficiency index. Moreover, price distortions are measured by allocative efficiency which uses data on observed costs and revenues without requiring explicit information on prices. A directional distance function which incorporates both desirable and undesirable outputs is employed in the second essay to investigate the impact of privatization experienced by the TMTC. For the first time, transport risk is treated as a joint but undesirable output to measure efficiency changes following privatization. More specifically, the directional distance function allows for considering both the desirable production output, “goods”, and the undesirable production output, “bads”, so as to measure the linkage between “goods” and “bads” and to assess the level of production inefficiency and overall risk-adjusted efficiency simultaneously. Following Fare et al. (1998), the current study defines measures that allow desirable and undesirable production to vary by the same proportion, but desirable outputs are proportionally increased while undesirable ones are simultaneously decreased. The essence of the method is to compute the opportunity cost of transforming the production process from one where all outputs are strongly disposable to one which is characterized by a weak disposability of undesirable outputs. A number of studies have been presented recently, both from a practical organizational standpoint and from a costs research perspective, to deal with the shared inputs problem (see for example, Golany,1993; Golany and Tamir, 1995; Beasley, 1995, 2003; Mar Molinero, 1996; Thanassoulis, 1996, 1998; Fare et al, 1997; Fare and Grosskopf, 2002; Mar Molinero and Tsai, 1997; Tsai and Mar Molinero, 1998, 2002). Among them, the multiactivity DEA model, a novel refinement of the conventional DEA approaches, for the joint determination of efficiencies in the DEA context, was proposed by Beasley (1995) and subsequently revised by - 10 -.
(31) Mar Molinero (1996). Tasi and Mar Molinero (1998, 2002) evaluated efficiencies of organizations that engage in several activities simultaneously. DMUs in this situation may have some inputs and outputs among all the activities, and in doing so, estimate the efficiency with which a given organization carries out each activity. In the third essay of the dissertation, the multiactivity DEA model is applied to explore the efficiency of individual services within different but highly homogeneous multimode transit firms in Taiwan, due to its being designed, in particular, to estimate the efficiency achieved by organizations which face several production functions using shared inputs. Following Fare and Grosskopf (1996, 2002), the fourth essay presents an approach to include both the unstorable characteristics of transportation service and the technological differences within multimode transit firms in efficiency and effectiveness measurement. The proposed network DEA model differs from conventional models in two respects: First, the consumed services occurring concurrently with the produced services are explicitly taken into account, and second, the network model allows a representation of both production and consumption technologies in a unified framework and hence can be used to simultaneously esitimate the cost efficiency, the service effectiveness and the cost effectiveness of multimode transit firms which carry out their services with non-identical technologies and use shared inputs. The proposed network DEA model is applied to production and consumption data for a sample of multimode bus transit firms in Taiwan. Of the 60 bus companies in Taiwan, 24 of them operated both highway bus services (HB) and urban bus services (UB) in 2001.. 1.4. Framework of the dissertation The rest of the dissertation will be organized as follows: Chapter 2 will introduce a brief background of Taiwanese bus transit sector. In section. 2.1, the deregulation feature in Taiwan will be presented. Changes to the structure of the bus - 11 -.
(32) industry after deregulation will be addressed in section 2.2. Market shares by ownership types of highway bus operator will be discussed in section 2.3. Section 2.4 will report the privatization of Taiwan Motor Transport Company. Chapter 3 will review relevant literature in four respects: First, frontier studies of transit systems, these include those use either parametric approach (mainly stochastic frontier approach, SFA) or non-parametric approach (mainly DEA) or both, respectively. Frontier studies in Taiwan will also be briefly reviewed in contrast to the current study. Then, the wide variability in the use of input and output measures in transit will be presented. Second, related studies concerning transit performance which are applied in this study will be introduced. Third, related studies of transit privatization will be outlined. And lastly, limitations of previous study will be discussed. Chapter 4 will introduce the basic DEA model as a starting-point for the methodologies used in this dissertation. The introduction will center on comparing the DEA with SFA, both have been used widely in the measurement and estimation of efficiency. The chapter will present comparison results which led to the methodological choice of this study, the DEA approach. And this will be followed by a series of discussions concerning the concepts of basic DEA model, including distance function, efficiency measurement, technical efficiency and allocative efficiency, as well as environmental variables used in DEA analysis. Case studies will be provided in each of Chapters 5 to 8 to illustrate the application of both the applied and proposed models and to demononstrate these model’s effectiveness. Chapter 5 will use hyperbolic graph efficiency approach to measure “return to the dollar” before and after TMTC’s privatization. The “return to the dollar” will be further decomposed into a technical efficiency index and an allocative efficiency index, and thereby estimating price distortions in the transportation market. Chapter 6 employs a directional distance function which incorporates both desirable and undesirable outputs to investigate the effects of privatization experienced by the TMTC. By - 12 -.
(33) treating transport risk as a joint but undesirable output, the overall risk-adjusted efficiency changes following privatization will be estimated. Chapter 7 will focus most attention on the technical aspect of how to determine the efficiency of individual services within different but highly homogeneous multimode transit firms which engage in their services with non-identical technologies and use shared inputs. Chapter 8 will expand the analysis of the last case to consider both the unstorable characteristics of transportation service and the technological differences within multimode transit firms in efficiency and effectiveness measurement. The proposed network DEA model will demonstrate its being more demanding than the conventional DEA model. The last chapter (Chapter 9) will outline the contribution to the literature, summary, policy implications of the dissertation, as well as area for further research.. - 13 -.
(34) CHAPTER 2 An Overview of Taiwanese Bus Transit Sector The 1996 new legislation concerning the partial deregulation of bus industry re-organized the whole industry in Taiwan and provided a new framework for all bus operations. It symbolized the most radial change given that it represented a departure from a status quo of nearly 50 years standing. This chapter intends to report briefly deregulation feature first, followed by the new structure of the bus industry, and an overview of privatization of the Taiwan Motor Transport Company.. 2.1. Deregulation feature The term “regulation” concerning bus industry in Taiwan covers a number of aspects. which are almost the same as those in Great Britain prior to 1980. This first is entry and exit control, an operator is not at liberty to enter (or leave) the bus market at will. According to the Road Traffic Act 1984, a road service licence ratified by the relevant area licensing authority, such as the traffic commissioners, is required for a new entrant to enter the market to operate new services. The Act also contains an obligation upon operators to report the authority of the intention to cease operation in advance. The incumbent operator was not allowed to leave the market without the permission of the relevant authority due to “public benefits”. Another form of regulation is that of routing licensing system which imposed a limitation that every single route was generally operated by only a single operator, except that the existing operator couldn’t afford to offer sufficient services to satisfy passengers’ need. An operator would be awarded the public passenger transportation franchise for a period of 30 years, after a routing licence was issued by the authority.. - 14 -.
(35) A third form of regulation is that of price, that is, the authority specified periodically a detailed fare scale to be followed by operators. The fourth is equipments and level of service controls, in which the physical supply of a service was controlled. This could take the form of directly limiting the size or number of vehicles operated, or more often specifying the route and timetable to be operated. The primary aim of the new legislation, which came into effect in 1996, was to minimize government involvement by reducing the level of regulation. This 1996 new legislation removed some regulations which had applied to highway bus services, involving intercity bus services and local bus services. The most important feature regarding the operation of a newly defined highway bus services was the increasing freedom of entry into the industry, and into the partially-deregulated sectors in particular. At the same time, the granted public passenger transportation franchise was shorten for a period of five years. However, this was not so in the case of urban bus services. Price control has also been removed from specifying a fare range to only limiting the maximum fare charged. A significant range of quality control covering aspects such as the design, safety and fitness of vehicles, and licensing of drivers, however, has been retained and strengthened, especially with regard to adequacy of maintenance following partial deregulation.. 2.2. Changes to the structure of the bus service industry The 1996 new legislation of partial deregulation made two specific changes in the. structure of the bus service industry: 1. The abolition of the limitation that every single route was operated by a single operator allowed new private operators to enter the market. 2. The break-up of the Taiwan Motor Transport Company (TMTC). This company was to be privatized by 2001.. - 15 -.
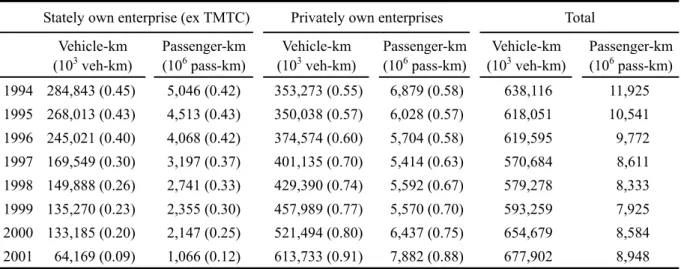
(36) Changes in number of operators, number of vehicles, vehicle-kilometer and passenger-kilometer by type of operators, i.e. urban bus services and highway bus services, between 1994 and 2002 are shown in Table 2.1. The number of urban bus operators remained constant due to the regulation policy. Regardless both the number of vehicles and vehicle-km increased, ridership fluctuated over the period. This may imply that the use made of resources in the attainment of outputs was neither efficient nor effective. Table 2.1 Changes in Number of Operators and Vehicles, Vehicle-kilometer and Passenger-kilometer by Type of Operator in Taiwan Urban Bus Services Number of. 1994 1995 1996 1997 1998 1999 2000 2001 2002. Operators. Number of Vehicles (Vehicles). 30 30 29 29 29 29 29 29 29. 4,361 4,390 4,526 4,789 4,660 5,089 4,664 4,637 4,850. Vehicle-km (Thousand Veh-km). Highway Bus Services Passengers (Million passengers). 226,731 225,883 236,746 243,887 257,545 270,328 274,122 283,461 301,322. Operators. Number of Vehicles (vehicles). Vehicle-km (Thousand Veh-km). Passenger-km (Million Pass-km). 35 34 35 38 42 49 52 51 50. 7,359 7,155 6,823 6,265 6,343 6,473 6,548 6,259 6,701. 638,116 618,051 619,595 570,684 579,278 593,259 654,679 677,902 759,708. 11,925 10,541 9,772 8,611 8,333 7,925 8,584 8,948 9,655. Number of. 823 760 764 795 808 830 791 804 775. Source: Statistical yearbook of Ministry of Transportation and Communications (MOTC) for 2003.. The number of companies operating highway bus services show a small increase at deregulation, followed by a peak, then sustained. Except in 2001, the number of vehicles had adversely increased followed deregulation, despite the decreasing trends of the number of vehicles were already in place before deregulation. Highway bus vehicle kilometers increased by 33% over the period 1997 to 2002, passenger kilometers also increased by 12% during the same period.. 2.3. Market shares by ownership types of highway bus operator The proportion of vehicle kilometer operated by different categories of enterprise, i.e.,. privately own enterprise (POE) and stately own enterprise (SOE), between 1994 and 2001 is shown in Table 2.2 for Taiwan as a whole. - 16 -.
(37) Table 2.2 Market Shares by Owership types of Highway Bus Operator in Taiwan Stately own enterprise (ex TMTC) Vehicle-km (103 veh-km). Privately own enterprises. Total. Passenger-km (106 pass-km). Vehicle-km (103 veh-km). Passenger-km (106 pass-km). Vehicle-km (103 veh-km). Passenger-km (106 pass-km). 1994 284,843 (0.45). 5,046 (0.42). 353,273 (0.55). 6,879 (0.58). 638,116. 11,925. 1995 268,013 (0.43). 4,513 (0.43). 350,038 (0.57). 6,028 (0.57). 618,051. 10,541. 1996 245,021 (0.40). 4,068 (0.42). 374,574 (0.60). 5,704 (0.58). 619,595. 9,772. 1997 169,549 (0.30). 3,197 (0.37). 401,135 (0.70). 5,414 (0.63). 570,684. 8,611. 1998 149,888 (0.26). 2,741 (0.33). 429,390 (0.74). 5,592 (0.67). 579,278. 8,333. 1999 135,270 (0.23). 2,355 (0.30). 457,989 (0.77). 5,570 (0.70). 593,259. 7,925. 2000 133,185 (0.20). 2,147 (0.25). 521,494 (0.80). 6,437 (0.75). 654,679. 8,584. 2001. 1,066 (0.12). 613,733 (0.91). 7,882 (0.88). 677,902. 8,948. 64,169 (0.09). Source: (1) Statistical yearbook of Ministry of Transportation and Communications (MOTC) for 2001. (2) Statistical yearbook of Highway Bureau, MOTC for 2001. Note:. (1) TMTC was privatized in July 2001. (2) The figure in parenthesis represents the percentage of the corresponding vehicle kilometers or passenger kilometers.. The structure of the industry has undergone fundamental change since deregulation, perhaps the most striking point from Table 2.2 is that the significant expansion of the POEs. Specifically, the proportion of kilometer operated by this sector has risen nearly one-third compared with the immediate post-deregulation period (between 1997 to 2000). The SOE, on the contrary, has gone to opposite extremes and lost lots of its share. The POEs have experienced a 46% increase in passenger kilometers since deregulation, but the SOE, by contrast, has suffered a 33% decrease over the same period.. 2.4. Privatization of the Taiwan Motor Transport Company The TMTC was set up in 1980, since then, the Taiwanese intercity bus services have. been provided by the nationwide TMTC in monopoly. However, a long-term trend decline about 10% per annum in intercity passenger journeys from 1980s has been seen, mainly due to the increasing use of private cars and illegal bus services following the opening of the first national highway in 1979. Subsequently, during 1990s, both endogeneous and exogeneous factors led to a major structural change in the Taiwanese intercity bus industry. Several. - 17 -.
(38) influences occurred within TMTC itself. First, public management was exceeding inefficient. Under the operations of TMTC's 50 subsidiaries (stations) in 1990, there were 105 national highway lines and 102 provincial highway lines with a total of 3,070 vehicles. The number of TMTC employees was 13,000 by 1990. The number of employees per vehicle was more than four, approximately double the average of privately owned local bus operators. Secondly, the TMTC's quality of service severely deteriorated. Its fleet, where more than half the number of vehicles were more than 10 years old, was the least-maintained part of the system. Complaints about its poor services began to increase. Part of its operational inefficiency should attribute to both TMTC's management and its employees, and the rest of it was directly caused by governmental and politicians’ intervention in controlling the transportation industry. For example, without governmental approval (usually time consuming), TMTC could not determine its budget, fare, staff salaries and authority for new services (such as renew rolling stock). In addition, it was always required to serve cost-inefficient social goals and operate unprofitable lines. These aforementioned factors, not only combined to either increase the cost or reduce the productive efficiency but also resulted in a deficit of a million U.S. dollars accumulated in 1999. TMTC was unable to pay the debt service of its bonds and became a grant and subsidy soaking company, which allowed it to be relatively more irresponsible and inefficient. Besides these pressures mentioned above for TMTC's privatization, there were three major exogeneous factors from the government's decision-making. First, intercity bus service provision within Taiwan has undergone fundamental change over the last decade, moving from a publicly owned and heavily regulated industry to a privately owned and partially deregulated market. Specifically, the intercity bus was still subject to quality control and price cap regulation because of its fare; however, restriction of entry was removed to a great extent. The first POE was allowed to enter the national highway bus market running on 26 lines in 1990 and was able to provide alternative intercity service other than TMTC. Following the - 18 -.
(39) partial deregulation of bus industry in 1995, many POEs successively set up entirely new services but almost parallel to the national highway lines, altogether 22 POEs with 32 lines, with those of TMTC's by 1999. TMTC continued to operate, lacking innovation in competition with these increasing new entrants, eroding its revenues, and making achievement out of sound financial condition impossible. Secondly, in respond to a request from the government, TMTC began to implement an organization reform, mainly to both downsize its personnel and pass (to POEs) or close its less-attractive lines to reduce its increasing cost from 1995. However, the deficit was still increasing until 1998. The then government decided to privatize TMTC by 2001. Thirdly, in 2000, there was political enthusiasm for proceeding to reform public organizations under the newly-elected DPP (Democratic Progressive Party) government. Excessive cost due to inefficient management and thus suffering the problems of long-period loss making was another driving force for reexamining the performance of the TMTC. And lastly, the TMTC's financial crisis on the verge of bankrupt at the end of 1999 served as a further impetus for accelerating the privatization of TMTC. All these factors led to the TMTC's privatization. The privatization has produced major structural changes in the intercity bus industry. Some of these important changes, characterizing its privatization, can be summarized into two points: First, the TMTC was fully privatized by transferring hundreds of vehicles, 53 of 62 national highway lines and 43 of 83 provincial lines, together with all the 15 stations and depots to some 1,100 employees (out of 3,100 employees), the resultant private enterprise became organized as Guo Guang Motor Transport Company (KKTC). The rest of national and provincial lines as well as remaining old vehicles were passed to existing local bus companies by means of tendering. Second, KKTC was awarded a public passenger transportation franchise for a period of five years. Today, the KKTC is a good example of a POE operating in a similarly partially deregulated transportation market but almost entirely free from the government's restriction as a SOE. - 19 -.
(40) Thirdly, subsequent to TMTC’s privatization, other three nationalized enterprises, including Taipei Municipal Bus Company, have followed this successful case to impletement their programme of privatization.. - 20 -.
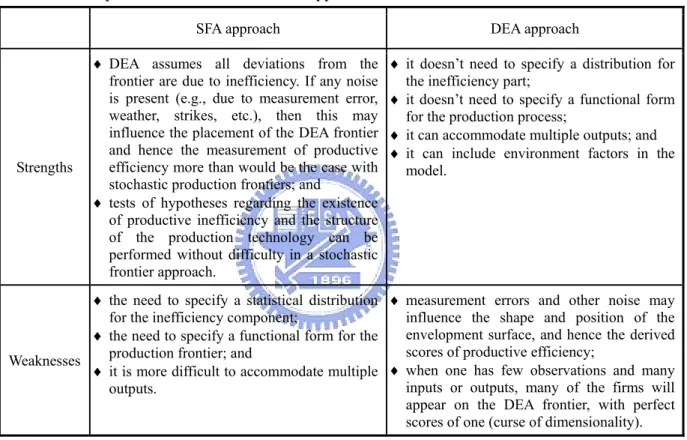
(41) CHAPTER 3 Literature Review It’s only quite recently that frontier studies have been developed as an appropriate methodologies to the transport sector, and the majority of studies have been published during the 1990s. A comprehensive survey of frontier methodologies and empirical results for public transit has been presented by De Borger et al. (2002). The existing frontier studies measuring urban transit performance have also been systematically summarized and critically assessed by them. In this chapter, frontier studies of transit systems are first reviewed, then the relevant researches concerning transit efficiency measurement, including frontier studies in Taiwan, input and output measures in transit, related studies of transit performance, as well as related studies of transit privatization are briefly reviewed.. 3.1. Frontier studies of transit systems Methods of measuring efficiency can be broadly classified into non-parametric and. parametric. Non-parametric methods include indexes of partial and total factor productivity (TFP), and data envelopment analysis. The latter is essentially a linear programming based method. Parametric methods involve the estimation of neoclassical and stochastic cost and/or production functions (Gillen and Lall, 1997). An overview of non-parametric and parametric frontier studies concerning bus transit systems is presented below.. 3.1.1. Non-parametric approach. Regarding applications to transit efficiency studies, non-parametric approach have been used in the following cases. - 21 -.
(42) Chu et al. (1992) used DEA to develop a single measure for the efficiency and a single measure for the effectiveness of a transit agency relative to other agencies within the same peer group. By using a single measure for each of these criteria, the paper provided a more robust indicator or transit performance than the widely used multiple ratio analysis performed in the Irvine Performance Evaluation Method (IPEM). Their analysis reinforced the notion that, for a public agency, measures of efficiency should be kept distinct from measures of effectiveness. Obeng (1994) studied subsidy-induced technical inefficiencies in public transit systems using DEA in the United States. He found that subsidies improved technical efficiency in approximately 75% of the transit system studied. These efficiency improvement resulted in total cost savings of $13.66 million or $0.187 million per transit system. He argued that the type of subsidy given to the transit systems may determine its impact on technical efficiency. He notes that an output-based subsidy and capital subsidy are important in determining transit efficiency. Nolan (1996) used the DEA approach with a second stage regression analysis to study technical efficiency determinants in the United States transit sector. Among other things, he concluded that operating subsidies created significant and negative impacts on efficiency. Agencies that received larger subsidies from state (but not federal) government had less incentive to produce efficient levels of output. Kerstens (1996) evaluated the performance of a sample of French urban transit companies using a broad selection of nonparametric reference technologies for two specifications of the production process. In particular, the variable returns to scale DEA models with either strong or weak disposability in both inputs and outputs, and the Free Disposal Hull (FDH) are applied. An extensive comparison of the resulting radial output efficiency measures yields the following major methodological conclusions. First, the location of the efficiency distributions differs substantially depending on the methodology and - 22 -.
(43) especially on the output specification considered. The latter differences vanish if the impact of outliers is eliminated. Second,, convexity has a stronger influence on the efficient-inefficient dichotomy than allowing for congestion by means of a weakly disposable DEA model. For policy purposes, these efficiency distributions are explained using a Tobit model. The findings corroborate results reported elsewhere: the harmful impact of subsidies, etc. Furthermore, the network structure seems to account for some differences in performance. Finally, a novelty in the urban transit context is the indirect monitoring effect of the French earmarked transportation tax. Roy (1996) studied the productivity of the transport sector in Canada using the total factor productivity (TFP) index at the aggregate level. He found that total productivity of Canada’s transport sector grew by 15 per cent over the 1981 to 1993 period (1.1% per annum). He also found that since the mid-eighties, productivity had been trending downwards in passenger carriers, while the gains of freight carriers had been accelerating since 1986. However, he excluded urban carriers such as transit systems, taxicab operations, and special services such as school bus operators from the analysis. Lyons (1997) indicated that there are many ways to look at productivity in the transit industry. The most commonly used indicators of performance are partial measures of efficiency. Recent studies have focused on developing a single measure of overall transit performance based on TFP and/or DEA models. However, these studies use different theoretical concepts, measures of output and input, and data sets to measure productivity. The objectives of this dissertation are: to determine whether the use of different single measure performance indicators yields consistent results; to determine whether there are significant differences in performance as measured by total and/or partial indicators; to explore which set of partial measures can best be used to predict overall performance; and to examine the influence of operating environments on overall performance. The overall measures used are TFP and DEA. Cross-sectional panel data are used for 93 urban transit firms which had 50 - 23 -.
(44) more buses in 1986, 1988, and 1990. Analysis revealed that the overall measures of productivity yield consistent results when the output variable remains fixed. However, the designation of firms as “best” or “worst” performers is substantially influended by the choice of the output variable. There are significant differences in performance as measured by overall and/or partial measures, but commonly-used partial measures are good predictors of overall productivity. While operating environment does matter, characteristics influenced by transit managers and policy-makers explain much of the variation in overall performance. Viton (1997) studied the efficiency of U. S. multi-mode bus transit systems by asking whether they could expand their service (outputs) without requiring additional resources (inputs); or whether they could reduce input utilization without having to reduce service. He used the DEA technique in the study. The findings indicated that the degree of inefficiency present is small: decision-making units (DMUs) could reduce input usage by an average of only four percent without curtailing services, or could increase service by an average of only six percent without requiring additional inputs. Just under 80% of the sample was technically efficient, and about 20% of the industry was to some degree inefficient. The incidence of inefficiency was not strongly correlated with system input or output characteristics. Viton (1998) examined the claim that US bus transit productivity had declined in recent years. It did so with reference to a piecewise-linear best-practice (DEA) production frontier, computed for multi-modal bus transit between 1988 and 1992. Efficiency was measured both by a Russell (Static) and Malmquist (dynamic) measure of productivity change. The principal finding was that, overall, bus transit efficiency had improved slightly over the period. Button and Costa (1999) indicated that the regulatory framework under which the European transport network operates has changed significantly over the last 15 years. At the macro level the creation of the Single European Market has removed many of the institutional impediments to international transportation within European Union. At the meso level national governments have liberalized inter-city authorities have acted to introduce greater - 24 -.
數據
+7


相關文件
An adaptation layer is used to support specific primitives as required by a particular signaling application. The standard SS7 applications (e.g., ISUP) do not realize that
We showed that the BCDM is a unifying model in that conceptual instances could be mapped into instances of five existing bitemporal representational data models: a first normal
• Note: The following slides integrate some people’s materials and viewpoints about EM including Kevin materials and viewpoints about EM, including Kevin
• A delta-gamma hedge is a delta hedge that maintains zero portfolio gamma; it is gamma neutral.. • To meet this extra condition, one more security needs to be
The Service Provider Switching Model SPSM: A Model of Consumer Switching Behavior in the Services Industry. „Migrating‟ to New
The following sentences are taken from Understanding Integrated Science for 21 st Century Book 1A published by Aristo Educational Press Limited.. Fill in the blanks with the
Hope theory: A member of the positive psychology family. Lopez (Eds.), Handbook of positive
O.K., let’s study chiral phase transition. Quark
