ORIGINAL ARTICLE
Gender-specific risk factors for incident gout: a prospective
cohort study
Jiunn-Horng Chen&Wen-Ting Yeh&
Shao-Yuan Chuang&Yi-Ying Wu&Wen-Harn Pan
Received: 31 October 2010 / Revised: 8 May 2011 / Accepted: 8 June 2011 # Clinical Rheumatology 2011
Abstract Previous reports suggested that gout incidence increased with serum uric acid (sUA) level. In addition to sUA, we aimed to examine the gender-specific risk factors for incident gout. A prospective study was conducted using data of the MJ Health Screening Center and outcome database from Taiwan’s National Health Insurance. Cox proportional hazard model was used for risk analysis of incident gout. During a mean follow-up of 7.31 years for 132,556 individuals aged≥18 years, 1,606 subjects (1,341 men and 265 women) with clinical gout were defined. Hyperuricemia (sUA ≥7.7 mg/dL for men or ≥6.6 mg/dL for women) was the most important risk factor for gout development with a respective hazard ratio of 9.65 (95%
confidence level, 8.53–10.9) for men and 9.28 (7.00–12.3) for women. The age-standardized sUA–gout relationship demonstrated a differential impact of sUA level on gout incidence between men and women. Metabolic comorbid-ities of hypertension, obesity, and hyperlipidemia were significantly associated with gout with respective HR of 1.32 (1.17–1.48), 1.30 (1.15–1.47), and 1.12 (0.99–1.26) for men and 1.34 (1.02–1.77), 2.15 (1.67–2.76), and 1.70 (1.32–2.19) for women. However, the relationship between diabetes and incident gout was not as prominent. The sex difference of sUA–gout relationship and the association between metabolic comorbidities and incident gout were demonstrated. Generalizability of these findings to other ethnic population needs further investigation.
Keywords Cohort study. Gout . Hyperuricemia . Sex
Background
Gout is a common rheumatic disease which has recently drawn great research attention due to increasing incidence and prevalence reported worldwide in the past decades [1, 2]. Gouty arthritis occurs more frequently in men at younger ages than in women and is regarded as a result of interplays between genetic, metabolic, and environmental factors [3,4].
Gouty arthritis is generally recognized as a result of monosodium urate (MSU) crystal deposition in the joint [3]. Using the level beyond 6.8–7.0 mg/dL at which
extracellular uric acid supersaturates to define hyperuricemia [4] emphasizes crystal deposition property of urate in gout events [5]. The Normative Aging Study suggests that annual incidence of gout increases with increasing sUA levels [1, 2]. However, most gout-related reports studied
J.-H. Chen
School of Medicine, China Medical University, Taichung, Taiwan
J.-H. Chen
Division of Rheumatology, Internal Medicine Department, China Medical University Hospital,
Taichung, Taiwan
W.-T. Yeh
:
W.-H. PanDivision of Epidemiology and Genetics,
Institute of Biomedical Sciences, Academia Sinica, Taipei, Taiwan
S.-Y. Chuang
:
W.-H. Pan (*)Division of Preventive Medicine and Health Service Research, Institute of Population Health Sciences,
National Health Research Institutes, Miaoli 350, Taiwan
e-mail: [email protected] Y.-Y. Wu
Department of Medical Laboratory Science & Biotechnology, China Medical University,
Taichung, Taiwan
men as contrast to the limited description of gout on women [6, 7]. Though sex difference has been observed for the age–hyperuricemia and age–gout relationships, impacts of sUA and other comorbidities on gout attack between sexes and difference between the pre- and post-menopausal women are not yet carefully examined [8].
In this study, we aimed to use baseline sUA data of health examinees collected from the MJ Health Screening Center and follow-up information from the Bureau of National Health Insurance (NHI) in Taiwan to determine the gender-specific risk factors for gout development.
Methods
Study population The study was conducted using health examinees' data collected by the privately owned nation-wide MJ Health Screening Centers in Taiwan from 1994 to 1996. This dataset has been used in several recent publications on some timely and important research topics [9–11]. Detailed description of data for those health examinees and their socio-economic distribution has been described in our recent report [10]. This study was approved by the Institutional Review Boards of the China Medical University Hospital, Taichung and Academia Sinica, Taipei, Taiwan.
Exclusion criteria Data from 137,532 participants aged 18 years and above were included after excluding unclear data from 0.46% of the original cohort. We further excluded subjects who did not have registered data with the NHI program (n=2,450), died before 1997 (n=612), had self-reported gout history (n=1,725), or were suspected to have had gout according to the NHI database during 1994–1996 (n=189; see later description of gout defini-tion). A total of 132,556 subjects (60,181 men and 72,375 women) free from gout at baseline were included in the statistical analyses.
Baseline information and definition of comorbidities Baseline information of these health examinees was used. SUA, cholesterol, triglyceride, and plasma glucose of fasting blood were measured enzymatically by using the Hitachi 7150 autoanalyzer (Tokyo, Japan). We defined hyperurice-mia as sUA≥7.7 mg/dL for men or ≥6.6 mg/dL for women [12]. sUA was further divided into gender-specific quartile levels. Obesity was defined as a body mass index (BMI) of ≥27 kg/m2. Hypertension was defined as systolic blood pressure (SBP) ≥140 mmHg, diastolic blood pressure (DBP) ≥90 mmHg or by the use of antihypertensive medications [13]. Diabetes was defined as fasting blood sugar ≥126 mg/dL or by the use of anti-diabetic medica-tions. A cholesterol level of ≥240 mg/dL and triglyceride
level of≥200 mg/dL were used to define hypercholesterol-emia and hypertriglyceridhypercholesterol-emia, respectively. Hyperlipidhypercholesterol-emia was defined by the presence of either hypercholesterolemia or hypertriglyceridemia. Current alcohol drinking was defined if the subjects answered "drinking alcohol occasionally", "frequently or daily" as opposed to either "never drinking" or "abstaining". Likewise, current cigarette smoking was defined if the subjects answered "smoking occasionally", "frequently or daily" versus either "not smoking at all" or "ex-smokers".
Follow-up database and definition of incident gout We extracted data from the database of NHI, a national program that began in 1995, to provide outcome information of this study. This is an administrative database containing dispensed medical claim record [14]. Clinical gout diagno-sis was recorded using the ninth version of the International Classification of Disease (ICD-9) code in the NHI database. The codes of gout (ICD-9 = 274.x) were searched in database from January 1, 1996 to December 31, 2002. Four sets of criteria to define incident gout were established as described below: (1) having diagnostic code of gout assigned during follow-up period; (2) the first criteria + having colchicine prescribed at least twice at these visits of gout diagnosis; (3) the second criteria + having urate lowering drugs (including allopurinol, probenecid, sulfin-pyrazone, or benzbromarone) prescribed with colchicine at these visits; and (4) the third criteria specifically defined by rheumatologists. The onset time of gout was defined either when ICD code was assigned for the first criteria or when colchicine was initially prescribed to the patient for the rest of the criteria.
Statistical analysis Baseline characteristics between sexes and those between the gout-free and the incident-gout participants were compared by two-sample t tests or chi-square tests. A sensitivity analysis on gout definition was carried out by comparing four sets of criteria.
We used criteria to estimate the annual incidence of gout per 1,000 person-years (PYs), with respect to sUA levels from 4.0 to 9.0 mg/dL at an incremental interval of 0.5 mg/dL. Age-standardized rate of gout incidence was calculated, combining the above incidence rate and Taiwanese population age distribution at the end of year 2000 by 5-year age groups. The relationship between sUA level and incident gout was further examined in stratified age and sex subgroups (ages 18–39 years, 40– 64 years, and ≥65 years for men; ages <50 and ≥50 years for women).
Cox proportional hazard model was used to estimate the relative risks of hyperuricemia, each metabolic risk factor, and those between three upper sUA quartiles and the lowest with respect to the incidence of gout. In the multivariate
models, age, sex, obesity, hypertension, hyperlipidemia, diabetes, alcohol drinking, and cigarette smoking were adjusted. Significance of the interaction between sexes and each covariate was tested with two main effects (each
covariate and sex) and their interaction term in the model. Sex stratification was subsequently performed. All hazard ratios (HR) were provided with a 95% confidence interval (CI). The statistical package SAS 9.01 (SAS Institute, Cary, NC, USA) was used for analysis.
Results
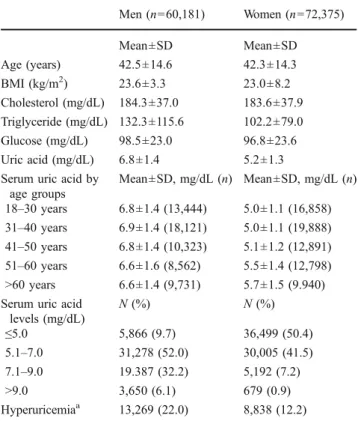
Baseline characteristics and comorbidities The mean (±SD) sUA level was 6.8±1.4 mg/dL in men (Table 1), which was significantly higher than that in women (5.2± 1.3 mg/dL; p<0.001). sUA levels in men were similar across age groups, but women’s sUA levels increased with age, especially after menopause at the age of 50 years. Serum uric acid quartiles were <5.8 mg/dL (reference), 5.8– 6.6 mg/dL, 6.7–7.6 mg/dL, and >7.6 mg/dL for men; and <4.3 mg/dL (reference), 4.3–5.0 mg/dL, 5.1–5.9 mg/dL, and >5.9 mg/dL for women. The prevalence of hyperuricemia in this study population was as high as 16.7%, i.e., 22.0% in men (≥7.7 mg/dL sUA) and 12.2% in women (≥6.6 mg/dL). The mean levels of cholesterol (184.3± 37.0 mg/dL), triglyceride (132.3 ± 115.6 mg/dL), glucose (98.5 ±23.0 mg/dL), and BMI (23.6 ± 3.3 kg/m2) in men were also higher than those in women (183.6±37.9 mg/dL, 102.2±79.0 mg/dL, 96.8±23.6 mg/dL, and 23.0±8.2 kg/m2, respectively; all p<0.05).
In this 132,556 study population, there were 14.0%, i.e., 18,587, subjects (10,047 men and 8,540 women) who had been prescribed at least once of urate-lowering drugs. All of them had been previously assigned ICD code of gout, which made them satisfy the first criteria (Table 2). It is worth noting that these subjects comprised 84% of 22,107 hyperuricemia individuals (i.e., 13,269 men and 8,838 women) at baseline (Table1).
Table 1 Baseline characteristics of the participants in the MJ Health Screening Center, stratified by gender (N=132,556)
Men (n=60,181) Women (n=72,375) Mean±SD Mean±SD Age (years) 42.5±14.6 42.3±14.3 BMI (kg/m2) 23.6±3.3 23.0±8.2 Cholesterol (mg/dL) 184.3±37.0 183.6±37.9 Triglyceride (mg/dL) 132.3±115.6 102.2±79.0 Glucose (mg/dL) 98.5±23.0 96.8±23.6 Uric acid (mg/dL) 6.8±1.4 5.2±1.3
Serum uric acid by age groups Mean±SD, mg/dL (n) Mean±SD, mg/dL (n) 18–30 years 6.8±1.4 (13,444) 5.0±1.1 (16,858) 31–40 years 6.9±1.4 (18,121) 5.0±1.1 (19,888) 41–50 years 6.8±1.4 (10,323) 5.1±1.2 (12,891) 51–60 years 6.6±1.6 (8,562) 5.5±1.4 (12,798) >60 years 6.6±1.4 (9,731) 5.7±1.5 (9.940)
Serum uric acid levels (mg/dL) N (%) N (%) ≤5.0 5,866 (9.7) 36,499 (50.4) 5.1–7.0 31,278 (52.0) 30,005 (41.5) 7.1–9.0 19.387 (32.2) 5,192 (7.2) >9.0 3,650 (6.1) 679 (0.9) Hyperuricemiaa 13,269 (22.0) 8,838 (12.2)
All variables were tested by two-sample t test or chi-square test, and significant differences were found between sexes (p<0.05). Cholesterol 1 mg/dL=0.0259 mmol/L, triglyceride 1 mg/dL=0.0113 mmol/L, uric acid 1 mg/dL=0.059 mmol/L, glucose 1 mg/dL=0.055 mmol/L
a
Hyperuricemia: sUA >7.7 mg/dL for men or >6.6 mg/dL for women
Table 2 Baseline characteristics of MJ participants who developed gout versus those who did not (N=132,556)
Variables Controls (n=113,969) 1st criteria (n=18,587) 2nd criteria (n=2,930) 3rd criteria (n=1,606) 4th criteria (n=238)
Age (years) 41.3±14.2 48.9±14.2 49.6±15.0 49.8±14.8 49.5±14.8 Men N (%) 50,134 (44.0%) 10,047 (54.1%) 2,396 (81.8%) 1,341 (83.5%) 207 (87.0%) Uric acid (mg/dL) 5.8±1.5 6.8±1.8 8.3±1.8 8.5±1.7 8.8±1.8 SBP (mmHg) 124.8±20.8 133.2±23.5 137.4±23.7 138.3±23.5 140.5±21.5 DBP (mmHg) 69.6±12.2 74.6±13.1 77.7±13.3 78.3±13.2 80.2±12.1 Glucose (mg/dL) 96.9±22.3 101.7±28.4 100.4±24.3 100.0±23.9 97.5±12.6 Cholesterol (mg/dL) 182.3±36.8 194.1±40.2 196.1±41.1 196.6±41.6 194.9±39.4 Triglyceride (mg/dL) 110.7±90.4 147.3±133.7 170.3±165.6 169.4±174.3 178.3±107.7 BMI (kg/m2) 23.0±3.8 24.8±14.5 25.4±3.4 25.5±3.5 25.5±3.3
1st criteria for gout definition: having diagnostic code of gout assigned during follow-up period; 2nd criteria for gout definition: 1st criteria + having colchicine prescribed at least twice at these visits of gout diagnosis; 3rd criteria for gout definition: 2nd criteria + having urate-lowering drugs (including allopurinol, probenecid, sulfinpyrazone, or benzbromarone) prescribed with colchicine at these visits; 4th criteria for gout definition: 3rd criteria specifically defined by rheumatologists
Sensitivity analysis of definition criteria for incident gout The results of sensitivity analysis on four sets of gout definition through comparing demographic information between gout patients and controls were summarized (Table 2). The results derived from the second, third, and fourth criteria were comparable, deviated from the first criteria. For instance, the mean sUA level of gout patients
was from 8.3 mg/dL to 8.8 mg/dL. However, the mean sUA level derived from the first criteria was 6.8 mg/dL which was closer to 5.8 mg/dL of the controls. On the other hand, the proportion between men and women defined by the first criteria was almost equal, which does not satisfy the usual expectation for higher prevalence of men to have gout than women [7].
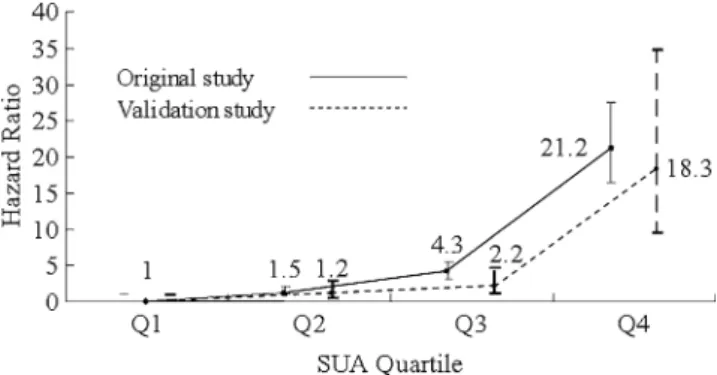
There was 1.2% of this study population, i.e., 1,606 subjects (1,341 men and 265 women), who satisfied the third criteria for incident gout defined by the general physicians (Table 2). The mean age of the gout subjects was 49.8±14.8 years. Most of the gout patients were men (83.5%). Although the case number of gout was only 238 (207 men and 31 women) according to the fourth criteria defined by the rheumatologists, the mean age of gout subjects (49.5 ± 14.8 years) or the proportion of men (87.0%) was respectively close to those derived from the third criteria. Figure 1 shows the sex-combined HRs for gout attack (all p for interaction between sexes and sUA quartiles >0.20), defined by the third and fourth criteria, that compare risks of the higher sUA quartiles with the lowest one among patients. A marked increase in the HR (21.2; 95% confidence interval, 16.4–27.5) for the gout patients defined by the third criteria was noted in the fourth quartile (sUA ≥7.6 mg/dL for men and ≥5.9 mg/dL for women). In the meantime, a study validated by the patients of gout defined by the fourth criteria exhibited a similar
Fig. 1 Hazard ratios of gout attack comparing higher serum uric acid quartiles to the lowest quartile. Among 132,556 participants, there are 1,606 gout events defined by the third criteria in the original study and 238 events in the validation study defined by the fourth criteria. Serum
uric acid quartiles are <5.8 mg/dL (reference), 5.8–6.6 mg/dL, 6.7–
7.6 mg/dL, and >7.6 mg/dL for men, and <4.3 mg/dL (reference),
4.3–5.0 mg/dL, 5.1–5.9 mg/dL, and >5.9 mg/dL for women. All
confidence intervals for HR in each quartile overlap between the original and validation studies
Table 3 Hazard ratios (95% confidence interval) of each metabolic risk factor on the future incidence of gouty arthritis (men=60,181; women= 72,375; pre-menopausal women=49,637; post-menopausal women=22,738)
Sex (n/N) person years
Men (1,341/60,181) Women (265/72,375) Post-menopause (213/22,783) Pre-menopause (52/49,637)
436,852.7 PYs 531,625.3 PYs 165,382.0 PYs 366,270.3 PYs
Incidence 3.09 × 10⁻³PYs 0.53 × 10⁻³PYs 1.29 × 10⁻³PYs 0.14 × 10⁻³PYs
HR (95% CI) Age-adjusted Multi-adjusted Age-adjusted Multi-adjusted Age-adjusted Multi-adjusted Age-adjusted Multi-adjusted
Age – 1.03 – 1.05 – 1.02 – 1.09 – (1.02–1.03) – (1.04–1.06) – (1.00–1.04) – (1.04–1.13) Hyperuricemia 10.5 9.65 12.3 9.28 9.54 7.68 25.3 17.2 (9.27–11.8) (8.53–10.9) (9.33–16.1) (7.00–12.3) (7.08–12.9) (5.66–10.4) (13.7–47.0) (8.98–33.1) Obesity 2.13 1.30 3.70 2.15 2.97 1.90 6.48 2.50 (1.88–2.40) (1.15–1.47) (2.90–4.72) (1.67–2.76) (2.27–3.88) (1.44–2.51) (3.67–11.5) (1.38–4.52) Hypertension 1.74 1.32 2.11 1.34 1.76 1.23 3.53 1.70 (1.54–1.95) (1.17–1.48) (1.59–2.79) (1.02–1.77) (1.32–2.34) (0.92–1.65) (1.92–6.50) (0.91–3.18) Hyperlipidemia 1.81 1.12 2.77 1.70 2.36 1.59 4.34 1.79 (1.61–2.04) (0.99–1.26) (2.16–3.57) (1.32–2.19) (1.80–3.09) (1.20–2.09) (2.37–7.96) (0.96–3.35) Diabetes 0.82 0.85 1.62 1.15 1.65 1.27 1.18 0.51 (0.65–1.03) (0.67–1.07) (1.17–2.24) (0.83–1.60) (1.18–2.30) (0.90–1.79) (0.29–4.90) (0.12–2.13)
The multi-adjusted model of hyperuricemia was adjusted by age, obesity, hypertension, hyperlipidemia, diabetes, alcohol drinking, and cigarette smoking
pattern with a conspicuously sharp increase at the fourth quartile (18.3; 9.63–34.8). Confidence intervals for all HR estimates in each quartile overlapped substantially between the studies defined by the third and fourth criteria.
We decided to present estimates derived from the third criteria because the estimates of demographic character-istics (Table 2) and HRs of quartile sUA (Fig. 1) were comparable with those derived from the second and fourth criteria. Besides, the relationship between the metabolic risk factors and gout development was consistent for the second to the fourth criteria.
Age, sex, sUA, metabolic comorbidities, and incident gout The standardized overall incidence was 1.69 per 1,000 PYs. Incidence in men (3.09 per 1,000 PYs) was six times higher than that in women (0.53 per 1,000 PYs)
(Table 3). The standardized incidence increased with each increment of sUA level (Fig. 2). The effect of sUA level increment on gout incidence elevation was greater in men than women. Gout occurred at a mean age of 54.0 ± 14.7 years (ages 52.3 ± 14.8 years for men and 62.2 ± 11.1 years for women; p < 0.001; no tabulated data shown). Older people had a higher incidence of gout at all levels of sUA.
The multivariate adjusted HR of hyperuricemia was 9.65 (95% CI, 8.53–10.9) in men, which was followed by hypertension (1.32; 1.17–1.48), obesity (1.30; 1.15–1.47), and hyperlipidemia (1.12; 0.99–1.26) (Table 3). On the other hand, adjusted HR of hyperuricemia in women was 9.28 (7.00–12.3), which was followed by obesity (2.15; 1.67–2.76), hyperlipidemia (1.70; 1.32–2.19), and hyper-tension (1.34; 1.02–1.77). For the post-menopausal
Fig. 2 Relationship between incidence of gout and serum uric acid levels by sex and by age. Incidence estimates (per 1,000 person-years) and 95% confidence intervals are provided. Age-standardized incidence (bold line) of gout is calculated from Taiwanese population at year 2000. The tables below show the respective age–sUA incidence per 1,000 PYs
women, risk of hyperuricemia was comparatively lower with a HR of 7.68 (5.66–10.4); however, due to less case number, HR of hyperuricemia for the pre-menopausal women was 17.2 (8.98–33.1). Both risks of obesity and hyperlipidemia were of importance for gout development in the post- and pre-menopausal women. Their respective HRs were 1.90 (1.44–2.50) and 2.50 (1.38–4.52) for obesity, and 1.59 (1.20–2.09) and 1.79 (0.96–3.35) for hyperlipidemia. The relationship between diabetes and incident gout was not as prominent.
Discussion
We found that hyperuricemia was the most import risk factor for gout development. HRs of hyperuricemia for men with sUA at 7.7 mg/dL and women at 6.6 mg/dL in the present study were almost equal (HR 9.65 for men and 9.28 for women, respectively), and the 95% confidence intervals overlapped, while a HR of 7.68 for the post-menopausal women was comparatively lower. The sUA–gout relation-ship with higher impact of sUA on men than women is further demonstrated in Fig.2. The greater impact of sUA elevation on gout incidence in men [7, 15] may be attributable to a higher mean sUA level and a higher prevalence of hyperuricemia in men (6.8 mg/dL and 22.0%, respectively) than in women (5.2 mg/dL and 12.2%, respectively). Enhanced uricosuric effect of estrogen [8] on renal tubules in women may be responsible for lower incidence of hyperuricemia and gout in women [15].
We observed that women’s mean gout onset age (62.2 years) was 10 years older than that of men’s (52.3 years). The age and sex difference of gout occurrence with respect to sUA levels has been explained by a greater impact of insulin on renal uric acid resorption in women [16] and a higher prevalence of abdominal obesity with insulin resistance in post-menopausal women [7]. In the present study, obesity and hyperlipidemia were shown as important risk factors especially in women. Contribution of hypertension for incident gout was also demonstrated. A close association between these metabolic comorbidities for gout development is suggested [17]. On the other hand, patients with diabetes was noted to have a lower future risk of gout, which is also compatible with the previous report hypothesizing that glycosuria may result in uricosuria [18]. Presence of MSU crystal in the synovial fluid by arthrocentesis is considered essential for gout diagnosis in the past [19]. However, sensitivity of crystal diagnosis for gouty arthritis can be low in a large population study. Recent epidemiologic research using administrative claim data in gout study has suggested that diagnosis of gout with at least two ambulatory visits may present a positive predictive value of 61%. An evaluation by rheumatologists
can substantially increase the value up to 92% [20]. The current study used information from NHI in Taiwan, which may have the weakness in classifying“true” gout subjects [21]. We thus used sensitivity analysis for different sets of criteria to define gout and found comparability between these definitions especially that made between general physicians and rheumatologists. Incident gout defined by linking medical dispensed record of colchicine and/or urate-lowering drugs may add to the validity for defining chronic gout and would not change the relationship between respective risk factor and gout development.
Conclusions
In this study, a sex difference of sUA–gout relationship has supported a higher risk impact of sUA level for men than that for women. Metabolic comorbidities of hypertension, obesity, and hyperlipidemia are shown as important risk factors for incident gout, and obesity is especially worth noting for women. Further replication studies for the generalizability of our findings are needed in the future.
Acknowledgments This study was supported by the grant from the
National Science Council in Taiwan (NSC97-2314-B-039-010-MY3) and that from the China Medical University Hospital (DMR-98-010). We thank the Bureau of Health Promotion, Department of Health, R. O.C. (Taiwan) for assisting in linking the MJ Health Screening Centers database to the National Health Insurance Dataset.
Disclosures None.
References
1. Campion EW, Glynn RJ, DeLabry LO (1987) Asymptomatic hyperuricemia. Risks and consequences in the Normative Aging
Study. AM J Med 82(3):421–426
2. Mikuls TR, Farrar JT, Bilker WB, Fernandes S, Schumacher HR Jr, Saag KG (2005) Gout epidemiology: results from the UK
General Practice Research Database, 1990–1999. Ann Rheum Dis
64(2):267–272
3. Underwood M (2006) Diagnosis and management of gout. BMJ
332(7553):1315–1319
4. Choi HK, Mount DB, Reginato AM (2005) Pathogenesis of gout.
Ann Intern Med 143(7):499–516
5. Becker MA, Jolly M (2006) Hyperuricemia and associated diseases. Rheum Dis Clin North Am 32(2):275–293, v–vi 6. Bhole V, de Vera M, Rahman MM, Krishnan E, Choi H (2010)
Epidemiology of gout in women: fifty-two-year followup of a
prospective cohort. Arthritis Rheum 62(4):1069–1076
7. Harrold LR, Yood RA, Mikuls TR, Andrade SE, Davis J, Fuller J et al (2006) Sex differences in gout epidemiology: evaluation and
treatment. Ann Rheum Dis 65(10):1368–1372
8. Hak AE, Curhan GC, Grodstein F, Choi HK (2010) Menopause, postmenopausal hormone use and risk of incident gout. Ann
Rheum Dis 69(7):1305–1309
9. Wen CP, Cheng TY, Tsai MK, Chang YC, Chan HT, Tsai SP et al (2008) All-cause mortality attributable to chronic kidney disease:
a prospective cohort study based on 462 293 adults in Taiwan.
Lancet 371(9631):2173–2182
10. Chen JH, Chuang SY, Chen HJ, Yeh WT, Pan WH (2009) Serum uric acid level as an independent risk factor for all-cause, cardiovascular, and ischemic stroke mortality: a Chinese cohort study. Arthritis Rheum 61(2):225–232
11. Yang FY, Wahlqvist ML, Lee MS (2008) Body mass index (BMI) as a major factor in the incidence of the metabolic syndrome and its constituents in unaffected Taiwanese from 1998 to 2002. Asia
Pac J Clin Nutr 17(2):339–351
12. Chang HY, Pan WH, Yeh WT, Tsai KS (2001) Hyperuricemia and gout in Taiwan: results from the Nutritional and Health Survey in
Taiwan (1993–96). J Rheumatol 28(7):1640–1646
13. Black HR, Yi JY (1996) A new classification scheme for hypertension based on relative and absolute risk with implications
for treatment and reimbursement. Hypertension 28(5):719–724
14. Wen CP, Tsai SP, Chung WS (2008) A 10-year experience with universal health insurance in Taiwan: measuring changes in health
and health disparity. Ann Intern Med 148(4):258–267
15. De Souza AW, Fernandes V, Ferrari AJ (2005) Female gout:
clinical and laboratory features. J Rheumatol 32(11):2186–2188
16. Choi HK, Ford ES (2008) Haemoglobin A1c, fasting glucose, serum C-peptide and insulin resistance in relation to serum
uric acid levels—the Third National Health and Nutrition
Examination Survey. Rheumatology (Oxford) 47(5):713–
717
17. Choi HK, Ford ES, Li C, Curhan G (2007) Prevalence of the metabolic syndrome in patients with gout: the Third National Health and Nutrition Examination Survey. Arthritis Rheum 57 (1):109–115
18. Rodriguez G, Soriano LC, Choi HK (2010) Impact of diabetes against the future risk of developing gout. Ann Rheum Dis 69
(12):2090–2094
19. Wallace SL, Robinson H, Masi AT, Decker JL, McCarty DJ, Yu TF (1977) Preliminary criteria for the classification of the acute
arthritis of primary gout. Arthritis Rheum 20:895–900
20. Harrold LR, Saag KG, Yood RA, Mikuls TR, Andrade SE, Fouayzi H et al (2007) Validity of gout diagnoses in administrative
data. Arthritis Rheum 57(1):103–108
21. Malik A, Dinnella JE, Kwoh CK, Schumacher HR (2009) Poor validation of medical record ICD-9 diagnoses of gout in a veterans