應變率對纖維複合材料側向抗壓強度影響之探討
70
0
0
全文
(2) 應變率對纖維複合材料側向抗壓強度影響之探討 Investigating Strain Rate Effect on Transverse Compressive Strength of Fiber Composites 研 究 生:郭濬清. Student:Jui-Ching Kuo. 指導教授:蔡佳霖. Advisor:Jia-Lin Tsai. 國. 立. 交. 通. 大. 學. 機 械 工 程 系 碩 士 論 文 A Thesis Submitted to Department of Mechanical Engineering College of Engineering National Chiao Tung University in partial Fulfillment of the Requirements for the Degree of Master in Mechanical Engineering July 2005 Hsinchu, Taiwan, Republic of China. 中 華 民 國 九 十 四 年 七 月.
(3) 應變率對纖維複合材料 側向抗壓強度影響之探討 學生:郭濬清. 指導教授:蔡佳霖. 國立交通大學機械工程學系碩士班 摘. 要. 本論文主要研究應變率對纖維複合材料側向抗壓強度的影響。玻璃纖 維/環氧樹脂與碳纖維/環氧樹脂之複合材料在本研究中一併探討。為了證明 解應變率的影響,製造完成的複材塊狀試片,將以每秒 10-4 至 700 的應變 率,在側向方向測試直到破壞。實驗觀察發現抗壓強度對應變率非常敏感, 因而可利用一個半對數函數來描述側向抗壓強度對應變率的靈敏度。並 且,將發現試片的主要破壞過程,是由於跟受力方向夾角約 32 度之平面上 的剪力破壞。由此,將抗壓破壞應力籍由莫耳圓之強度分析,可得到沒有 側向方向正向力時的面外剪力強度。碳纖維/環氧樹脂的明顯破壞機制為纖 維與基材間的剝離,然而,玻璃纖維/環氧樹脂,其破壞機制變成基材的破 壞。為提高側向抗壓強度,製造出含有機黏土的玻璃纖維/環氧樹脂奈米複 合材料以用於側向方向測試。可以發現複合材料包含有機黏土時,其相對 玻璃纖維/環氧樹脂的側向抗壓強度是增大的,其歸因於纖維與基材間界面 黏著力的提升。. i.
(4) Investigating Strain Rate Effect on Transverse Compressive Strength of Fiber Composites Student:Jui-Ching Kuo. Advisor:Dr. Jia-Lin Tsai. Institute of Mechanical Engineering. National Chiao Tung University. Abstract This research aims to investigate strain rate effect on transverse compressive strength of unidirectional fiber composites. Both glass/epoxy and graphite/epoxy composites were considered in this study. To demonstrate strain rate effect, composite brick specimens were fabricated and tested to failure in the transverse direction at strain ranges from 10-4/s to 700/s. Experimental observations reveal that the compressive strength is sensitive to the strain rates. A semi-logarithmic function was employed to describe the rate sensitivity of the transverse compressive strength. Moreover, it was found that the main failure mechanism of the specimens is the shear failure on the plane with around 32 degree to the loading direction. As a result, the out-of-plane shear strength without the transverse normal stresses was obtained from the compressive failure stress through Mohr’s strength analysis. The dominant failure mechanism for the graphite/epoxy composites is fiber and matrix debonding, however, for glass/epoxy composites, it becomes the matrix failure. To improve the transverse compressive strength, glass/epoxy nanocomposites with organoclay were fabricated, and then tested in the transverse direction. It was found the composites with the presence of the organoclay, the corresponding transverse compressive strength of glass/epoxy is enhanced, which could be attributed to the improved interfacial bonding between the fiber and matrix. ii.
(5) 誌謝 時光荏苒,歲月如梭,短短兩年的研究生生涯,在充實且忙碌的生活中,飛快地過 去了,首先感謝指導教授 蔡佳霖博士在兩年來的悉心指導及諄諄教誨,使得學生在邏 輯思考及解決問題方面,獲得極大的成長;另外,尤其在認真嚴謹處事態度上,更是獲 益許多,使得學生順利完成學業進修與論文寫作,在此致上誠摰的感謝。 同時感謝清華大學動機系教授葉孟考博士、富國國際實業總經理朱國棟博士及中正 大學機械系助理教授黃崧任博士,在百忙之中,擔任學生口試委員,不論是在論文寫作 上或是研究實驗上以及實務觀念上,均提供許多的寶貴意見,使得本論文內容上更加完 整,也令學生在觀念上受益匪淺,在此亦致上無限的感激。 在此並感謝工業技術研究院材料所研究員林美秀小姐和潘文華先生以及盧廷鉅學 長,提供預浸材以及在製作複材板技術和設備的協助,還有量測纖維體積比的幫助;交 通大學實驗工廠莊晰欽老師,在實驗設備器具製作上的協助及指導,使實驗得以順利進 行;清華大學工科所曾仕君學長,在 SEM 影像拍攝及預約儀器操作方面的協助;明安國 際企業魏志峰先生在提供實驗所需預浸材材料與資料的協助;清華大學奈科中心鄒紹光 先生使用 DC Sputter 設備,在試片鍍鈦膜的技術協助,致上最高的謝意。 感謝實驗室學長黃仁傑與王漢偉,在實驗設備及技術的指導及協助,並且在研究瓶 頸時,給予的指導及鼓勵,幫助我度過難關,一起分享生活上的甘苦,此外實驗室同學 許世民實驗上的合作,以及陳奎翰在課業及研究上一起奮鬥努力,生活上快樂悲傷的分 享與支持,一起度過兩年美好的研究生活。實驗室的學弟吳明道、曾世華及徐茂原,伴 隨我度過後半段的研究生活,帶來不少的歡樂及精神上的支持。從 Venezuela 來做研究 實驗的 Luis,不論是在英文對話能力提昇,或是國際觀的拓展,給了我很特別的觀感。 此外,感謝雅聯學妹,在短短認識的時光裡,讓平淡的生活不一樣,兩年的研究生 涯有很不同的感觸,也帶來了最大的精神動力,謝謝。感謝我在元智大學時期,中工會 社團的伙伴,還有打工認識的朋友,因為有你們,給了我精神上很大的支持,使我努力 完成研究所兩年的學業。 最後也是最重要的,要感謝的是養育照顧我二十多年的父母親,郭文義先生與楊玉 花女士,給予我最大的支持與關懷,讓我在研究所的生涯裡無後顧之慮,得以順利完成 研究所學業;還有妹妹郭秋榆,弟弟郭澤洋,所有家人對我的關心與支持,也希望妹妹 與弟弟在事業跟學業上有順利的發展。 感謝在我人生旅程上,我的家人、師長及所有認識的朋友,謝謝你們。. iii.
(6) 目. 錄. 中文摘要. ……………………………………………………………………. i. 英文摘要. ……………………………………………………………………. ii. 誌謝. ……………………………………………………………………. iii. 目錄. ……………………………………………………………………. iv. 表目錄. ……………………………………………………………………. v. 圖目錄. ……………………………………………………………………. v. 1. Introduction…………………………………………………………………. 1. 1.1 Introduction……………………………………………………………. 1. 1.2 Paper review……………………………………………………………. 1. 1.3 Approach………………………………………………………………. 3. 2. Transverse compressive strength……………………………………………. 5. 2.1 Specimen preparation……………………………………………………. 5. 2.2 Transverse compression testing…………………………………………. 5. 2.2.1 High strain rate test………………………………………………. 6. 2.2.2 Low strain rate test…………………………………………………. 9. 2.3 Result and discussion…………………………………………………… 10 3. Out of plane shear strength…………………………………………………. 13. 3.1 Shear failure stress……………………………………………………… 13 3.2 Shear strain rate…………………………………………………………. 15. 3.3 Result and discussion…………………………………………………… 18 4. Compressive failure of off-axis epoxy/clay fiber nanocomposites…………. 19. 4.1 Glass fiber/epoxy nanocomposite preparation…………………………. 19. 4.2 Compressive tests of glass fiber/epoxy nanocomposites………………. 21. 4.3 Result and discussion…………………………………………………… 23 5. Summary……………………………………………………………………. 25. Reference…………………………………………………………………… 26 Appendix A Investigating rate dependent behavior of PPG graphite/epoxy composites… 28 A.1 Specimen Preparation of PPG Graphite/Epoxy Composites…………… 28. iv.
(7) A.2 Compressive Failure Test……………………………………………… A.2.1 Low strain rate test………………………………………………. 30 30. A.2.2 High strain rate tests……………………………………………… 30 A.3 Result and discussion…………………………………………………… 33. LIST OF TABLES Table01.. Transverse compressive strength and true strain rate associated with the nominal strain rate for unidirectional CFA graphite/epoxy composites. ............................35 Table02. Transverse compressive strength and true strain rate associated with the nominal strain rate for unidirectional S2/8552 glass/epoxy composites. ...........................35 Table03. Out-of-plane shear strength of unidirectional CFA graphite /epoxy composites with shear strain rate and the relative transverse compressive strength, transverse strain rate and failure angle. .................................................................................36 Table04. Out-of-plane shear strength of unidirectional S2/8552 glass/epoxy composites with shear strain rate and the relative transverse compressive strength, transverse strain rate and failure angle. .................................................................................37 Table05. In-plane shear strength of E-glass/epoxy nanocomposites with different organoclay loadings..............................................................................................37 Table06. Transverse compressive strength of E-glass/epoxy nanocomposites with different organoclay loadings..............................................................................................37 Table A-1. Strain rates in the off-axis and transverse testing. ................................................38 Table A-2. Failure stress in unidirectional PPG graphite/epoxy composites during transverse compressive testing.. ............................................................................................38. LIST OF FIGURES Fig. 01. Fig. 02. Fig. 03. Fig. 04. Fig. 05. Fig. 06. Fig. 07. Fig. 08. Fig. 09. Fig. 10.. Schematic of Split Hopkinson Pressure Bar apparatus. .......................................39 The signals recorded during SHPB test for CFA graphite/epoxy composites......39 Schematic of the SHPB for time shifting. ............................................................40 Time shift of the pulse signals. .............................................................................40 Schematic of the contact stresses on each interface of the specimen...................41 The contact stresses on the specimen during the SHPB tests...............................41 Schematic of the displacements u1(t) and u2(t) on the Hopkinson bar. ................42 The histories of strains from SHPB formula and strain gage on the specimen. ...42 Schematic of the MTS compression test fixture...................................................43 Time histories of nominal strain and true strain from the gage signals................43 v.
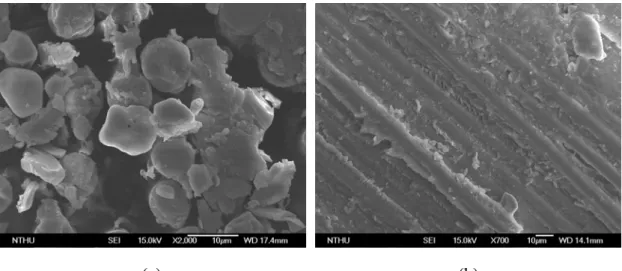
(8) Fig. 11. Fig. 12. Fig. 13. Fig. 14. Fig. 15.. Fig. 16.. Fig. 17. Fig. 18. Fig. 19. Fig. 20. Fig. 21. Fig. 22. Fig. 23.. Fig. 24.. Fig. 25. Fig. 26. Fig. 27. Fig. 28. Fig. 29.. Transverse compressive stress-strain curves for unidirectional CFA graphite/epoxy composites under varied strain rates............................................44 Variation transverse compressive strength of unidirectional CFA graphite/epoxy composites with transversal strain rate.................................................................44 Variation transverse compressive strength of unidirectional S2/8552 glass/epoxy composites with transversal strain rate.................................................................45 The failure specimens of (a) CFA graphite/epoxy and (b) S2/8552 glass/epoxy composites tested at nominal strain rate of 10-4/s, respectively............................45 The SEM micrographs of unidirectional S2/8552 glass/epoxy composites specimen experience transverse compressive test were (a) the surface on plane and (b) failure plane of the specimen, respectively. .............................................46 The SEM micrographs of unidirectional CFA graphite/epoxy composites specimen experience transverse compressive test were (a) the surface on plane and (b) failure plane of the specimen, respectively. .............................................46 The orientation of failure planes...........................................................................47 Schematic of the coordinate transformation.........................................................47 The comparison of analytical result and experimental measurement in the x3 direction at nominal stain rate 10-4/s.....................................................................48 The comparison of analytical result and experimental measurement in the x3 direction at nominal stain rate 10-2/s.....................................................................48 Variation out-of-plane shear strength of unidirectional CFA graphite/epoxy composites with shear strain rate..........................................................................49 Variation out-of-plane shear strength of unidirectional S2/8552 glass/epoxy composites with shear strain rate..........................................................................49 In-plane shear failure mechanisms for 30o specimens ((a) E-glass/epoxy composites, (b) and (c) E-glass/epoxy nanocomposites with 2.5 and 5.0 wt % organoclay). ..........................................................................................................50 In-plane shear failure mechanisms for 45o specimens ((a) E-glass/epoxy composites, (b) and (c) E-glass/epoxy nanocomposites with 2.5 and 5.0 wt % organoclay). ..........................................................................................................50 Effect of compressive transverse normal stress on shear strength. ......................51 Out-of-plane shear failure mechanisms ((a) E-glass/epoxy composites, (b) and (c) E-glass/epoxy nanocomposites with 2.5 and 5.0 wt % organoclay). ...................51 Transverse compressive strength of E-glass/epoxy nanocomposites with different organoclay concentration......................................................................................52 SEM micrographics on the failure surfaces of 30o specimens ((a) E-glass/epoxy composites, (b) E-glass/epoxy nanocomposites with 5.0 wt % organoclay)........52 SEM micrographics on the failure surfaces of 45o specimens ((a) E-glass/epoxy composites, (b) E-glass/epoxy nanocomposites with 2.5 wt % organoclay)........53 vi.
(9) Fig. 30.. Fig. A-1. Fig. A-2. Fig. A-3. Fig. A-4. Fig. A-5. Fig. A-6. Fig. A-7. Fig. A-8. Fig. A-9. Fig. A-10. Fig. A-11. Fig. A-12. Fig. A-13. Fig. A-14. Fig. A-15.. SEM micrographics on the failure surfaces of transverse specimens ((a) E-glass/epoxy composites, (b) E-glass/epoxy nanocomposites with 5.0 wt % organoclay). ..........................................................................................................53 Time histories of nominal strain and true strain from the gage signals on the 30o specimen. ..............................................................................................................54 Schematic of Split Hopkinson Pressure Bar apparatus. .......................................54 The signals recorded during SHPB test for 15o specimen with coating...............55 The signals recorded during SHPB test for 15o specimen without coating..........55 The signals recorded during SHPB test for 30o specimen....................................56 The contact forces on the 30o specimen during the SHPB test. ...........................56 The histories of strains from SHPB formula and strain gage on the 30o specimen. ..............................................................................................................................57 Stress-strain curves for 15o off-axis unidirectional PPG graphite/epoxy composites under varied strain rates.....................................................................57 Stress-strain curves for 30o off-axis unidirectional PPG graphite/epoxy composites under varied strain rates.....................................................................58 Stress-strain curves for 45o off-axis unidirectional PPG graphite/epoxy composites under varied strain rates.....................................................................58 Stress-strain curves for 60o off-axis unidirectional PPG graphite/epoxy composites under varied strain rates.....................................................................59 Transverse compressive stress-strain curves for unidirectional PPG graphite/epoxy composites under varied strain rates............................................59 The SEM micrographs of (a) 30o and (b) 90o PPG graphite/epoxy composite specimens at nominal strain rate of 10-4/s, respectively. .....................................60 The SEM micrographs of (a) 30o and (b) 90o PPG graphite/epoxy composite specimens at nominal strain rate of 1/s, respectively............................................60 The SEM micrographs of (a) 30o and (b) 90o PPG graphite/epoxy composite specimens at high strain rate in the SHPB test, respectively. ...............................61. vii.
(10) Chapter 1 Introduction 1.1 Introduction Composite materials, due to their high strength/weight ratio, had found many applications. In some of the applications, such as blast loading of a submarine hull and bird strike of an aircraft structure, high loading rates may be produced and, thus characterizing and modeling dynamic responses is essential to the application of composite materials. Transverse compressive strength is of concern in the design of composite structures because it is lower than the compressive strength. To utilize the composites with accuracy and safety in the applications, it is desired to characterize the transverse compressive strength and understand its sensitivity to the strain rates.. 1.2 Paper review In past decades, the compressive strength of unidirectional composites has been predicted effectively by using either microbuckling model [1-3] or kink band model [4, 5].. On the contrary, the number of studies on the failure stress and mechanism of. unidirectional composites subjected to transversely loading has been limited. Collings [6] measured the transverse compressive strength of carbon fiber reinforced plastics with different fiber volume fractions.. It was appears that the. transverse compressive strength was insensitive to fiber volume fraction, if no lateral constraints applied, and controlled by the fiber and matrix bond.. However, when a. constraint was applied laterally, the failures stresses are much higher than the unconstraint case and increases with the increment of the fiber volume.. It was observed. that the angle between the loading direction and failure plane is around 30 degree. Bazhenov and Kozey [7] investigated transverse compressive fracture of fiber reinforced composites and found that the compressive strength is not affected significantly by the fiber volume fraction.. Moreover, the main failure mechanism for the transverse 1.
(11) compression is the transverse shear in plane orientated at an angle of 35 to 41 with respected to the loading direction.. Since transverse compression is dominated by. transverse shearing, the transverse compressive testing can be applied to measure transverse shear strength.. Newaz and Majumdar [8] discovered the failure modes of. unidirectional SCS-6 (silicon carbide fibers)/Beta 21S (titanium alloy) metal matrix composites subjected to transverse compressive loads at two different temperatures.. It. was observed that the failure mechanism consists of the radical fiber fracture along the loading direction. Regarding the dynamic transverse compressive strength of unidirectional composites, few literatures were reported [9-14].. Lowe [9] performed transverse. compression test on T300/914 carbon/epoxy unidirectional composites at various strain rates and temperatures.. Experimental results reveal that the compressive strength and. modulus increases as the strain rate increase.. In contrast, these properties are. decreasing with the raising temperature. By examining the failure specimens, it was indicated that the transverse compressive fracture was caused by the interfacial shearing failure of the fiber and matrix, and the failure angle was approximately ±34∘to the loading axis.. Hsiao et al. [10-11] characterized the dynamic compressive behavior of. carbon/epoxy composites at strain rate up to 1800/s using a split Hopkinson pressure bar. It was observed that transverse compressive strength demonstrates a significant increase with the increment of the strain rate. Although the Young’s modulus follows the similar trend, its tendency is not as pronounced as the compressive strength. Furthermore the ultimate strain exhibits no strain rate dependency at all.. Vural and Ravichandran [12]. investigated the transverse failure behavior of thick unidirectional S2-Glass/Epoxy fiber-reinforced composite with varying degrees of lateral confinement at strain rates from 10-4/s to 104/s.. Experimental results indicate that transversal compressive failure. is due to the shear bands through fiber-matrix interface failure, and the compressive 2.
(12) strength increases with the application of the lateral confinement as well as the increment of the strain rate.. A Mohr-Coulomb type criterion was proposed to account for the. effect of the lateral confinement on the compressive strength.. The orientation of shear. failure plane relative to the loading direction was found to scatter over the range 30 - 41 degree and the average value was 37 degree. Guden and Hall [13-14] tested aluminum metal matrix composites at quasi-static and high strain rate loadings using a screw-driven Instron and Split Hopkinson Bar, respectively. It was found that in the transverse direction, the maximum stress is quite sensitive to strain rate, and the rate sensitivity could be expressed in terms of the semi-logarithm of strain rate. In view of forgoing, it was observed that the transverse compressive strength is dominated by the cohesive shear strength of the composites.. In order to describe the. dynamic transverse compressive strength of composites, it is desired to evaluate the cohesive shear strength and its sensitivity to the strain rate.. In this study, transverse. compression tests were conducted on unidirectional glass/epoxy and graphite/epoxy composites at various strain rates.. Based on the experimental results, a. semi-logarithmic function expressed in terms of the normalized strain rates was selected to describe the rate dependent behavior of the transverse compressive strength. Through Mohr’s strength theory [15], the cohesive shear strengths on the failure plane were calculated from the transverse compressive strength together with the measured failure angle.. The corresponding shear strain rate was evaluated from the axial strain. rate with the assistance of the viscoplasticity theory.. 1.3 Approach To investigate the rate dependency of the transverse compressive strength, unidirectional composite specimens were tested in compression along the transverse direction at various strain rates. The low strain rate tests and the higher strain rate tests 3.
(13) were performed using MTS machine and SHPB, respectively.. The failure stresses were. recorded and the corresponding strain rates were measured during the experiment. An empirical formulation expressed in terms of the normalized strain rates were proposed to model the transverse compressive strength. determined using SEM.. 4. Furthermore, the failure mechanisms were.
(14) Chapter 2 Transverse compressive strength. 2.1 Specimen preparation Two Material systems were employed in this chapter, S2/8552 glass/epoxy composites (from Hexcel Company, USA), CFA graphite/epoxy composites (from Ad group, Taiwan).. Seventy five ply prepreg of unidirectional S2/8552 glass/epoxy. composite was laid up and then cured by following the recommended process resulting in the 6.6 mm laminate, and the fiber volume fraction was 64.48%. The laminate was processed and finished in USA. For graphite/epoxy composites, fifty ply prepreg were fabricated and the laminate is 6.6 mm thick. The laminate had been cured in the hot press with the appropriate curing process, and the fiber volume fraction was 69.33%. First, the oversized dimensional specimens were split from the laminates using a Cutting Machine. Brick specimens with the dimensions of 8.0mm×8.0mm×6.0mm and 5.0mm×5.6mm×5.8 mm were cut from the CFA graphite/epoxy and S2/8552 glass/epoxy laminates respectively, using the precision diamond saw (IsometTM 1000 Precision Saw). All specimens were then lapped using a Lapping Machine (Secular LM15) with 25.0µ ® aluminum oxide powers (EXTEC ) to ensure having parallel and smooth loading. surfaces. Back to back strain gages were adhered on the CFA graphite/epoxy composite specimens for the strain measurement. All the CFA graphite/epoxy and S2/8552 glass/epoxy specimens used in the experiments were machined from the same CFA graphite/epoxy and S2/8552 glass/epoxy laminates respectively in the present investigation.. 2.2 Transverse compression testing In order to investigate rate sensitivity of the transverse compressive strength of the composites, the brick specimens were tested to failure at varied strain rates. There were 5.
(15) two primary testing equipments, the Split Hopkinson Pressure Bar (SHPB) and Material Test System (MTS), in this research. For strain rate greater than 1/s, the experiments were performed using Split Hopkinson Pressure Bar (SHPB) apparatus, an effective but simple apparatus for dynamic testing.. While the strain rate is less than 1/s, the. compressive tests were conducted using the MTS 810 machine.. 2.2.1. High strain rate test. The conventional split Hopkinson pressure bar consists of a striker bar, an incident bar, a transmission bar and a throw-off bar, and the specimens were sandwiched in between the incident and transmission bar as shown in the Figure 1, where specimen gage measures the strain pulse in the specimen and gage A measures both the incident and reflected pulses in the incident bar, while gage B measures the transmitted pulse. All the bars were made of the SKD-11 steel. The lengths of striker, incident, transmission, and throw-off bar were 92, 919, 579, and 371mm, respectively, and all of the diameters were 13.3mm. The strain gages were mounted at 510mm from the bar/specimen interface on the incident and at 298mm from the specimen/bar interface on the transmission bar. The SHPB apparatus was based on the one-dimension wave propagation theory, and was a well-established system used to measure the mechanical behavior in the dynamic compressive testing for several decades. The striker bar in the gas barrel was launched by a known gas pressure about 30-50 psi toward the incident bar. The copper pulse shaper with 1.50 mm thickness was placed on the impact surface of the incident bar so that the non-dispersive ramp pulse propagates in the incident bar. The impact generates a compression pulse to travel in the incident bar towards the specimen. When the mismatch of impedance and geometry between the specimen and the bar, part of the pulse is reflected back into the incident bar as a tensile wave, and the rest of the pulse is transmitted front as a compressive wave to the specimen and then into the transmission 6.
(16) bar. The signals of pulses were obtained from the strain gages located at the middle of the specimen, incident and transmission bar, which the strain gages are cemented diametrically opposite to each other on the specimen and bars, and connected to a Wheatstone bridge circuit. The excitation voltages of the Wheatstone bridge circuits were recommended to set at 3.0V. for specimen gage and 5.0V. for gage A and B. Both factors of amplification were set at 500 to gain the signals of incident and transmission bar from the relative circuit, and the factor was set at 25 for the specimen gage. In addition, the filter was set in the WB (wide-band) position to acquire the unfiltered output signals. The instrument used above was Model 2210B Signal Conditioning Amplifier. To tabulate the signals of voltage in each channel from Wheatstone bridge circuits, the sampling rate of digital storage oscilloscope (Tektronix TDS3014B) was regulated at 10MHz. Figure 2 shows the typical signals (voltages) picked up by specimen gage, strain gages A and B during an SHPB test on the CFA graphite/epoxy specimen. The slope of incident wave during rising time was gradual and the specimen underwent homogeneous deformation. The one-dimensional wave propagation theory could be used to calculate the specimen response. The incident, reflected, and transmission pulses, and specimen’s strain signal were shifted to the same instant of time when the incident wave propagated to reach the interface of incident bar and specimen. From Ninan et al. [16]. ε i (t ) = ε I (t − ∆t AB ). (2.1). ε r (t ) = ε I (t + ∆t AB ). (2.2). ε t (t ) = ε T (t + ∆t CD ). (2.3). where ε I (t ) and ε T (t ) were recorded by gage A on the incident bar and gage B on the transmission bar receptively at any instant time (t). The incident pulse ε i (t ) and the reflected pulse ε r (t ) were recorded at gage A on the incident bar, and gage B on the transmission bar recorded the transmission pulse ε t (t ) . In addition, the pulse transferred between located A and B after an interval of ∆t AB , and traveled between C and D after a 7.
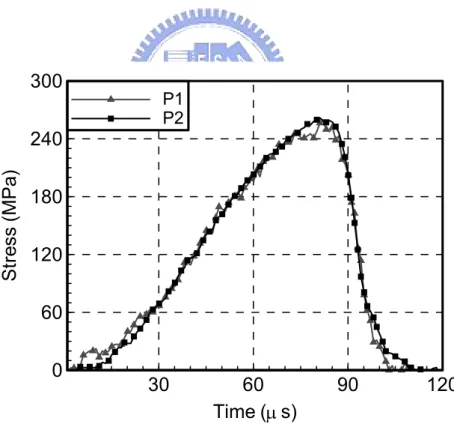
(17) period of ∆tCD . The positions of A-D and gage A and B were shown in Figure 3 and the result of shifted signals was revealed in Figure 4. Using the Hopkinson bar theory, the contact stress P1 between the incident bar and the specimen, and P2, the contact stress between the specimen and the transmission bar, can be extracted from the recorded pulse data [17]. The contact stresses on each interface of the specimen were shown in Figure 5 and known as P1 = AE (ε i + ε r ) As. (2.4). P2 = AEε t As. (2.5). where A and E were cross section area and Young’s modulus of the bar respectively and As was cross section area of the specimen. Figure 6 shows contact stresses P1 and P2 for the CFA graphite/epoxy specimen in the SHPB test. It can be seen that the peak values of the P1 and P2 curves are nearly the same. The contact stress P2 was used to express the stress due to the distributive points of P1 were more disorderly than P2. The stress in the specimen was given by. σ s = P2 As. (2.6). where was in the stress equilibrium, P1 = P2 . The peak values was taken as the failure stress of the specimen in the SHPB test. Two assumptions of the SHPB system had been confirmed; the specimen should be in dynamic stress equilibrium and undergoes homogeneous deformation over most duration of the test. Conventionally, the strain history of the specimen during loading is calculated using a well known Hopkinson bar formula with expressions of displacements at the ends of the bars derived from the strain responses recorded at gage A and gage B [17]. Therefore, the average strain of specimen was given by the displacements u1(t) on the interface of incident bar/specimen and u2(t) on the interface of specimen/transmission bar corresponding to the Hopkinson formula, which were shown in Figure 7 and expressed as 8.
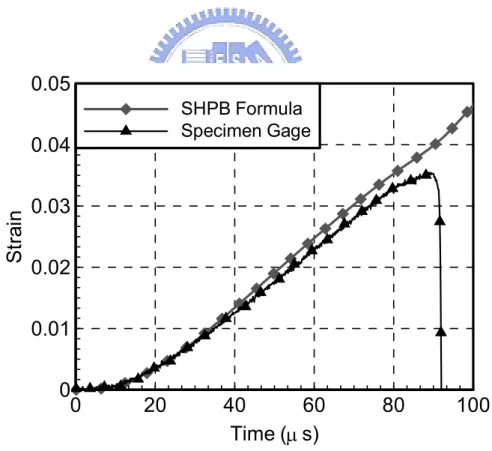
(18) u1 (t ) = c0 ∫ (− ε i + ε r ) dτ. (2.7). u 2 (t ) = −c0 ∫ ε t dτ. (2.8). u 2 − u1 l0. (2.9). t. 0. t. 0. εs =. where c0 was the longitudinal wave velocity in the bar and l 0 was the original specimen length. In the present study, the strain response of the specimen was also measured using strain gage directly mounted on the specimen.. Figure 8 shows the strain histories for. the CFA graphite/epoxy composite specimen obtained using the Hopkinson bar formula and the strain gage on the specimen, respectively.. It seems that, for CFA. graphite/epoxy specimens tested in transverse direction, the strain histories measured with different approaches are close. The strain rates obtained at incipient of failure in the SHPB tests are around 600/s.. 2.2.2 Low strain rate test Low strain rate failure testes were conducted on brick specimens in transverse direction using the stroke control mode on a servo-hydraulic MTS machine (MTS 810 system).. A self-adjusting device as shown in Figure 9 was used to eliminate potential. bending moments and also to ensure the specimen to be in full contact with the loading surfaces. Before each test performed, the loading fixture was preloaded to have parallel loading surfaces adjusted automatically by the self-adjusted device.. The applied load. and displacement for each test were recorded using LabVIEW, and three different nominal strain rates of 10-4/s, 10-2/s and 1/s were performed for CFA graphite/epoxy composite specimens.. Since S2/8552 glass/epoxy composite materials is limited, only. two nominal strain rates of 2×10⁻⁴/s and 2×10⁻¹/s were considered.. The nominal strain. rate was the stroke rate of the loading frame divided by the original specimen length. The 9.
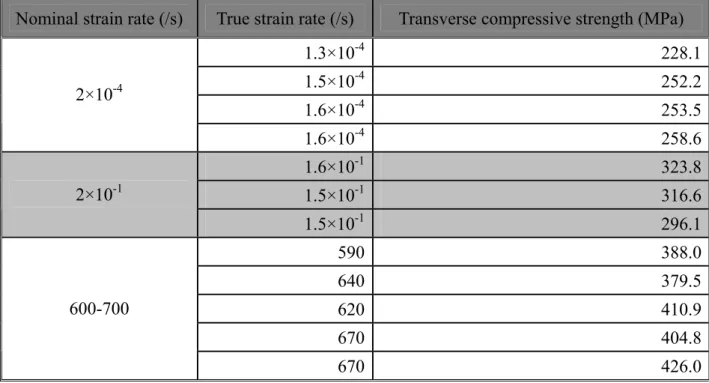
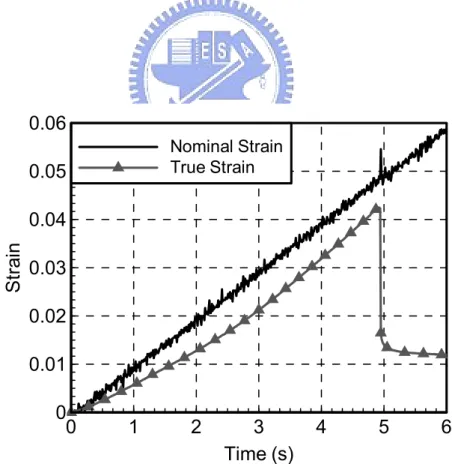
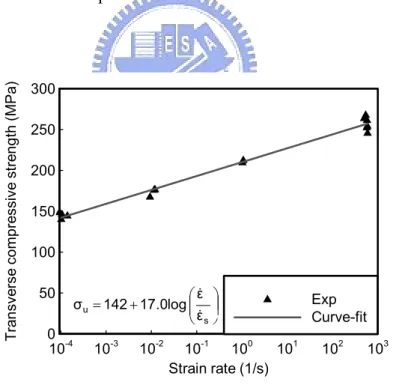
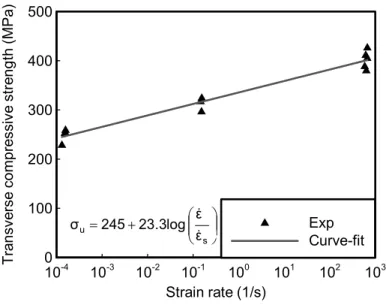
(19) corresponding true strain rates were measured by using strain gages directly mounted on the specimens. Figure 10 shows the nominal strain curve and the true strain curve for CFA graphite/epoxy composites specimen tested at the nominal strain rate of 10-2/s. It is evident that the true strain is quite different from the nominal strain and thus the true strain rate is also different from the nominal strain rate.. The use of the self-adjusting. device shown in Figure 9 in the compression test could have contributed to this discrepancy. As a result, the strain rate calculated based on the true strain curve at the instance of failure was adopted in this study. Moreover, the Poisson’s ratio ν 23 was measured in the same manner since this value is required for the calculation of the shear strain rate presented in Chapter 3. With longitudinal and lateral gages mounted on the specimen, the strain history in the x2 and x3 direction were detected and the Poisson’s ratio were calculated using the. formula given by. ν 23 = − ε 33 ε 22. (2.10). where ε 22 and ε 33 indicates the strains in the x2 and x3 direction, respectively.. 2.3 Result and discussion The transverse behaviors of unidirectional CFA graphite/epoxy composites obtained from the compression tests at various strain rates are shown in Figure 11.. The. associated peak values in the constitutive curves were realized as the failure stresses of the specimens. effect.. Apparently, the failure stresses were affected significantly by strain rate. However, the Young’s modulus (E2) is almost the same at strain rate ranges from. 10-4 to 600/s.. The compressive failure stresses against the corresponding strain rate. were graphed in Table 1 and plotted in Figure 12 as well, and their rate sensitivities were model using a semi-logarithmic function in terms of normalized strain rates. In the same manner, the dynamic transverse compressive strengths of S2/8552 glass/epoxy 10.
(20) composites were obtained and the results were shown in Table 2, and then plotted in Figure 13. It is interesting to mention that, for each strain rate, the S2/8552 glass/epoxy composites demonstrate higher compressive strength than the CFA graphite/epoxy composites. To further pursue this issue, the failure mechanisms were examined using a scanning electron microscopy (SEM). The failure modes of CFA graphite/epoxy and S2/8552 glass/epoxy composites were examined using a JEOL, JSM-6330F scanning electron microscopy (SEM). To enhance the conductivity, the failure samples were sputter coated with gold film. The microscope was operated with probe current of 8µA and at an accelerating voltage of 15kV. The experiment was performed in a vacuum chamber with a base pressure of about 9.63×10⁻⁵MPa. The samples were imaged at magnification from 300 × to 3500 × and the SEI (Secondary Electron Image) resolution was 1.5nm. Figure 14 illustrate the failure specimens of CFA graphite/epoxy and S2/8552 glass/epoxy composites tested at nominal strain rate of 10-4/s, respectively.. It was. depicted that in both material system, the failure mechanism of the specimens is dominated by out-of-plane shear failure along the plane with around 30 degree to the loading direction. The certain degree ( α ) between failure plane and loading axis was the average value of measured failure angles as shown in Figure 14. By looking closely on the failure surfaces of the specimens using SEM, there are two distinct failure mechanisms observed in the S2/8552 glass/epoxy and CFA graphite/epoxy composites, respectively as shown in Figures 15-16.. For S2/8552 glass/epoxy composites the SEM. photographic illustrates that lots of fibers are still surround with the matrix after the failure occurs indicating matrix shear failure is the primary failure mechanism. However, for CFA graphite/epoxy composites, smooth surfaces of fiber and matrix grooves were observed on the failure specimens, and as a result, the interface failure (cohesive bonding failure) between the fiber and matrix is the dominant failure 11.
(21) mechanism.. The difference of the failure mechanism could be responsible for the. significant distinction of the transverse compressive strength of the two material systems. Apparently, the weaker cohesive bonding would dramatically reduce the transverse compressive strength of the composites.. In view of the forging, it was concluded that. the matrix shear strength as well as the associated cohesive bonding with fibers plays an important role on the transverse compressive strength of the composites.. In addition,. since out-of-plane shear is the major failure mechanism as composites is subjected to transverse loading, the measurement of the out of plane plan shear strength of fiber composites could be accomplished by performing transverse compressive tests. Because of the improper adhesion between the fiber and matrix in the current CFA graphite/epoxy composite system resulting in lower transverse compressive strength, we resort to other different graphite/epoxy material denoted by PPG A15037L graphite/epoxy composites in the thesis. The material fabrication and experimental process were described in Appendix A together with the associated results.. In addition,. the SEM micrographics on the failure surface of PPG graphite/epoxy composites were presented in Appendix A. It can be seen that due to improved interfacial bonding in the PPG graphite/epoxy composites system, the transverse compressive strength is increased accordingly. In the next section, the effect of interfacial bonding between the fiber and matrix on the out-of-plane shear strength will be presented. The associated out-of-plane shear strength of the fiber composites were calculated from the transverse compressive tests. Moreover, the in-plane shear strength will be discussed corresponding to different interfacial bonding.. 12.
(22) Chapter 3 Out of plane shear strength 3.1 Shear failure stress Experimental results demonstrated that transversal compression failure was a result of out-of-plane shear failure along a plane oriented with a certain degree ( α ) to the loading direction. It is noted that, due to the transverse axial stress σ u , there are two stress components generated on the failure plane, i.e. normal stress σ n and shear stress τ .. The correlation is shown in Figure. 17. To extract the true out-of-plane shear strength from the compression tests, it is required to account for the normal stress effect. A Mohr-Coulomb type criterion [12]. τ = τ 0 + µσ n. (3.1). was adopted to represent the out-of-plane failure of unidirectional composites subjected to transverses loading, where τ 0 is the true out-of-plane shear strength without the presence of normal stress, and µ is the coefficient of internal friction.. Moreover the normal stress σ n and the shear stress τ. were computed from the uniaxial stress σ u. through the coordinate. transformation law as. σ n = σ u sin 2 α τ = σ u sin α cos α. (3.2). where α is the angle between the failure plane and loading direction as shown in Figure 17. By substituting eqn (3.2) into eqn (3.1), the relation between the out-of-plane shear strength τ 0 and the axial compressive stress. σ u was derived as 13.
(23) τ0 1 = [sin 2α − µ (1 − cos 2α )] σu 2. (3.3). Eqn (3.3) should have a minimum value when axial compressive stress. σ u achieves its maximum value (the transverse compressive strength). In other words, the derivative of equation (3.3) with respect to α should be equal to zero at the incipient of compressive failure taking place.. ∂ ∂α. τ 0 =0 σ u . (3.4). From eqn (3.4), the coefficient of internal friction µ was expressed as. µ=. 1 tan 2α. (3.5). It is noted that from experimental observation, the failure plane orientation is not affected significantly by the strain rate and thus the coefficient of internal friction µ is not sensitive to strain rate.. Substitution. eqn (3.5) into eqn (3.3) provides the result of the out-of-plane shear strength expressed in terms of the failure plane orientation α and the transverse compressive strength σ u as. τ0 =. σu. (3.6). 2 cot α. As a result, once the failure plane orientation and transverse compressive strength were measured from the experiments, the pure out-of-plane shear strength can be calculated using eqn (3.6). Moreover, since the transverse 14.
(24) compressive strength is quite dependent on strain rate, the out-of-plane shear strength should also be sensitive to strain rate.. 3.2 Shear strain rate In order to properly describe the rate sensitivity of the out-of-plane shear strength, the associated shear strain rate on the failure plane should be evaluated. The shear strain rate can be converted from the axial strain rate through the coordinate transformation law as follows. 2 ′ cos2 α sinα cosα ε&22 ε&22 ε&22 sin α 2 2 ′ = [Tε ]ε&33 = cos α − sinα cosα ε&33 sin α ε&33 γ&′ γ& − 2sinα cosα 2sinα cosα sin2 α − cos2 α γ& 23 23 23 . (3.7). In eqn (3.7), the prime coordinate is coincided with shear failure plane, while the un-prime system is defined based on the loading direction as shown in Figure 18. The α is the angle between the failure plane and the loading direction. From figure 18, it is easy to realize that the shear strain rate on the failure plane is indicated as γ&23′ and the explicit form can be expressed as. γ&23′ = 2 sin α cos α ⋅ (ε&22 − ε&33 ) = sin 2α ⋅ (ε&22 − ε&33 ). (3.8). where ε&22 and ε&33 are the axial strain rates in the x2 and x3 direction, respectively. To calculate the shear strain rate, it is required to have the information about the two strain components.. One way to achieve this goal is. directly mounting two strain gages orthogonally on the specimen and then recording the two strain components respectively during the transverse compression test.. However, there is an alternative way that only ε&22. component was measured, from which the other strain rates ε&33 can be derived using viscoplasticity theory. The following would demonstrate the procedure regarding the derivation of ε 33 and then the analytical result will be compared with the experimentally measured strain history at nominal stain 15.
(25) rates 10-4/s and 10-2/s in Figure 19 and 20. The strain rate component ε&33 was decomposed into elastic and plastic parts. For the elastic part, it is calculated from the Poisson’s ratio effect of the elastic deformation in ε&22 .. However, the plastic portion is described using. the flow rule in conjunction with an appropriately selected plastic potential. The 3-D plastic potential suitable for modeling plastic flow in anisotropic fiber composites has been proposed by Chen and Sun [18].. Using a. micromechanics analysis, they showed that hydrostatic stresses could produce plastic deformations, but uniform dilatation does not result in any plastic flow. If the composite is assumed to be transversely isotropic on the x2 – x3 plane and also linear elastic in the fiber direction, then this 3-D plastic potential can be reduced as. ( ). f σ ij =. [. (. 1 (σ 22 − σ 33 )2 + 4σ 232 + 2a66 σ 132 + σ 122 2. )]. (3.9). where a66 is a coefficient indicating the anisotropy in plasticity and σ ij is the stress components in the material principal directions.. Furthermore, if we. assume the plane stress on the x2 – x3 plane, the 3-D plastic potential given in eqn (3.9) were reduced to. ( ). f σ ij =. 1 (σ 22 − σ 33 )2 + 2σ 232 2. (3.10). Through the flow rule,. ε&ijp =. ∂f & λ ∂σ ij. (3.11). together with the plastic potential, the corresponding plastic strain rates were 16.
(26) expressed as. ε&22p σ 22 − σ 33 p ε&33 = σ 33 − σ 22 λ& γ& p 4σ 23 23 . (3.12). For unidirectional composites subjected to only transverse loading, σ 22 , the above formulations were reduced into. ε&22p = −ε&33p = σ 22 λ&. (3.13). γ&23p = 0. (3.14). It is noted that, from eqn (3.13), the plastic deformation in x3 direction is the same as that in the x2 direction but containing negative sign. Thus, when ε&22p is measured, the ε&33p could be obtained from eqn (3.13).. In. compressive failure test, the total strain histories ε&22 were obtained from the strain gage signals mounted directly on the specimens. By subtracting the elastic part from the total strain rate, the plastic strain rate is given by. ε&22p = ε&22 −. σ& 22. (3.15). E2. The above equation could also be considered as the plastic strain rate in the x3 direction. It is important to note that the total strain rate and stress rate in eqn (3.15) are calculated by taking the time derivative of the stress and strain curves, respectively at the instance of out-of-plane shear failure. By including the elastic part, the total strain rate in the x3 direction can be derived as. 17.
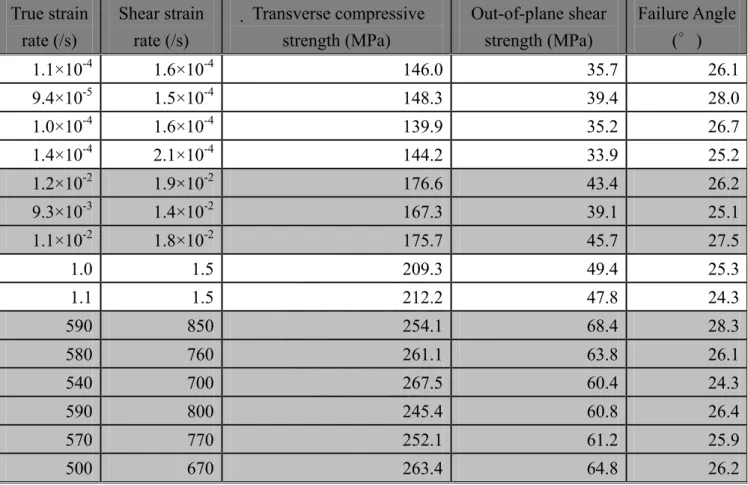
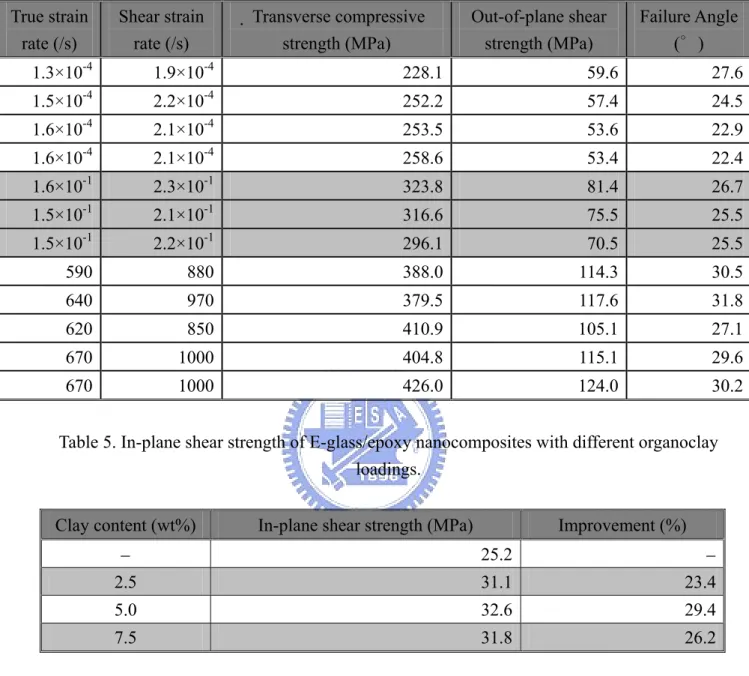
(27) ε&33 = −. σ& 22 E2. ν 23 − ε&22p. (3.16). where ν 23 is the Poisson’s ratio in the x2 and x3 plane. Thus by using eqns (3.8) and (3.16), the shear strain rate on the failure plane can be calculated with the experimentally measured uniaxial stress and strain histories.. 3.3 Result and discussion Base on Mohr-Coulomb type criterion, the out-of-plane shear strength could be expressed as a function of transverse compressive strength and failure plane orientation. In addition, through the forging derivation, the corresponding shear strain rate was calculated from axial strain rate. Table 3 showed the values of out-of-plane shear strength associated with its shear strain rate. From Table 3, the out-of-plane shear strengths versus the shear strain rate for CFA graphite/epoxy composites were plotted in Figure 21. Apparently, the out-plane shear strength increases with the increment of the shear train rates.. Again, a semi-logarithmic function in terms of the. normalized shear strain rate was employed to describe the rate dependence of the out-plane shear strength.. It is noted that in Figure 21 γ&s is the. quasi-static shear strain rate and assigned to be 1.56×10⁻⁴/s in the analysis.. In. the same manner, the results for the S2/8552 glass/epoxy composites were summarized in Table 4 and the result were plotted in Figure 22. The rate dependent tendency of out-of–plane shear strength can be modeled with a semi-logarithmic function as shown in Figure 22.. 18.
(28) Chapter 4 Compressive failure of off-axis epoxy/clay fiber nanocomposites. In the precious chapters, it was indicated that the transverse compressive failure of fiber composites is mainly controlled by matrix properties and its adhesion to the surrounding fibers.. The observation implies that the. transverse compressive strength of composites can be improved if the corresponding matrix properties are enhanced.. With the development of the. nanotechnology, the fiber/epoxy composites modified with organoclay may become a possible potential material for achieving the goal.. To understand. the compressive strength of the off-axis fiber/epoxy nanocomposites and its corresponding failure mechanism, the samples will be prepared and tested in compression by using the same method presented previously.. 4.1 Glass fiber/epoxy nanocomposite preparation. The epoxy resin used in this study is diglycidyl ether of bisphenol A (DGEBA, EPON828 with an epoxy equivalent weight of 187) supplied by Resolution. Performance. Products.. The. curing. agent. is. a. polyoxypropylenediamine (Jeffamine D-230 with a molecular weight of 230) provided by Huntsman Corp.. The clay used for the synthesis of. nanocomposites is organoclay (Nanomer I.30E), obtained from Nanocor Inc. It is basically an octadecyl-ammonium ion surface modified montmorillonite 19.
(29) mineral designed to be easily dispersed into amine-cured epoxy resin and to form nanocomposites as well [19]. When preparing the epoxy-organoclay nanocomposite samples, the organoclay clay was dried in the vacuum oven for 6 hours at 90˚C in order to remove containing moisture, and then blended with EPON828 at 80˚C for 4 hours using a mechanical stirrer. The mixture was then sonicated using a sonicator (provided by Misonix, Sonicator® 3000) with cooling system around the sample container until the compounds become transparent.. The epoxy-organoclay mixture was degassed at room. temperature in a vacuum oven for ten minutes and mixed with curing agent (32 wt% of EPON828).. It is noted that when epoxy-organoclay mixture contains. high organoclay loading, the viscosity would become higher and retard the degassing process. More degassing time is required to effectively eliminate the embedded bubbles. The mechanical stirrer was again utilized to blend the final mixture at room temperature for ten minutes.. Vacuum assisted hand lay-up procedures were adopted for preparing the fiber/epoxy nanocomposites.. The final mixture of organoclay/epoxy together. with curing agent prepared as described earlier was poured on one dry unidirectional glass fiber layer (provided by Vectorply, E-LR 0908-14 unidirectional E-glass fiber).. The resin was impregnated into the dry fiber by. using hand roller. Then, another ply of dry fiber was stacked on it. The repeating process continued until the 18 layer glass fiber nanocomposites were fabricated. The fiber stack was sandwiched between two steel plates with 20.
(30) porous fabric separator on the surfaces and then sealed within a vacuum bag. Subsequently, the whole laminates were cured in a hot press at 100˚C for 3 hours with additional 3 hours at 125˚C for post-curing under vacuum conditions. In the study, the nanocomposites containing 2.5%, 5% and 7.5% loadings (by weight) of organoclay were prepared, respectively. It is noted that vacuum is essential for forming nanocomposites since it can facilitate the removal of the tiny bubbles trapped in the nanocomposites during the processing. However, when the nanocomposites contained high organoclay loading (7.5 wt %), it was a challenging task to efficiently remove the bubbles even if the vacuum system was applied.. 4.2 Compression tests of glass fiber/epoxy nanocomposites. Off-axis block E-glass/epoxy nanocomposite specimens with dimension of 10.0×6.0×6.0 mm were employed for compression tests.. The block. specimens were cut from 18-ply unidirectional E-glass/epoxy nanocomposites using diamond wheel, and then lapped on a lapping machine with 14.5 µm abrasive slurry to have smooth and flat loading surfaces as presented previously in Chapter 2. Compressive loading were applied on the specimens by using the servo-hydraulic MTS machine presented previously in Chapter 2. The nominal strain rate in this chapter was 1×10⁻⁴/s, hence the stroke rate was set in 10-3mm/s by MTS controller. During the tests, the applied load and 21.
(31) displacement histories were recorded using MTS software (Basic Testware). The associated peak values in the loading curves were measured as the failure stress of the specimens.. Experimental results indicated that for the 30o and 45o specimens, in-plane shearing is the major failure mode. Figure 23 and 24 depicts the in-plane shearing failure mechanism for both 30 and 45 degree E-glass/epoxy nanocomposites and conventional E-glass/epoxy composites. However, for the 15o specimen, the failure was dominated by fiber microbuckling.. In. addition, for off-axis specimens with off-axis angles greater than 45°, out of plane shear failure would take place. To evaluate the in-plane shear strength, the failure stress associated with in-plane shear failure was of interest. For off-axis specimens subjected to uniaxial loading, the in-plane shear stress σ 12 is always accompanied by the transverse normal stress σ 22 . Through the coordinate transformation law, the axial compressive failure stress can be decomposed into transverse normal stress and shear stress in the principal material directions. Thus, the state of failure can be expressed in terms of the combination of σ 12 and σ 22 as shown in Figure 25. The results of Figure 25 can be regarded as the in-plane shear strength of the composite with the presence of transverse normal stresses. It is noted that the transverse normal stress has little effect on the failure shear stress and that the effect of transverse normal stress on the in-plane shear strength seems to be weakly proportional to. 22.
(32) the compressive stress σ 22 . Thus, the pure in-plane shear strength can be obtained by extending the straight lines to the vertical axis corresponding to. σ 22 = 0. For. the. measurement. of. transverse. compressive. strength,. the. unidirectional block E-glass/epoxy nanocomposite specimens were tested in transverse direction (10 mm direction). The corresponding failure specimens for E-glass/epoxy composites and E-glass/epoxy nanocomposites with 2.5% and 5.0% concentration of organoclay were illustrated respectively in Figure 26. It is depicted that in these material systems, the failure of the specimens is dominated by out-of-plane shear failure occurring on the plane orientated around 36 degree with respect to the loading direction.. Similar failure. behaviors have also been observed in other polymeric composites [7].. 4.3 Result and discussion. The pure in-plane shear strengths of E-glass/epoxy nanocomposites versus various organoclay concentrations were summarized in Table 5. It was shown that the E-glass/epoxy nanocomposites demonstrate higher failure stress than the conventional one without any organoclay included. Moreover, the in-plane shear strength increases with the increase of organoclay concentrations up to 5wt %, and thereafter, it become decreasing. The similar tendency was also observed in the transverse compressive strengths which were plotted versus the organoclay concentration in Figure 27. 23. It is noted that,.
(33) in Figure 27, there are four specimens tested corresponding to each organoclay concentration.. The average values of the transverse compressive strengths. obtained from different specimens with the same organoclay loading were listed in Table 6. Again, it appears that for E-glass/epoxy nanocomposites, their failure stresses are relatively higher than those of the conventional one without any organoclay included. SEM observations on the failure surfaces of 30 o and 45 o conventional composites and E-glass/epoxy nanocomposites are shown in Figure 28 and 29.. Smooth fiber surfaces and clear matrix grooves. are found on the failure surfaces, which indicate that interfacial debonding (cohesive bonding failure) between fibers and the surrounding matrix is the dominant failure mechanism for both material systems.. Moreover, the same. failure mode was also found in the transverse compressive failure specimens as shown in Figure 30.. Thus, for E-glass/epoxy nanocomposites, the. corresponding improvement in both in-plane shear strength and transverse compressive strength could be a result of the enhanced interfacial bonding improved by the dispersed organoclay. However, for the nanocomposites with 7.5 % organoclay, the failure stress is on the decline. This reduction could be attributed to the cavities/defects generated possibly during the material processing since it is difficult to fully degas the compound with higher viscosity.. 24.
(34) Chapter 5 Summary Unidirectional composites were tested to failure at various strain rates. Experimental results reveal that the transverse compressive strength increases with the increment of strain rate for both CFA graphite/epoxy and S2/8552 glass/epoxy composites. Furthermore, the transverse compressive strength could be expressed as a semi-logarithmic function in terms of the normalized strain rate. The failure was found to initiate at around 25-35∘between the shear failure plane and the loading direction. SEM micrographics on failure surfaces indicate that for CFA graphite/epoxy, the fiber/matrix debonding is the dominant failure mode; however, matrix failure is the main failure mechanism in the S2/8552 glass/epoxy composites. The fiber/matrix debonding can significantly reduce the transverse compressive of fiber composites.. Moreover, for PPG A15037L graphite/epoxy composites, due to the. improvement of the interfacial bonding, apparently the corresponding transverse is increased as compared to the CFA graphite/epoxy composites. According to the Mohr-Coulomb type criterion together with the angle of shear failure plane, the out-of-plane shear strength was calculated. Base on viscoplasticity theory, the shear strain rate was evaluated. It was found that the out-of-plane shear strength was also significantly affected by a shear strain rate. Again, the out-of-plane shear strength was modeled using a semi-logarithmic function in terms of the normalized shear strain rate. In addition, for E-glass/epoxy composites and nanocomposites, it was found that the corresponding in-plane shear strength and transverse compressive strength was enhanced which could be a result of the modified interfacial bonding improved by the dispersed organoclay.. 25.
(35) Reference [1] Rosen, B. W. 1965 “Mechanics of Composite Strengthening,” Fiber Composites Materials, Seminar at American Society of Metals, pp. 37-75. [2] Sun, C. T. and Jun, A. W. 1994 “Compressive Strength of Unidirectional Fiber Composites with Matrix Non-linearity,” Composites Science and technology. Vol. 52, No. 4, pp. 577-587. [3] Sun, C.T. and Tsai, J. 2004 “Dynamic Compressive Strengths of Polymeric Composites,”. International Journal of Solids and Structures, Vol. 41, No. 11, pp. 3211-3224. [4] Budiansky, B. 1983, “Micromechanics,” Computer and Structures, Vol. 16, No. 1, pp. 3-12. [5] Budiansky, B. and Fleck, N. A. 1993 “Compressive Failure of Fiber Composites,” Journal. of the Mechanics and Physics of Solids, Vol. 41, No. 1, pp. 183-211. [6] Collings, T. A. 1974 “Transverse compressive behaviour of unidirectional carbon fibre reinforced plastics,” Composites, Vol. 5, No. 3, pp. 108-116. [7] Bazhenov, S. L. and Kozey, V. V. 1991 “Transversal compression fracture of unidirectional fibre-reinforced plastics,” Journal of Materials Science, Vol. 26, No. 10, pp. 2677-2684. [8] Newaz, G. M. and Majumdar, B. S. 1993 “Failure modes in transverse metal-matrix composite lamina under compression,” Journal of Materials Science Letter, Vol. 12, No. 8, pp. 551-552. [9] Lowe, A. 1996 “Transverse compressive testing of T300/914,” Journal of Materials. Science, Vol. 31, No. 4, pp. 1005-1011. [10] Hsiao, H. M., Daniel, I. M. and Cordes, R. D. 1998 “Dynamic Compressive Behavior of Thick Composite Materials,” Experimental Mechanics, Vol. 38, No. 3, pp. 172-180.. 26.
(36) [11] Hsiao, H. M., Daniel, I. M. and Cordes, R. D. 1999 “Strain Rate Effects on the Transverse Compressive and Shear Behavior of Unidirectional Composites,” Journal of. Composite Materials, Vol. 33, No. 17, pp. 1620-1642. [12] Vural, M. and Ravichandran, G. 2004 “Transverse Failure in Thick S2-Glass/Epoxy Fiber-reinforced Composites,” Journal of Composite Materials, Vol. 38, No. 7, pp. 609-623. [13] Guden, M. and Hall, I. W. 1998 “Quasi-static and dynamic compression behaviour of an FPTM alumina-reinforced aluminium metal matrix composite,” Journal of Materials. Science, Vol. 33, No. 13, pp. 3285-3291. [14] Hall, I. W. and Guden, M. 2000 “High strain rate deformation behavior of a continuous fiber reinforced aluminum metal matrix composite,” Computers and Structures, Vol. 76, No. 1-3, pp. 139-144. [15] Sih, G. C. and Skudra, A. M. 1985 Handbook of Composites, Vol. 3, Elsevier Science Publishing Company, Inc. New York. [16] Ninan, L., Tsai, J. and Sun, C. T. 2001 “Use of split Hopkinson pressure bar for testing off-axis composites,” International Journal of Impact Engineering, Vol. 25, No. 3, pp. 291-313 [17] Graff, K. F. 1975 Wave motion in elastic solids, Ohio State University Press. [18] Chen, J. L. and Sun, C. T. 1993 “A plastic potential function suitable for anisotropic fiber composites,” Journal of Composite Materials, Vol. 27, No. 14, pp. 1379-1390. [19] Nanocor Inc., Technical data sheet. [20] Bing, Q. and Sun, C. T. 2004 “A Technique for high strain rate SHPB testing of off-axis carbon fiber composites,” the 11th European Conference on Composite Materials, Rhodes, Greece.. 27.
(37) Appendix A. Investigating rate dependent behavior of PPG A15037L graphite/epoxy composites.. In this appendix, the rate sensitivity of the failure strength of PPG material subjected to transverse and off-axis loading will be investigated and the results will be in comparison to the CFA graphite/epoxy material presented early in Chapter 2. In addition, the associated failure mechanism for the material system will be determined using SEM microscopy.. A.1 Specimen Preparation of PPG Graphite/Epoxy Composites. Forty five ply prepreg of unidirectional PPG graphite/epoxy composite (from Ad group, Taiwan) were laid up and the final lay-up is 6.5 mm thick.. It is noted that in the composite. material system, the fiber is HTA-12K (from Toho Tenax, Japan) and the epoxy type is Bisphenol A, Novalak, and rubber modified epoxy. In addition, the fiber volume fraction is 65.23%. With the appropriate curing process, the laminate had been cured in hot press. The curing process includes two steps, in which the first was heating from room temperature to 90℃ in fifteen minutes then continuing thirty minutes and the second was continuing in 28.
(38) constant temperature for sixty minutes after heating up to 145℃. The pressures were 75.85psi and 142.13psi respectively for the duration of curing process, and it resulted in about 6.0 mm laminate. The edges of the laminates were cut out using a cutting machine. The off-axis block specimens had the dimensions of 10.0×6.0×6.0 mm and were cut from the laminates using the precision diamond saw (IsometTM 1000 Precision Saw). The fiber orientations considered included 15, 30, 45 60 and 90 degrees with respect to the loading direction. The specimens were lapped on a lapping machine (Secular LM15) with the 14.5 µm abrasive slurry ® (EXTEC aluminum oxide power) to ensure having smooth, flat and parallel loading surfaces.. In order to reduce the friction on loading surfaces of specimens, both contact surfaces were coated with titanium layer by DC sputter machine (ULVAC Co. Japan). First, the specimens were adhered on the wafer in order to be coated in the sputter. Subsequently, Argon gas flow rate, deposition pressure, deposition rate and bipolar dc power were kept constant at 170 sccm (standard cubic centimeter per minute), 2.6×10⁻³Pa, 8.56nm/min and 300W, respectively. After coating on the surfaces, the other sides of the surfaces were exchanged to adhere on the wafer. According to the same process, both loading surfaces of all specimens were coated with a 1.2μm titanium film.. 29.
(39) A.2 Compressive Failure Test A.2.1 Low strain rate test Uniaxial compression tests were performed on the off-axis specimen using a servo-hydraulic MTS machine with a self-adjusting device as described in Chapter 2. The experiments were conducted under stroke control at three different displacement rates 10-3mm/s, 0.1mm/s and 10mm/s. The nominal strain rate was the stroke rate of the loading frame divided by the original specimen length. The true strain histories were measured with strain gages mounted diametrically opposite to each other on the block specimens. The corresponding true strain curve corresponding to the nominal strain curve are shown in Fig A-1 for the 15o specimen at displacement rate 10-3mm/s. The average true strain rate was taken a slope from t = 5s (the moment of initial deformation) to t = 690s (the moment of specimen failure), and the final true strain rate was taken a slope at the instant of specimen failure. However, if the gages are debonding from the specimens before the failure takes place, the strain rate at the point of the gage failure was considered as the final true strain rate, since the strain rate is not varied appreciably afterward.. A2.2 High strain rate tests High strain rate compression tests were performed on block specimens using SHPB, the 30.
(40) same apparatus described in Chapter 2.. It is noted that for testing the off-axis specimens, the. shear-extension coupling takes place under axial deformation.. This behavior combined with. bar-specimen interfacial friction could give rise to inhomogeneous deformation in the specimen, which deviates from the conventional Hopkinson bar assumption.. To reduce the. contact friction, all test specimens were lapped and lubricated as suggested by Ninan et al. [16].. The lapping and lubricating process work well for the glass/epoxy composites,. however, for graphite/epoxy composites, due to stiffer graphite fiber, the contact friction is still remained and more surface treatments on the specimens is required to reduce the contact frictions. Bing and Sun [20] suggested surface coating with a thin titanium film may dramatically reduce the friction between the specimen and loading fixture during SHPB test. Thus, all specimens were coated with a 1.2μm titanium film using sputtering technology presented previously. To verify that the thin film coating on the specimen surfaces can significantly reducing the contact friction, bending wave testing was conducted on the SHPB [20] shown in Fig A-2. It is noted that in the bending wave tests, the gun barrel pressure is 40 psi, the copper pulse shaper is 1.50 mm thick, and the excitation voltages of the Wheatstone bridge circuits were 5.0V for gage A, B and C, respectively. Both gain factors in amplification were set at 500 for both conventional incident and transmission bar signals, and at 1500 for measuring. 31.
(41) bending wave.. The filter was set the same in the WB (wide-band) position to acquire the. unfiltered output signals. Figure A-3 demonstrates the bending wave detected in the transmission bar for 15o specimen with titanium coating.. For comparison, the 15o specimen. without coating is also tested in the same manner and the result is shown in Figure A-4. It was illustrated that with the titanium coating, the magnitude of the bending wave is significantly diminished, implying the effect of contact friction is almost neglected.. The. high strain rate stress and strain curves for the off-axis specimens were established by the SHPB. During the 30o off-axis SHPB test, the gun barrel pressure is 45 psi, the copper pulse shaper is 1.50 mm thick, and the excitation voltages of the Wheatstone bridge circuits were recommended to set at 3.0V. for specimen gage and 5.0V. for gage A and B. Both factors of amplification were set at 400 to gain the signals of incident and transmission bar from the relative circuit, and the factor was set at 20 for the specimen gage. The filter was set the same in the WB (wide-band) position to acquire the unfiltered output signals. Figure A-5 shows typical strain gage signals for 30o specimen measured from the incident and transmission bars and the specimen, respectively. The contact force P1 between the incident bar and the specimen and P2 between the specimen and the transmission bar were extracted from the experimental data and the results are presented in figure A-6. Figure A-7 shows the strain-time curve for the 30o off-axis specimen obtained from the SHPB test.. 32. The time period for.
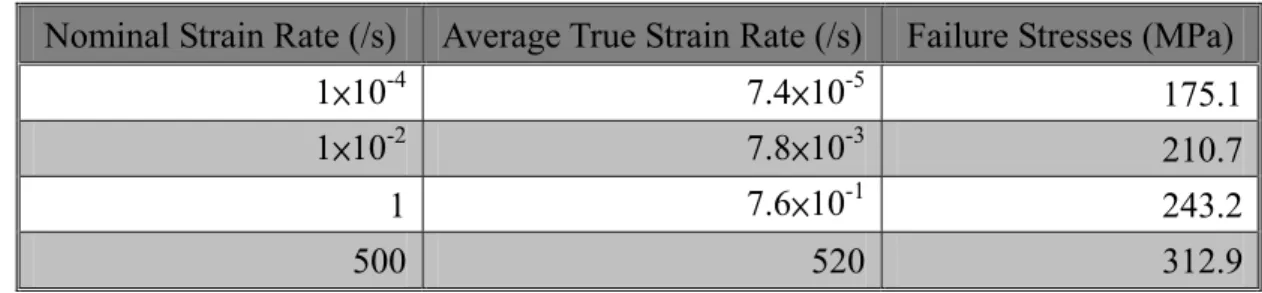
(42) averaging the strain rates was selected from t = 25µs to t = 100µs . The corresponding. results were also summarized in Table A-1.. A.3 Result and discussion The stress-strain curves for 15o, 30o, 45o and 60o off-axis specimens obtained from both high and low strain rate tests were shown in the Figures from A-8 to A-11. The average axial strain rates for high strain rate tests are within the range of 200/s and 600/s. The transverse behaviors of unidirectional PPG graphite/epoxy composites obtained from the compression tests at various strain rates are shown in Figure A-12, which is mainly of concern in this study. The failure stresses were listed in Table A-2. It was found that the transverse compressive strength of the unidirectional PPG graphite/epoxy composites was obviously stronger than CFA graphite/epoxy composites presented previously in Chapter 2. The failure specimens were examined using a scanning electron microscopy (SEM) to further understand the failure mechanism.. Figure A-13 and A-14 illustrates the failure mechanisms observed in. 30o and 90o specimens of PPG graphite/epoxy composites tested at nominal strain rate of 10-4/s and 1/s, respectively. Similarly, figure A-15 was shown at high strain rate in the SHPB test. In contract to CFA material system discussed in Chapter 2, it was observed that for PPG material system, there is still matrix adhering on the fibers found on the failure. 33.
(43) specimens. This implies that the failure mechanism for the PPG is matrix failure together with the interfacial debonding between the fiber and matrix.. Apparently, the bounding. strength is increased which is quite compatible to the matrix shear strength.. This, the. increased behavior in the transverse compressive strength for PPG material system could be due to the enhanced the interfacial bounding between the fiber and matrix.. 34.
數據
+7
相關文件
The result indicated that the constitutive relationship among the flow stress, deformation temperature, and strain rate for IN 600 during hot deformation satisfied the
The analysis of biomechanics after the total hip replacement can be reached by comparing with the stress and strain distribution of the intact femur and “Tripot Stemless Total
These variables include different thermal/structural analyses, different stress/strain relations of the solder under specific strain rates, different creep model for the
Before reinforced concrete beam reach it’s ultimate strength, the distribution of flexural stress in section due to transverse external load has a strong relationship with
By synthesizing contents of the deep interviews with the related staffs, cooperating SWOT to analyze the strength, weakness, opportunity and threat of the transformable
Considering the influences of cost, times, and simplicity of the test, simple direct shear test (ASTM D 3080) was used to observe the effect of wetting on the variations of
Time course profiles of biodegradation of 4-µl ethyl acetate or toluene by strain F1, strain B5, and strain AC6 in suspension (square) or in immobilized cell beads (circle) at pH 7
Keywords: Temperature, Humidity, Carbon Nanotube, Epoxy, Composite, Fatigue, Ultimate Strength, Chemical Modification,
