國
立
交
通
大
學
生物科技系所
碩 士 論 文
利用酪氨酸酶電化學感測器檢測環境荷爾蒙
Detection of Endocrine Disrupting compounds
by a Tyrosinase Biosensor
研 究 生:趙偉志
指導教授:袁俊傑 博士
利用酪氨酸酶電化學感測器檢測環境荷爾蒙
Detection of Endocrine Disrupting compounds by a Tyrosinase
Biosensor
研 究 生:趙偉志 Student:Wei-Chih Chao
指導教授:袁俊傑 博士 Advisor:Dr. Chiun-Jye Yuan
國 立 交 通 大 學
生 物 科 技 系 所
碩 士 論 文
A Thesis
Submitted to Department of Biological Science and Technology
National Chiao Tung University
in partial Fulfillment of the Requirements
for the Degree of
Master
in
Biological Science and Technology
July 2007
Hsinchu, Taiwan, Republic of China
利用酪氨酸酶電化學感測器檢測環境荷爾蒙
學生:趙偉志
指導教授:袁俊傑博士
國立交通大學生物科技系暨研究所碩士班
中文摘要
內分泌干擾物,或者稱之為環境荷爾蒙,這一類的化學物質存
在於自然環境中或者是由工廠中所排放出,這一類的物質藉由模擬人
體內正常的荷爾蒙,去與體內的荷爾蒙接受器作用,進而造成我們人
體的內分泌不正常,他會直接刺激或抑制我們體內內分泌的機制,造
成我們人體的一些病變,他最主要會造成的疾病有:乳癌,睪丸癌,男
性精子數目下降,早熟,生殖和發育的不正常等等....。因此發展出一
種快速而且簡單的檢測方式,便使用了酪氨酸酶(tyrosinase),藉由
包埋的方式固定在碳膠電極(SPCE)的表面上形成一個電流式的生物
感測器,藉由電化學的方法來做為我們的檢測方式。Bisphenol A,
diethylstilbestrol, paraben 和 3-aminophenol 在文獻中說明了
它們具有環境荷爾蒙的性質,因此便拿來做為檢測的物質。在電化學
實驗中所施加的工作電位為-0.2V,結果所得到的檢量線範圍分別為
0.1 ~ 20 μM, 10 ~ 100 μM, 1 ~ 50 μM 和 20 μM 而偵側極限為
20 nM, 0.4 μM, 20 nM and 5 μM 分 別 對 Bisphenol A,
diethylstilbestrol, paraben 和 3-aminophenol 我們所用來做檢
Detection of Endocrine Disrupting compounds by a Tyrosinase
Biosensor
Student:Wei-Chih
Chao
Advisor:Chiun-Jye Yuan
Department of Biological Science and Technology
National Chiao Tung University
Abstract
Endocrine disrupt compounds (EDCs) or environmental hormones
are steroid-like compounds that exist in nature or are produced during
industrial process. EDCs, once ingested, may interfere with the functions
of normal endocrine system in both wildlife and humans. Hence, the
development of a quick and easy operating biosensing device is necessary.
In this study, an amperometric biosensor for the detection of endocrine
disrupt compounds based on tyrosinase entrapped within gelatin film is
designed and developed. The suspected endocrine disrupt compounds,
including bisphenol A, diethylstilbestrol (DES), paraben and
3-aminophenol, were tested on the developed biosensor. Amperometric
response of biosensor to EDCs in a phosphate buffer at pH 6 was
measured as a function of concentrations at fixed bias voltage of −0.2 V
versus Ag/AgCl. The electrode gives linear response ranges of 0.1 ~ 20
µM, 10 ~ 100 µM, 1 ~ 50 µM and 20 ~ 100 µM for bisphenol A,
diethylstilbestrol (DES), 3-aminophenol and paraben , respectively. The
detection limit for bisphenol A, diethylstilbestrol (DES), 3-aminophenol
and paraben are 20 nM, 0.4 µM, 20 nM and 5 µM, respectively. Moreover,
the developed biosensor exhibits a good reproducibility with a relative
standard devision (R.S.D) of 5.8 %.
Acknowledgment
首先感謝 袁俊傑老師在我碩士班的這兩年期間給予我的指導及
幫助,讓我能在碩士班的這兩年中獲得不少的收穫,以及實驗室學長
姐們對於我們學弟妹的照顧,使我的研究生這兩年的生活過的更加的
充實豐富,以及感謝口試委員 楊裕雄老師和 吳東昆老師給予我寶貴
的意見,最後感謝我的家人及女友對於我的支持及鼓勵。
Content
中文摘要... I
Abstract ... III
Acknowlegement ... IV
Content...V
Content of Tables... VI
Content of Figures...VII
Introduction...1
Material and Methodology... 10
Result and Discussion... 15
Conclusions………..26
Reference ... 28
Content of Tables
Table 1. Electrochemical characters of gelatin entrapment and
diazonium cation immobilization tyrosinase biosensor…...76
Table 2. Electrchemical characteristics of Tyrosinase/gelatin SPCE for
phenolic compounds…………..……….77
Table 3. Electrchemical characteristics of Tyrosinase/gelatin SPCE,
Tyr-CPE and Tyrosinase/gelatin GCE for catechol……...78
Table 4. Electrchemical characteristics of Tyrosinase/gelatin SPCE,
Content of Figures
Figure 1. Response of a redox couple during a potential cycle……….36
Figure 2. The Nernst diffusion layer………...………..37
Figure 3. Step responses of tyrosinase biosensor to sequentially added
1µM bisphenol A………...39
Figure 4. Stability of tyrosinase biosensor entrapped by different
percentage gelatin……….………..………..40
Figure 5. Reproducibility of tyrosinase biosensor with tyrosinase
entrapped in 4.67% gelatin………41
Figure 6. Effect of pH on the response of the tyrosinase biosensor…..42
Figure 7. Amperometric response of tyrosinase biosensor to 10 µM
bisphenol A at different applied voltages……….43
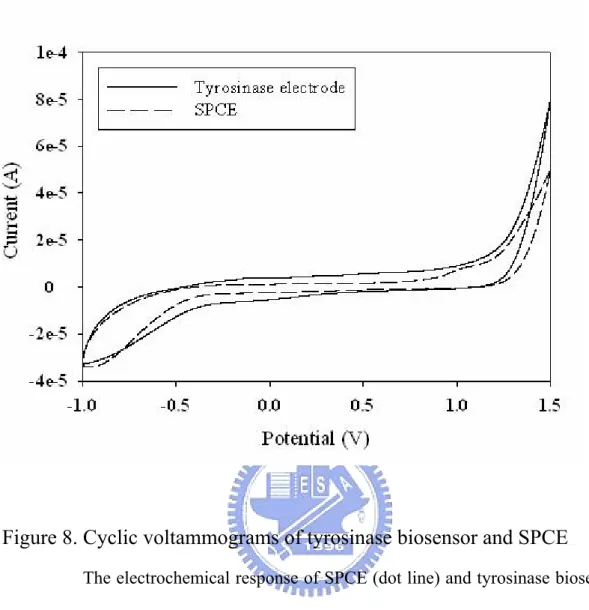
Figure 8. Cyclic voltammograms of tyrosinase biosensor and SPCE...44
Figure 9. Cyclic voltammograms of tyrosinase biosensor in the
presence of bisphenol A….………...45
Figure 10. Structure of endocrine disrupting compounds and phenolic
compounds……….………..47
Figure 11. Cyclic voltammograms of different EDCs on the fabracted
tyrosinase biosensor……….………...50
Figure 12. Response of bare SPCE to various EDCs………...……...52
Figure 13. Step responses of tyrosinase biosensor to various EDCs...54
Figure 14. Linear dynamic range of various EDCs on the developed
tyrosinase biosensor……….………57
Figure 15. Lowest detection limit of fabricated tyrosinase biosensor...60
Figure 16. Cyclic voltammograms of neurotransmitter on SPCE…...61
Figure 17. Linear dynamic range of dopamine of the tyrosinase
biosensor………...62
Figure 18. Lowest detection limit of fabricated tyrosinase biosensor
dopamine………..………63
Figure 19. Linear dynamic range of norepinephrine on the tyrosinase
biosensor……….……….64
Figure 20. Lowest detection limit of fabricated tyrosinase biosensor to
norepinephrine……….………65
Figure 21. Cyclic voltammograms of catechol on SPCE…………..…66
Figure 22. Step responses of tyrosinase biosensor to catechol………..67
Figure 23. Linear dynamic range of catechol on the the tyrosinase
biosensors………..………...68
Figure 24. Lowest detection limit of fabricated tyrosinase biosensors.69
Figure 25. Long-term stability of tyrosinase biosensor after storage…70
Figure 26. The cyclic voltammegrams of diazonium cation……...…..71
Figure 27. Cyclic voltammegrams of various mediators……...……....72
Figure 28. Cyclic voltammegrams of ferricyanide on SPCE and
modified electrode………73
Figure 29. Successive tested on tyrosinase/CMA/SPCE electrode…...74
Introduction
Endocrine disrupting compounds (1-5), either generated naturally or synthetically, were shown to disrupt the endocrine systems of human and animals. EDCs affect the endocrine system of hosts by mimicking or antagonizing the effects of hormones, altering the pattern of synthesis and the metabolism of hormones or by changing the level of hormone receptors. There is growing concern about synthetic EDCs in the household products, because they may interrupt the development of offspring, alter the metabolic system, and cause cancer. In the cosmetics, there are more than 3000 chemicals were used. Among them, more than 100 chemicals are known causing allergic responses in human. There is a big difference in regulating the usage of these chemicals in different countries. Some countries require the cosmetics and skin care products be labeled completely; while most of countries just ignore the potential threat of these chemicals. However, many chemicals used in household cosmetics influence human health even in a small amount. Thus, it is extremely important to pay attention to the usage of EDCs in the cosmetics, and household products
For example, bisphenol A (6-8), diethylstilbestrol (9-12), paraben (13-15) and 3-aminophenol (16, 17), are widely found in baby bottles, pharmacological products, comestics and hair dye, respectively. BPA is a solid chemical compound with a low
volatility and a solubility of 120-300 mg/l in water (18), whereas it can be greatly solubilized in a basic solution. Accordingly, about 50% of BPA in the environment associate with sediments or soils. BPA has been found to mimic the female hormone, estrogen, disrupting the chemical messenger system in the body even in a low level. BPA also exhibited estrogenic effect to the human breast cancer cell line MCF-7. It may exhibite its hormonal effects in as low as 2-5 ppb or (2-5 µg/l) (5). In addition, BPA is broadly used in industries as a precursor to manufacture polycarbonate and numerous plastic wares. The release of BPA from the plastic wares and materials used to line food and drink cans has received particular attention because of its biological disrupting effect. The leakage of BPA and related compounds from bottles, dental fillings and sealants is also the great concern.
Diethylstilbestrol (9), a syntheticestrogen, was widely used by pregnant women in the 1950s and1960s. Millions of pregnant women were given DES hope to prevent miscarriages and other problems. However, increasing reports indicated that women who took the drug exhibited an increasing risk of breastcancer (19-21). Girls whose mothers were given DES during pregnancy, termed DES daughters, were discovered to be at increased risk in malformations of the reproductive organs, infertility and miscarriages. DES daughters were also found to have increasing rate of cervical and viaginal cancers. DES sons, on the other hand, are predisposed to testicular
abnormalities, such as abnormally small testes and failure of the testes to descend into the scrotum, which increases the risk of testicular cancer. Apparently, women and the children of women who took DES are at risk for certain health problems. As a result, in 1971 the Federal Drug Administration (FDA) issued a warning that DES should not be given to pregnant women.
Parabens, such as propyl-paraben, ethyl-paraben and butyl-paraben, are commonly used in cosmetics and personal care products, including shampoos, skin creams and deodorants, as preservatives to suppress the growth of bacteria and fungi. However, they have been found to mimic estrogen in vitro and might function as endocrine disrupters. Parabens in Leave-on products, such as facial makeup and skin lotions, are of greatest concern because of the long exposure time and opportunity for ingestion via skin or mouth into the bloodstream. The estrogenic effects of parabens induces the risk of human for breast cancer (22). The role of parabens in the progression of breast cancer, however, is unknown. Currently, there is a trend to reduce the usage of paraben in the cosmetics, because of its potential in endocrine disrupting.
3-aminophenol and related compounds are aromatic amines that are widely used in hair dye and pesticide (17). Some of these aromatic amines have been found to associate with formation of bladder cancer in workers of the dye factories (23). Hair
dyes containing aromatic amines has been investigated by scientists for their potential carcinogenic effect. Aminophenol was reported to increase incidence of producing micronuclei in the bone marrow and splenocytes of mice (24, 25). Application of aminophenols in hair dyes results in human systemic exposure and may pose a potential genotoxic hazard to human health.
Conventionally, gas chromatography–mass spectrometry (GC–MS) (26, 27) and capillary electrophoresis (CE) (28-30) are two main analytical tools for the separation and measurement of EDCs. However, these methods are time-comsumming and expensive. Thus, a quick and easy method for the detection of EDCs seems to be necessary.
Biosensor is an analytical device by integrating the immobilized biologically active material, such as protein, enzyme, antibody, cells or tissues, with a transducer. The main function of a transducer is to convert the physical or chemical change produced by biologically active material into an electric signal. Based on the type of transducer used, biosensors have been divided into optical (31, 32), calorimetrical, piezoelectrical (33, 34) and electrochemical biosensors (35, 36). Electrochemical biosensors are based on the detection of electrochemically active species consumed and/or generated in the biological or chemical reactions. There are three types of electrochemical biosensors, such as, conductometric (37-39), potentiometric (40, 41),
and amperometric biosensors (42-46), are commonly developed. Screen-printing carbon paste electrode (SPCE) is very suitable for the fabrication of these types of biosensor due to its simplicity, low-cost, high reproducibility, and efficiency in mass production (47, 48). SPCE also exhibits a wide window potential, low background current, and suitability for different types of analysis (49), exhibiting a great potential in the construction of disposable sensing system.
In this thesis, we propose to fabricate a tyrosinase-based EDC biosensor for the detection of EDCs. Tyrosinase, also called polyphenol oxidase (EC 1.14.18.1), is a bifunctional enzyme that converts monophenols to o-diphenols (hydroxylase activity) and o-diphenols to o-quinones (50) (oxidase activity).
OH
OH
OH
Tyrosinase
O
2H
2O
Phenol
Catechol
OH
OH
O
O
O
2H
20
Catechol
Quinone
Tyrosinase
The o-quinones can be electrochemically reduced to o-diphenols under a low
over-potential (9, 51) without any electron transfer mediator. Many EDCs, such as
bisphenol A, Diethylstilbestrol, paraben and aminophenol, contain a phenolic functional group, by which a simple amperometric biosensor can be used for the measurement of phenolic EDCs.
Immobilization of biomolecules on a transducer is the key to the development of biosensors (52, 53). Although, the activity of immobilized enzyme may not be as high as it is in the solution, it can be stabilized to avoid thermal inactivation on often denaturing conditions (54). Enzyme can be adsorbed on electrode surface, by electrostatic interaction, Van der Waal’s force, hydrogen bonding. Physical adsorption (55, 56) is easy to prepare. The enzyme may retain its active conformation through physcial adsorption. However, since the interaction is weak, it may not be stable under different temperatures, pH values and ionic strengths. Even worse, enzymes may leak out from the electrode. Adsorption can be used as the first step for down streaming treatment, such as covalent modification and cross linking.
Affinity interactions between the enzyme and its substrate, a receptor protein and its ligand, or antigen-antibody pairs are often characterized by high association constants of the resulting complexes, which enabled the use of specific recognition interactions to construct protein layers on solid supports. In order to increase lifetime
of enzyme electrodes, a covalent linkage between enzyme and transducer is necessary (57). The hydroxyl groups of Ser, Thr and Tyr residues, the sulfhydryl group of cysteine and amino group of Lys and Arg are potential groups for cross-linking (58). The advantages of this type of immobilization are low diffusion rate and good stability under adverse conditions.
Enzymes can be immobilized by enzyme using intra- or intermolecular cross-linking of enzyme molecules (59, 60). This method is based on the formation of three-dimensional links between the biological material and bi- or multi- functional reagents. The resulting modified biological material is completely insoluble in water and can be adsorbed onto a solid surface. Glutaraldehyde (61) is one of the mostly used cross-linking reagents among cross-linking reagents for protein covalent bounding. Configuration based on multiple–layer deposition using glutaraldehyde as a cross-linking agent for enzyme immobilization is one of the most reported methods for the development of planar biosensing devices (59, 60). The resulting 3D network may affect the kinetics of entrapped enzymes and diffusion rate of substrates and products. An optimization between immobilization, preserving activity and maintaining the appropriate diffusion characteristics, should be performed.
Enzymes can also be trapped in to matrixes, such as gelatin (62-65), PVA-SbQ (66), silica sol-gel (67, 68), polyurethanes (69, 70), polyvinyl alcohol (71-73) and
carbon paste (74, 75), in which they can be well protected. One step preparation and good reproducibility are also advantages of this technique. However, enzyme entrapment may induce the probability of substrate access to the active site of enzymes. Therefore, the apparent activity of enzymes may decrease especially when the substrate is large. The leakage of entrapped enzymes may also pose a severe problem of this technique.
The electrochemical reduced diazonium cation has been reported to used as a bringing compound in the covalent bridging of enzymes on the surface of electrode (76-78). The electrochemically activated diazonium cation can covalently bind to surface of the graphitic carbon electrodes (Scheme1). Electrodeposition of diazonium cation can be demonstrated by direct and immobilization of proteins on the surface of electrodes.
This reaction (EDC/NHS) was triggered directly onto diazonium-modified proteins.
(Scheme2)
Screen-printed carbon paste electrode is commonly used in the fabrication of commercial biosensors. In this thesis, the development of a tyrosinase-based EDC biosensor is proposed for the measurement of endocrine disrupting compounds. An optimal condition for the construction of the tyrosinase/gelatin screen printed carbon paste electrode. An electrochemically reduced diazonium cation was also used to covalently immobilize tyrosinase on the surface of SPCE.
Material and Methodology
Reagents
Tyrosinase (EC 1.14.18.1) was purchased from Sigma. Bisphenol A (BPA), diethylstilbestrol (9), paraben, aminophenol were from Fluka. Sodium dihydrogenphosphate, disodium hydrogenphosphate and potasium dihydrogenphosphate were from Showa. Sodium chloride was from Amresco. Potasium chloride was from ICN. Potassium phosphate, dibasic was from Riedel-de Haën. Poly vinyl alcohol functionalized with pyridinium methyl sulfate (PVA-SbQ) was from Toyo Gosei Kogyo Co. Ltd., Japan. All solution was prepared by de-ionized distilled water. Screen-printed carbon paste electrode (SPCE) was from ApexBichem (Hsinchu, Taiwan).
All electrochemical experiments were performed on an electrochemical analyzer CHI 440 instrument (CH Instruments) connected to a personal computer. Electrochemical measurement was performed using SPCE as working electrode, Au as counter electrode and Ag/AgCl as reference electrode in a beaker containing 10 ml buffer solution (Appendix). The solution in the beaker was stirred at a fixed rate.
Preparation of enzyme electrode
Gelatin is a linear polypeptide that consists of different amounts of 18 amino acids and offers an unique set of characteristics in terms of gel-forming properties and hydrophilicity, Tyrosinase was immobilization in gelatin matrix crosslinked with formaldehyde. Screen printed carbon paste electrodes (SPCE) were pretreated by cyclic voltammetry (CV) with a potential range from -1.0 V to 1.0 V and scaning rate of 200 (mV/s) for 5 cycles.
The 1%, 3%, 5%, 7%, 9% gelatin stock solutions were prepared by dissolving gelatin powder in warm dd H2O. To prepare tyrosinase electrodes (79), 10 µl
formaldehyde solution was first added to 1 ml gelatin solution to generate a gelatin
pre-mixture. Next, mix tyrosinase stock solution (20 U/µl) with above gelatin pre-mixture in a ratio of 1:2. Finally, 6 µl of the above mixture was dropped on the surface of the SPCE and allowed to dry at 4 °C for 24 h.
An amperometric biosensor consists of three electrodes in a system. The first electrode is the working electrode, by which the electrochemical responses and measured. A number of noble metals are currently available for making working electrode, such as platinum, gold, silver, palladium, rhodium and iridium. The second electrode is the reference electrode that is taken as the reference standard against which the potential of the other electrodes present in the electrochemical cell can be measured. The third electrode is the counter or auxiliary electrode, which serves as a
source for electrons so that current can be passed from the external circuit through the electrochemical cell. Amperometric measurement is performed by applying a potential between a reference and working electrode and result in a cathodic or anodic current, which is co-related to the concentrations of electroactive analytes in the solution.
Enzyme immobilization by diazonium cation
A diazonium cation was first obtained by mixing 8 ml CMA (30 mM) 1 ml HCl
(2 M) 1 ml NaNO2 (2 M) in a 10 ml electrochemical cell. The aniline derivative of
CMA was diazotated in an aqueous solution for 10 min under stirring in ice-cold water. The diazonium solution prepared was then immediately used to perform electro-addressing on the surface of SPCE. Electro-addressing was achieved by directly depositing on the surface of carbon paste electrode. Ten cyclic voltammograms were carried out within a potential range of -0.7 V to 0.8 V at a scan rate 200 mV/s. After ten cyclic voltammogram, the electrode was then immersed in 0.1 M MES (2-morpholinoethanesulfonic acid) buffer, pH 6.0, containing 1-ethyl-3-[3-dimethylaminopropyl] carbodiimide hydrochloride (EDC) (0.4 mg/ml) and N-hydroxysulfosuccinimide (NHS) (0.6 mg/ml) with stirring for 1 h. After
in the phosphate buffer (pH 6.0) containing tyrosinase (1 mg/ml) at 4 ℃ for 24 h to allow enzymes to cross-link to the carboxylic group of CMA.
Cyclic Voltammetry (CV)
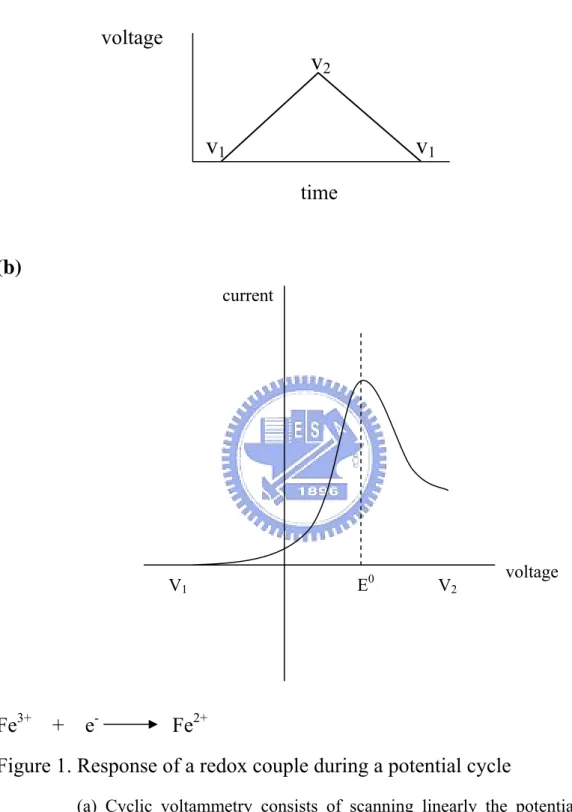
The linear sweep voltammetry (80, 81) (LSV) is a simple technique for electrochemical analysis. The potential range is scanned in one direction, starting at the initial potential and finishing at the final potential. A more commonly used variation of this technique is cyclic voltammetry (CV) (82, 83), which is usually used to study the electrochemical properties of enzyme electrode. In CV, the direction of the potential is reversed at the end of the first scan. Thus, the waveform is usually of the form of an isosceles triangle (Fig. 1a). The scan begins from the left hand side of the current/voltage plot where no current flows. As the voltage is swept further to the right (to more reductive values) a current begins to flow and eventually reaches a peak before dropping (Fig. 1b).
The characteristic peaks in the cyclic voltammetry are closely related to properties of the diffusion layer near the electrode surface. These parameters, including concentration gradients for the reactant and product at different times corresponding to the potential value (during the forward and reversed scans, respectively), and the achievement of a zero reactant surface concentration, affect the
characteristics of cyclic voltammograms. Note that the continuous change in the surface concentration is coupled with an expansion of the diffusion layer thickness (δ). The resulting current peaks thus reflect the continuous change of the concentration gradient with the time. Hence, the increase of the peak current corresponds to the achievement of diffusion control; while the current drop (beyond the peak) exhibits a t–1/2 dependence (independent of the applied potential). For the above reasons, the
reversal current has the same shape as the forward one.
Amperometric measurement of EDCs
Stock solution of 1 M EDCs (bisphenol A, diethylstilbestrol, paraben and 3-aminophenol) were fresh prepared.The experimental set up for electrochemical reaction is conventional three-electrode system with working electrode, counter electrode, reference electrode of tyrosinase electrode, gold and Ag/AgCl, respectively. The working potential was set at -0.2 V versus Ag/AgCl. After reaching a stead state background current, a given concentration of the EDC sample solution was injected into a reaction chamber containing 10 ml PBS solution using microsyringe. The measurement was stop when the reductive current reached a steady state. The response time was determined by at thetime when analyte was added from the time when 95% steady state current was reached (84) (Fig. 3).
Result and Discussion
Generation and characterization of enzyme electrode
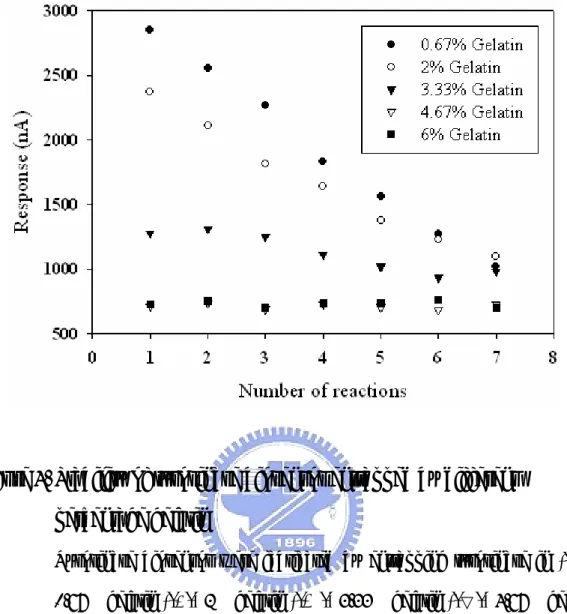
Before the construction of tyrosinase-based enzyme electrode, SPCE was pretreated with cyclic voltammetry within a potential range from -1.0 V to 1.0 V in PBS buffer for 5 cycles. The effect of different percentages of gelatin in the encapsulation of tyrosinase was studied by repetitively determine the electrochemical response of enzyme electrode to 10 µM bisphenol A. Therefore, the reproducibility of the enzyme electrode generated by using different percentages of gelatin (0.67%, 2%, 3.33%, 4.67% and 6%) to 10 µM bisphenol A was determined. The relative standard derivation (R.S.D) for EDC biosensors by entrapping tyrosinase in 0.67%, 2%, 3.33%, 4.67% and 6% gelatin were 35.52%, 28.06%, 13.66%, 2.86% and 3.15%, respectively (Fig. 4). This result suggests that the EDC biosensor fabricated by a Tyrosinase/4.67% gelatin matrix exhibited a good reproducibility for 10 µM bisphenol A. Thus, enzyme electrode fabricated by entrapping tyrosinase in 4.67% gelatin matrix on SPCE was used in subsequent experiments.
The electrochemical response of enzyme electrode was studied by repetitively determine its response to 1 µM bisphenol A 50 times. The overall average response current of the fabricated enzyme electrode was 113 ± 6.5 nA with a relative standard derivation of 5.8% (Fig. 5). The result showed that the average response current of the
first 10 reactions is 114 nA. The response reduced slightly after 50 measurements. The average response current of the last 10 reactions was 109 nA. The signal lost from the first 10 reactions to last 10 reactions is about 4.4%.
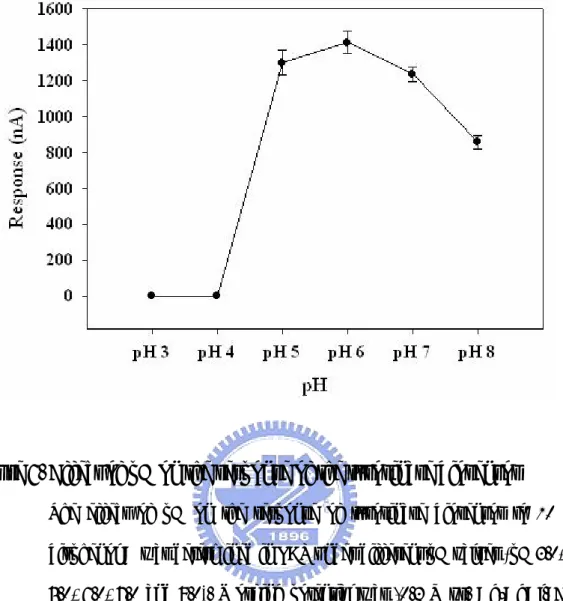
The optimal pH range for the electrochemical response of developed enzyme electrode was also studied in the pH range of 3 ~ 8 by using 10 µM bisphenol A as substrate (Fig. 6). The result showed that the response current of enzyme electrode increased with the increase of pH and reached maximum at pH 6. Therefore, pH 6 was chosen in the following experiments to determine the enzyme biosensor to various EDCs and phenolic compounds.
An optimal working potential is necessary to avoid noise generated from electroactive impurities in samples. To find out an optimal working potential for the determination of EDCs the electrochemical response of bisphenol A were performed under different working potentials (0, -0.1, -0.2, -0.3, -0.4 and -0.5 V). Bisphenol A (1 or 10 µM) was added into a 10 ml reaction cell, followed by an amperometric measurement. As shown in Fig. 7 the maximum response to 10 µM BPA occurred at -0.2 V and -0.3 V. The maxima currents at working potentials at -0.2 V and -0.3 V were 1615 ± 25 nA and 1593 ± 72 nA, respectively. In contrast, in the buffer, the electrochemical responses of enzyme biosensor were 38.9 ± 5.8 nA and 118 ± 12.1 nA at working potentials at -0.2 V and -0.3 V, respectively. These results indicate that
working potential at 0.2 V is optimal for detection of EDCs.
Cyclic voltammograms of enzyme electrode
The CV of enzyme electrode and bare SPCE in a pH 6.0 PBS buffer was performed within the potential range of -1.0 V ~ 1.5 V with a scanning rate of 100 mV/s (Fig. 8). The result showed that the enzyme electrode and SPCE exhibits similar cyclic voltammograms without substance, suggesting that the immobilization of tyrosinase did not affect the basal electrochemical response of SPCE. The cyclic voltammograms of bisphenol A on the enzyme electrode was carried out in 1X PBS buffer, pH 6.0. BPA stock solution (1 M) was freshly prepared by dissolving in methanol. The CV was performed within a potential range of -0.7 V ~ 0.8 V with a scan rate of 200 mV/s. Ten cycles of cyclic voltammetry in the presence of 1 mM bisphenol A were performed and illustrated in Fig. 9. The result showed that the enzyme electrode exhibited a significant increase in the reductive current at -0.2 V, which was consist with the precious observation.
Tyrosine, catechol, tyramine, neurotransmitters (dopamine, norepinephrine) and endocrine disrupting compounds (bisphenol A, diethylstilbestrol, paraben, 3-aminophenol) (Fig. 10), are consisting of phenolic group, that may be recognized by tyrosinase and exhibit electrochemical response. Stock solutions of above phenolic
compounds (100 mM) were freshly prepared in each experiment. The cyclic voltammogram of 1 mM each of dopamine, norepinephrine, catechol, tyrosine and EDCs was performed in 1X PBS buffer, pH 6.0 in a 10 ml reaction chamber. The CV was carried out between potential range -1.0 V ~ 1.0 V for tyramine (10 mM). The potential range of -1.0 V ~ 1.0 V was set for dopamine, norepinephrine, catechol and tyrosine. The scan rate of cyclic voltammograms was set at 200 mV/s.
The cyclic voltammograms of bisphenol A, 3-aminophenol, paraben and diethylstilbestrol exhibited that an oxidative peak at 0.61 V, 0.80 V, 1.02 V and 0.55 V, respectively. Diethylstilbestrol also showed a significant reductive peak at 0.012 V. All the endocrine disrupting compounds (Fig. 11) tested in this study exhibited no significant reductive peak at -0.2 V. These results demonstrated that these chemicals can be easily determined at a working potential of -0.2 V without any interference.
Amperometric measurement of endocrine-disrupting compounds
The experimental set up for electrochemical reaction is a three-electrode system with the SPCE, gold electrode and Ag/AgCl as the working, counter and reference electrodes, respectively. The working potential was set at -0.2 V vs. Ag/AgCl. Once the background current reached a steady state, the electrochemical reaction was started by adding 10 µl stock EDCs solution into the electrochemical reaction cell
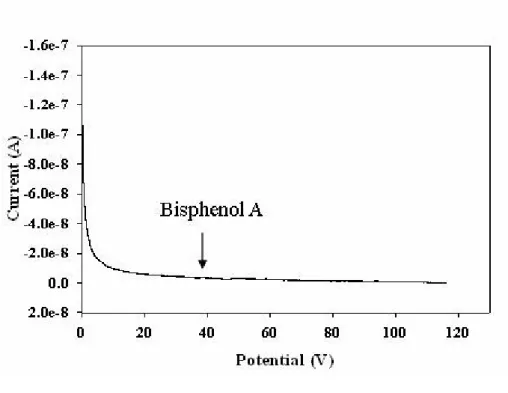
demonstrated that the EDCs were electrochemical inactive at the working potential of -0.2 V (Fig. 12).
The tyrosinase-based biosensor was fabricated by entrapping 40 U tyrosinase on the surface of SPCE by 4.67% gelatin crosslinked with formaldehyde. The step responses of fabricated enzyme electrode to repetitively added 1 µM bisphenol A (Fig. 13a), 30 µM paraben (Fig. 13b) or 5 µM 3-aminophenol (Fig. 13c) was determined. The results showed that the average response currents to 1 µM bisphenol A, 30 µM paraben and 5 µM 3-aminophenol were 116 nA, 46 nA and 443 nA, respectively. The average response time to 1 µM bisphenol A, 30 µM paraben and 5 µM 3-aminophenol were 73 s, 193 s and 52 s, respectively.
Calibration plots of EDCs
By using fabricated EDC biosensor the linear dynamic range of various EDCs was also determined. As shown in Fig. 14, shows the steady state current-dependent calibration curves for bisphenol A (Fig. 14a), 3-aminophenol (Fig. 14b), paraben (Fig. 14c) and diethylstilbestrol (Fig. 14d) were determined. The responses of enzyme electrode to bisphenol A, 3-aminophenol, paraben and diethylstilbestrol were found to be linear in the range of 1 µM ~ 20 µM (r2 = 0.999), 10 µM ~ 100 µM (r2
= 0.947), 20 µM ~ 100 µM (r2
for the detection of phenolic compounds than that of biosensors developed in recently reports (1, 85). The lowest detection limit (S/N ≥ 3) of the developed biosensor for bisphenol A, diethylstilbestrol, paraben and 3-aminophenol were 20 nM, 0.4 µM, 5 µM and 20 nM, respectively (Fig. 15).
Based on the regulation of EC SCF, the maximum amount of bisphenol A is permitted to transfer from the plastic into 1 kg of food is 3 mg or 3 ppm. No more than 0.8% of parabens are allow to be added in cosmetic product as preservatives; whereas the U.S. FDA suggests that cosmetic should not containing more than 1% parabens. 3-Aminophenol, commonly used in the hair dye and pesticides, is limit to be used in a concentration more than 20 ppm. Apparently, the developed tyrosinase-based biosensor in this study is suited to detected the EDCs in household products.
Application of tyrosinase-based biosensor for the detection of other
phenolic compounds
Dopamine (DA) and norepinephrine play an important role in regulating functions of central nervous, cardiovascular, renal and hormonal systems (86, 87). Dopamine and norepinephrine also function in drug addiction and Parkinson disease. The analytical determination of dopamine (DA) in biological fluids has gotten considerable attention. However, in the electroanalysis of dopamine in sera, ascorbic
acid and uric acid are major problems, because they exhibit similar oxidative potential to that of dopamine on SPCE. Thus determination of DA in sera by direct electrochemical oxidation of DA is difficult.
The use of enzyme electrodes is a highly selective sensing device for the detection of biological analytes. Therefore, the development of tyrosinase-based biosensor may reduce the interference exhibited by ascorbic acid and uric acid in sera. The cyclic voltammograms of 1 mM dopamine and 1 mM norepinephrine were performed within potential range of -1.0 V ~ 1.0 V (Fig. 16). Dopamine and norepinephrine exhibit an anodic peak current of 0.5 V and 0.5 V, respectively; whereas, their cathodic peak current of 0.1 V and 0.1 V, respectively. The enzyme electrode exhibited a linear dynamic range of 1 µM ~ 40 µM (r2 = 0.998) (Fig 17) for
dopamine. The detection limit for dopamine was 100 nM (S/N ≥ 3) (Fig. 18). The linear dynamic range for norepinephrine was between 1 and 100 µM (Fig 19); while the detection limit of norepinephrine was 200 nM (Fig 20)
Phenolic compounds are widely used and usually release into environment. Catechol is widely used as a photographic developer, as an intermediate in rubber and lubricating oils and as a precursor or intermediate in pharmaceuticals. Catechol is also an important probe in chemical manufacturing process. A reputable international agency has classified catechol as a carcinogen that may possibly cause cancer to
human.
By using developed tyrosinase-based biosensor, catechol could be determined at -0.2 V versus Ag/AgCl by direct reduction of quinone. The cyclic voltammograms of 1 mM catechol was also performed within potential range of -1.0 V ~ 1.0 V (Fig. 21), exhibiting the oxidative and reductive peak currents of 0.4 V and 0.05 V, respectively. The amperometric I-t curve of 1 µM catechol was also performed (Fig 22). The average response current for 1 µM was 748 nA; while average response time was 50 s. The developed biosensor exhibited a linear dynamic range of 0.1 µM to 10 µM (Fig. 23). The detection limit was 20 nM (S/N ≥ 3) (Fig. 24).
Stability of tyrosinase biosensor after long-term storage
The long term stability after storage was performed on three discrete tyrosinase-based biosensors. The electrochemical responses of these biosensors to 10 µM bisphenol A after storage for 1, 5, 7, 10, 12, 19, 21 and 31 days were determined in 1X PBS, pH 6.0 (Fig. 25). The responses of the developed tyrosinase-based biosensor remained at around 1400 ~ nA/10 µM bisphenol A within first week after 10 days storage, however, the activity of developed biosensor decreased about 2%. Even often 31 days storage, about 85% activity of developed biosensor remained (Fig 25).
Development of tyrosinase based biosensor by Diazonium cation
immobilization
Electrochemical deposition of diazonium cation was performed by cyclic voltammetry. The cyclic voltammogram was performed by immersing SPCE in diazonium cation solution (24 mM). The potential range was set between -0.7 V and 0.8 V for ten cycles. As shown in Fig 26, the reduction currents were gradually decreased during ten scan cycles. To demonstrated diazonium cation was deposited on the electrode surface, we determine weather modified SPCE can catalyze redox reaction of ferricyanide differentially under different pH value (Diagrams 1 + 2)
(Diagram 2)
The modified electrode contains carboxylic groups, which have a pKa of 4.2. The surface of the electrode have negative charged at pH 7.0. Therefore, negative charged substances, such as ascorbic acid, uric acid and ferricyanide, may be repelled from the surface of electrode, reducing the electron transfer rate. In contrast, dopamine, a positively charged compound at pH 7.0. Interestingly, the cyclic voltammegrams ferricyanide, ascorbic acid and uric acid exhibited a high oxidative peak current and broaden oxidative peak on the modified electrode than that on the bare electrode (Fig. 27). This result suggests that the SPCE was really modified by diazonium cation.
In pH 7.0, the 4-carboxyphenol groups were deprotonated and presented negative charge. However, at pH 2.0, the carboxylic group of diazonium cations remained protonated, reducing the repelling force to the ferricyanide. Therefore, the
28). In comparison, bare SPCE exhibited similar cyclic voltammograms of ferricyanide at both pH 2.0 and 7.0 (Fig. 28).
Subsequently, tyrosinase can be immobilized on the surface of modified electrode by EDC/NHS (76, 77). The generated tyrosinase/CMA/SPCE was then tested for its electrochemical reactivity to 10 µM bisphenol A (Fig. 29). The average response current of tyrosinase/CMA/SPCE to 10 µM bisphenol A is 1907.5 ± 52.3 nA with a relative standard derivation of 2.74 % (Fig. 29). Compare with gelatin entrapment, tyrosinase immobilized on the diazonium matrix exhibited a much faster response time and higher electrochemical response (Table. 1).
Conclusions
We have developed a tyrosinase-based biosensor by immobilizing tyrosinase on the surface of SPCE in a 4.67% gelatin matrix. The reproducibility and pH profile of developed tyrosinase-based biosensor was then characterized. The developed biosensor exhibited a maximum electrochemical response to bisphenol A at around pH 6.0. The detection of EDCs and other phenolic compounds by the tyrosinase-based biosensor can be optimally determined at -0.2 V without much interference from the analytes. The developed biosensor exhibits electrochemical responses of 116 nA, 46 nA and 443 nA to 1 µM bisphenol A, 30 µM paraben and 5 µM 3-aminophenol, respectively The average response time to 1 µM bisphenol A, 30 µM paraben and 5 µM 3-aminophenol were 73 s, 193 s and 52 s, respectively. The bisphenol A, 3-aminophenol, paraben and diethylstilbestrol could be detected on the developed tyrosinase electrode linearly in the range of 1 µM ~ 20 µM (r2 = 0.999), 10 µM ~ 100
µM (r2
= 0.947), 20 µM ~ 100 µM (r2 = 0.994) and 1 µM ~ 50 µM (r2 = 0.993), respectively. The lowest detection limit (S/N ≥ 3) for bisphenol A, diethylstilbestrol, paraben and 3-aminophenol were 20 nM, 0.4 µM, 5 µM and 20 nM, respectively. These results demonstrated that the developed tyrosinase-based biosensor exhibited a better detection limit, sensitivity and long-term storage stability than those of other reported tyrosinase-based biosensors (Table. 2, Table. 3 and Table. 4) (1, 79, 85).
However, other phenolic compounds, such as catechol and phenol, in environment may cause interference to the developed tyrosinase-based biosensor during the electrochemical reactions. In the future, an integration between the developed biosensor and a capillary electrophoresis method, which is to separate EDCs from mixtures in advance of the detection, may largely improve the detection of EDCs in the environment.
The feasibility of immobilization of tyrosinase on the surface of SPCE by diazonium cation has been demonstrated in this study. We find that a faster response time and higher response current than those generated by the tyrosinase/gelatin-SPCE biosensor. However, more studies are needed to find out an optimal condition for the diazonium salt-based electro-addressing and immobilization of enzyme on the surface of SPCE. This technique exhibits a great potential for the future fabrication of micro- or even nano-biosensors.
Reference
1. Andreescu, S., & Sadik, O.A. (2004) Analytical chemistry 76, 552-560
2. Soin, T., & Smagghe, G. (2007) Ecotoxicology (London, England) 16, 83-93
3. Stoker, T.E., Parks, L.G., Gray, L.E., & Cooper, R.L. (2000) Critical reviews in toxicology 30, 197-252
4. Wolff, M.S. (2006) Annals of the New York Academy of Sciences 1076, 228-238
5. Lyons, G. (2000) Bisphenol A A Known Endocrine Disruptor. Head of European Toxics Programme
6. Stehmann, A., Meesters, R.J., & Schroder, H.F. (2004) Water Sci Technol 50, 165-171
7. Sajiki, J., Miyamoto, F., Fukata, H., Mori, C., Yonekubo, J., & Hayakawa, K. (2007) Food additives and contaminants 24, 103-112
8. Dash, C., Marcus, M., & Terry, P.D. (2006) Mutation research 613, 68-75
9. Gutes, A., Cespedes, F., Alegret, S., & del Valle, M. (2005) Biosensors & bioelectronics 20, 1668-1673
10. Cravedi, J.P., Zalko, D., Savouret, J.F., Menuet, A., & Jegou, B. (2007) Med Sci (Paris) 23, 198-204
11. (2006) DES ups daughter's breast cancer risk. in Health news (Waltham, Mass, Vol. 12, p 10
12. Henley, D.V., & Korach, K.S. (2006) Endocrinology 147, S25-32
13. Lorette, G. (2006) Presse Med 35, 187-188
14. Cashman, A.L., & Warshaw, E.M. (2005) Dermatitis 16, 57-66; quiz 55-56
15. Harvey, P.W. (2003) J Appl Toxicol 23, 285-288
16. Rastogi, S.C., Sosted, H., Johansen, J.D., Menne, T., & Bossi, R. (2006) Contact dermatitis 55, 95-100
17. Sun, L.W., Qu, M.M., Li, Y.Q., Wu, Y.L., Chen, Y.G., Kong, Z.M., & Liu, Z.T. (2004) Bulletin of environmental contamination and toxicology 73, 628-634
18. Group, F.t.I.S.s.p.b.t.B.A.G.I. (2002)
19. Falconer, I.R., Chapman, H.F., Moore, M.R., & Ranmuthugala, G. (2006)
20. Orlando, M., Chacon, M., Salum, G., & Chacon, D.R. (2000) Ann Oncol 11, 177-181
21. Degen, G.H., & Bolt, H.M. (2000) International archives of occupational and environmental health 73, 433-441
22. Darbre, P.D., Aljarrah, A., Miller, W.R., Coldham, N.G., Sauer, M.J., & Pope, G.S. (2004) J Appl Toxicol 24, 5-13
23. Nohynek, G.J., Fautz, R., Benech-Kieffer, F., & Toutain, H. (2004) Food and Chemical Toxicology
24. Nohynek, G.J., Fautz, R., Benech-Kieffer, F., & Toutain, H. (2004) Food Chem Toxicol 42, 517-543
25. Narita, M., Murakami, K., & Kauffmann, J.M. (2007) Analytica chimica acta
588, 316-320
26. Zhou, J.L., Liu, R., Wilding, A., & Hibberd, A. (2007) Environmental science & technology 41, 206-213
27. Kim, H., Hong, J.K., Kim, Y.H., & Kim, K.R. (2003) Archives of pharmacal research 26, 697-705
28. Wakida, S., Fujimoto, K., Nagai, H., Miyado, T., Shibutani, Y., & Takeda, S. (2006) Journal of chromatography 1109, 179-182
29. Regan, F., Moran, A., Fogarty, B., & Dempsey, E. (2003) Journal of chromatography 1014, 141-152
30. Regan, F., Moran, A., Fogarty, B., & Dempsey, E. (2002) J Chromatogr B Analyt Technol Biomed Life Sci 770, 243-253
31. Shlyahovsky, B., Katz, E., Xiao, Y., Pavlov, V., & Willner, I. (2005) Small (Weinheim an der Bergstrasse, Germany) 1, 213-216
32. Yi, C., Zhang, Q., Li, C.W., Yang, J., Zhao, J., & Yang, M. (2006) Analytical and bioanalytical chemistry 384, 1259-1268
33. Stadler, H., Mondon, M., & Ziegler, C. (2003) Analytical and bioanalytical chemistry 375, 53-61
34. Ding, Y., Liu, J., Wang, H., Shen, G., & Yu, R. (2007) Biomaterials 28, 2147-2154
Biosensors & bioelectronics 22, 1707-1715
37. Muhammad-Tahir, Z., & Alocilja, E.C. (2003) Biosensors & bioelectronics 18, 813-819
38. Vianello, F., Boscolo-Chio, R., Signorini, S., & Rigo, A. (2007) Biosensors & bioelectronics 22, 920-925
39. Sergeyeva, T.A., Lavrik, N.V., Rachkov, A.E., Kazantseva, Z.I., & El'skaya, A.V. (1998) Biosensors & bioelectronics 13, 359-369
40. Saijo, R., Tsunekawa, S., Murakami, H., Shirai, N., Ikeda, S., & Odashima, K. (2007) Bioorganic & medicinal chemistry letters 17, 767-771
41. Zhou, Y., Yu, B., & Levon, K. (2005) Biosensors & bioelectronics 20, 1851-1855
42. Zhao, Z.X., Qiao, M.Q., Yin, F., Shao, B., Wu, B.Y., Wang, Y.Y., Wang, X.S., Qin, X., Li, S., Yu, L., & Chen, Q. (2007) Biosensors & bioelectronics
43. Wu, B.Y., Hou, S.H., Yin, F., Zhao, Z.X., Wang, Y.Y., Wang, X.S., & Chen, Q. (2007) Biosensors & bioelectronics
44. Topcu Sulak, M., Gokdogan, O., Gulce, A., & Gulce, H. (2006) Biosensors & bioelectronics 21, 1719-1726
45. Ionescu, R.E., Cosnier, S., & Marks, R.S. (2006) Analytical chemistry 78, 6327-6331
46. Hervas Perez, J.P., Sanchez-Paniagua Lopez, M., Lopez-Cabarcos, E., & Lopez-Ruiz, B. (2006) Biosensors & bioelectronics 22, 429-439
Rossi, S., Amine, A., & Moscone, D. (2007) Biosensors & bioelectronics
48. Maleki, N., Safavi, A., & Tajabadi, F. (2006) Analytical chemistry 78, 3820-3826
49. Cui, G., Yoo, J.H., Lee, J.S., Yoo, J., Uhm, J.H., Cha, G.S., & Nam, H. (2001) The Analyst 126, 1399-1403
50. Mirica, L.M., Vance, M., Rudd, D.J., Hedman, B., Hodgson, K.O., Solomon, E.I., & Stack, T.D. (2005) Science (New York, N.Y 308, 1890-1892
51. Fan, Q., Shan, D., Xue, H., He, Y., & Cosnier, S. (2007) Biosensors & bioelectronics 22, 816-821
52. Rusmini, F., Zhong, Z., & Feijen, J. (2007) Biomacromolecules
53. Bradner, J.E., McPherson, O.M., & Koehler, A.N. (2006) Nature protocols 1, 2344-2352
54. Kjellen, K.G., & Neujahr, H.Y. (1979) Biotechnology and bioengineering 21, 715-719
55. Safranj, A., Kiaei, D., & Hoffman, A.S. (1991) Biotechnology progress 7, 173-177
56. Ahluwalia, A., De Rossi, D., Ristori, C., Schirone, A., & Serra, G. (1992) Biosensors & bioelectronics 7, 207-214
57. Willard, F.S., & Siderovski, D.P. (2006) Analytical biochemistry 353, 147-149
58. Zhang, S., Wang, N., Yu, H., Niu, Y., & Sun, C. (2005) Bioelectrochemistry (Amsterdam, Netherlands) 67, 15-22
59. Ghica, M.E., Pauliukaite, R., Marchand, N., Devic, E., & Brett, C.M. (2007) Analytica chimica acta 591, 80-86
60. Basu, A.K., Chattopadhyay, P., Roychoudhuri, U., & Chakraborty, R. (2007) Bioelectrochemistry (Amsterdam, Netherlands) 70, 375-379
61. Wcislo, M., Compagnone, D., & Trojanowicz, M. (2006) Bioelectrochemistry (Amsterdam, Netherlands)
62. Karacaoglu, S., Timur, S., & Telefoncu, A. (2003) Artificial cells, blood substitutes, and immobilization biotechnology 31, 357-363
63. Ozturk, G., Ertas, F.N., Akyilmaz, E., Dinckaya, E., & Tural, H. (2004) Artificial cells, blood substitutes, and immobilization biotechnology 32, 637-645
64. Sungur, S., & Numanoglu, Y. (2006) Artificial cells, blood substitutes, and immobilization biotechnology 34, 41-54
65. Emregul, E., Sungur, S., & Akbulut, U. (2005) Journal of biomaterials science
16, 505-519
66. Doria-Serrano, M.C., Ruiz-Trevino, F.A., Rios-Arciga, C., Hernandez-Esparza, M., & Santiago, P. (2001) Biomacromolecules 2, 568-574
67. Lin, T.Y., Wu, C.H., & Brennan, J.D. (2007) Biosensors & bioelectronics 22, 1861-1867
68. Brennan, J.D. (2007) Acc Chem Res
69. Yu, B., Long, N., Moussy, Y., & Moussy, F. (2006) Biosensors & bioelectronics
4543-4549
71. Tsiafoulis, C.G., Prodromidis, M.I., & Karayannis, M.I. (2004) Biosensors & bioelectronics 20, 620-627
72. Azila, A.A., Barbari, T., & Searson, P. (2004) The Medical journal of Malaysia
59 Suppl B, 51-52
73. Pang, J., Fan, C., Liu, X., Chen, T., & Li, G. (2003) Biosensors & bioelectronics
19, 441-445
74. Zhang, Y., Zeng, G.M., Tang, L., Huang, D.L., Jiang, X.Y., & Chen, Y.N. (2007) Biosensors & bioelectronics 22, 2121-2126
75. Wang, J., Musameh, M., & Mo, J.W. (2006) Analytical chemistry 78, 7044-7047
76. Corgier, B.P., Marquette, C.A., & Blum, L.J. (2005) Journal of the American Chemical Society 127, 18328-18332
77. Corgier, B.P., Marquette, C.A., & Blum, L.J. (2007) Biosensors & bioelectronics
22, 1522-1526
78. Hess, R., & Pearse, A.G. (1961) Enzymologia biologica et clinica 1, 87-113
79. Li, N., Xue, M.H., Yao, H., & Zhu, J.J. (2005) Analytical and bioanalytical chemistry 383, 1127-1132
80. Raggi, M.A., Pucci, V., Bugamelli, F., & Volterra, V. (2001) Journal of AOAC International 84, 361-367
81. de Oliveira, M.F., & Stradiotto, N.R. (2002) Journal of pharmaceutical and biomedical analysis 30, 279-284
82. Ali, S.A., & Sami, M.A. (2000) Pakistan journal of pharmaceutical sciences 13, 21-37
83. Campanella, L., Bonanni, A., Bellantoni, D., Favero, G., & Tomassetti, M. (2004) Journal of pharmaceutical and biomedical analysis 36, 91-99
84. Yuan, C.-J., Hsu, C.-L., Wang, S.-C., & Chang, K.-S. (2005) Electroanalysis 17, 2005, No. 24, 2239 – 2245
85. Dempsey, E., Diamond, D., & Collier, A. (2004) Biosensors & bioelectronics 20, 367-377
86. Gareri, P., De Fazio, P., Stilo, M., Ferreri, G., & De Sarro, G. (2003) Clin Drug Investig 23, 287-322
(a)
voltage
v
1v
1v
2time
(b)
Fe
3++ e
-Fe
2+Figure 1. Response of a redox couple during a potential cycle
(a) Cyclic voltammetry consists of scanning linearly the potential of a stationary working electrode. Depending on the information sought, single or multiple cycles can be used. (b) A redox potential scan is chosen for first half cycle. As the applied reductive potential reached E0 for the redox
E0
V1 V2
current
Bluk solution
C = C0E
le
ctr
od
e
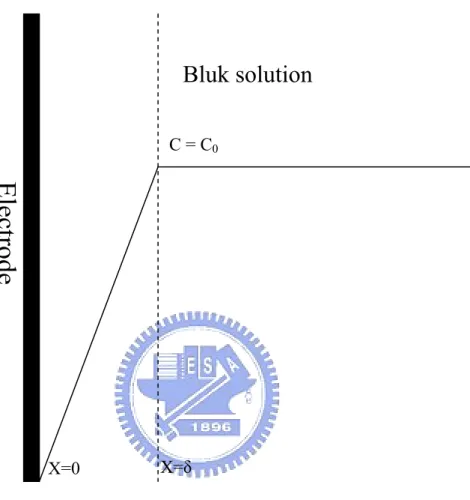
X=δ X=0Figure 2. The Nernst diffusion layer
The electrode is presented by the blue bar on the left side of the picture. The x-axis is the distance from the electrode. The x = 0 is the electrode surface. The y-axis is the concentration of substrate in the bulk solution. The diffusion layer thickness δ, in normal stirred solution the thickness of diffusion layer was between 0.01 mm and 0.001 mm.
(a)
Figure 3. Step responses of tyrosinase biosensor to sequentially
added 1 µM bisphenol A
Endocrine disrupting chemicals sensing strip was fabricated by entrapping 40 U tyrosinase by gelatin. (a) The step responses to 1uM bisphenol A was performed in PBS buffer, pH 6.0 by repetitively adding 1 µM bisphenol A. Working potential is -0.2 V vs. Ag/AgCl. (b) The response time was determined after responses current reaching a steady state. The response time is determined by the interval between the time of adding bisphenol A and the time reaching 95% steady state current.
Figure 4. Stability of tyrosinase biosensor entrapped by different
percentage gelatin
Tyrosinase biosensor were fabricated by entrapping tyrosinase in (
-●-
) 0.67% gelatin (-
○-
) 2% gelatin (-
▼-
) 3.33% gelatin (-
▽-
) 4.67% gelatin(
-
■-
) 6% gelatin on the surface of SPCE. The electrochemical response of tyrosinase biosensor to 10 µM bisphenol A was determined in PBS, pH 6 with stirring. The working potential was -0.2 V versus Ag/AgCl. Seven reactions were recorded.
Figure 5. Reproducibility of tyrosinase biosensor with tyrosinase
entrapped in 4.67% gelatin
Tyrosinase biosensor was entrapped in 4.67% gelatin and coated on a SPCE. The electrochemical response of tyrosinase biosensor to 1 µM bisphenol A was determined in 1X PBS, pH 6.0. The working potential was -0.2 V vs. Ag/AgCl. Fifty reactions were recorded.
Figure 6. Effect of pH on the response of the tyrosinase biosensor
The effect of pH on the response of tyrosinase biosensor to 10 µM bisphenol A was determined in PBS under different pH values (pH 3.0, 4.0, 5.0, 6.0, 7.0 and 8.0). Working potential was -0.2 V vs. Ag/AgCl. Each data is presented as mean ± S.D. and obtained from three independent. .
Potential (V)
-0.6 -0.5 -0.4 -0.3 -0.2 -0.1 0.0R
ed
uct
ive current
(n
A)
0 1000 2000 3000 4000 5000 10 µM BPA PBS bufferFigure 7. Amperometric response of tyrosinase biosensor to 10 µM
bisphenol A at different applied voltages
Tyrosinae biosensor was fabricated by entrapping 40 U tyrosinase via 7% gelatin. The electrochemical responses of tyrosinase biosensor to 10 µM bisphenol A (
-
●-
) and buffer only (-
○-
) at different working potential (-0.1 V, -0.2 V, -0.3 V, -0.4 V and -0.5 V) were measured. The reactions were performed in PBS, pH 6.0 at different voltages vs. Ag/AgCl. Each data obtained from three independent measurements.Figure 8. Cyclic voltammograms of tyrosinase biosensor and SPCE
The electrochemical response of SPCE (dot line) and tyrosinase biosensor (solid line) was performed in 1X PBS, pH 6.0. CV was set for -1.0 V ~ 1.5 V vs. Ag/AgCl with a scanning rate of 100 mV/s.
Figure 9. Cyclic voltammograms of tyrosinase biosensor in the presence
of bisphenol A
The cyclic voltammograms of tyrosinase biosensor to 1 mM bisphenol A was performed in 1X PBS, pH 6.0. Scaning range was set for -0.7 V and 0.8 V vs. Ag/AgCl with a scanning rate of 200 mV/s for 10 cycles.
(a)
Tyrosine
(b)
Catechol
(c)
Tyramine
(d)
Dopamine Norepinephrine
(e)
Diethylstilbestrol Bisphenol A
Paraben 3-Aminophenol
Figure 10. Structure of endocrine disrupting compounds and phenolic
compounds
The chemical structure of (a) tyrosine (b) catechol (c) tyramine (d) dopamine and norepinephrine and (e) endocrine disrupting compounds.
Figure 11. Cyclic voltammograms of different EDCs on the fabracted
tyrosinase biosensor
The CV of SPCE (dot line) and EDCs on the SPCE (solid line) to 1 mM bisphenol A (a), diethylstilbestrol (DES) (b), paraben (c) and 3-aminophenol (d) were performed in 1X PBS, pH 6.0. Scanning range of CV was set -1.0 V ~ 1.5 V (a,c,d) and -1.0 V ~ 1.0 V (b) with a scanning rate of 200 mV/s.
Figure 12. Response of bare SPCE to various EDCs
The i-t curve of SPCE to 100 µM each of paraben (a), 3-aminophenol (b), bisphenol A (c) and Diethylstilbestrol (d) in PBS, pH 6.0. Working potential was -0.2 V vs. Ag/AgCl.
(a)
(c)
Figure 13. Step responses of tyrosinase biosensor to various EDCs
The tyrosinase biosensor was fabricated by entrapping 40 U tyrosinase in 7% gelatin on a SPCE. The step responses of tyrosinase biosensor to 1 µM bisphenol A (a), 5 µM 3-aminophenol (b) and 30 µM paraben (c) were performed in 1X PBS, pH 6.0. Working potential was -0.2 V vs. Ag/AgCl.
(A)
(C)
Figure 14. Linear dynamic range of various EDCs on the developed
tyrosinase biosensor
The tyrosinase biosensor was fabricated by entrapping 40 U tyrosinase in 7% gelatin on a SPCE. The reductive currents of tyrosinase biosensor to bisphenol A (A), 3-aminophenol (B), paraben (C) and diethylstilbestrol (D) were determined in PBS, pH 6.0. Working potential was -0.2 V vs. Ag/AgCl. Each data was obtained from three independent measurements.
(a)
(c)
Figure 15. Lowest detection limit of fabricated tyrosinase biosensor
The tyrosinase biosensor was fabricated by entrapping 40 U tyrosinase in 7% gelatin on a SPCE. A successful response to (a) 20 nM bisphenol A (b) 40 nM diethylstilbestrol (c) 5 µM paraben (d) 20 nM 3-aminophenol were recorded (S/N ≧ 3) in PBS buffer, pH 6.0. Working potential was -0.2 V vs. Ag/AgCl.
(a)
(b)
Figure 16. Cyclic voltammograms of neurotransmitter on SPCE
CV of dopamine (a) and norepinephrine (b) was performed in 1X PBS buffer, pH 6.0. CV was carried out within a potential range -1.0 V ~ 1.0 V in 1 mM dopamine and 1 mM norepinephrine. Working potential is -0.2 V vs. Ag/AgCl, and a scan rate of 100 mV/s.
Figure 17. Linear dynamic range of dopamine of the tyrosinase biosensor
Tyrosinase biosensor was fabricated by entrapping 40 U tyrosinase in 7% gelatin on a SPCE. The reductive current of the biosensor was determined with different concentrations of dopamine (1 µM ~ 100 µM) dopamine in 1X PBS, pH 6.0. The working potential was -0.2 V vs. Ag/AgCl. Each data was obtained from three independent measurements. The linear dynamic range of dopamine was ploted as in insert panel.
Figure 18. Lowest detection limit of fabricated tyrosinase biosensor
dopamine
Tyrosinase biosensor was fabricated by entrapping 40 U tyrosinase in 7% gelatin on a SPCE. The chemical response to 100 nM dopamine in PBS buffer, pH 6.0 was recorded within 140 sec (S/N ≧ 3). Working potential was -0.2 V vs. Ag/AgCl.
Figure 19. Linear dynamic range of norepinephrine on the tyrosinase
biosensor
Tyrosinase biosensor was fabricated by entrapping 40 U tyrosinase in 7% gelatin on a SPCE. The reductive current of enzyme electrode to norepinephrine was determined with different concentration of norepinephrine (1 µM ~ 300 µM) norepinephrine in 1X PBS, pH 6.0. The working potential was -0.2 V vs. Ag/AgCl. Each data was obtained from three independent measurements.
Figure 20. Lowest detection limit of fabricated tyrosinase biosensor to
Norepinephrine
Tyrosinase biosensor was fabricated by entrapping 40 U tyrosinase in 7% gelatin on a SPCE. A electrochemical Response of tyrosinase biosensor to 200 nM norepinephrine in PBS buffer, pH 6.0 was recorded within 220 sec (S/N ≧ 3). Working potential was -0.2 V vs. Ag/AgCl.
Figure 21. Cyclic voltammograms of catechol on SPCE
CV was performed in a range of -1.0 V ~ 1.0 V. The reaction was 1X PBS buffer, pH 6.0 and 1 mM catechol. The scan rate was 100 mV/s. (dot line : SPCE, solid line : Catechol)
Figure 22. Step responses of tyrosinase biosensor to catechol
Tyrosinase biosensor was fabricated by entrapping 40 U tyrosinase in 7% gelatin on a SPCE. The step response of tyrosinase biosensor to 1 µM catechol was performed in 1X PBS, pH 6.0. Working potential was -0.2 V vs. Ag/AgCl.
Figure 23. Linear dynamic range of catechol on the the tyrosinase
biosensors
Tyrosinase biosensor was fabricated by entrapping 40 U tyrosinase in 7% gelatin on a SPCE. The reductive current of enzyme electrode to catechol was determined with different concentration of catechol (0.1 µM ~ 30 µM) catechol in 1X PBS, pH 6.0. The working potential was -0.2 V vs. Ag/AgCl. Each data was obtained from three independent measurements.
Figure 24. Lowest detection limit of fabricated tyrosinase biosensors
Tyrosinase biosensor was fabricated by entrapping 40 U tyrosinase in 7% gelatin on a SPCE. A electrochemical Response of tyrosinase biosensor to 20 nM catechol in PBS buffer, pH 6.0 was recorded within 70 sec (S/N ≧ 3). Working potential was -0.2 V vs. Ag/AgCl.
Figure 25. Long-term stability of tyrosinase biosensor after storage
Tyrosinase biosensor was stored at 4 ℃. At the time indicated the tyrosinase biosensor was subjected to electrochemical reaction in the presence of 10 µM bisphenol A in PBS buffer, pH 6.0. The working potential was -0.2 V vs. Ag/AgCl. Each data was represented as mean ± S.D and obtained from three independent measurements.
Fig 26. The cyclic voltammegrams of diazonium cation
Cyclic voltammegrams for the reduction of diazonium cation was carried of a scan rate of 200 mV/s for 10 scan cycles within potential of -0.7 V ~ 0.8 V.
Ascorbic acid Uric acid Ferricyanide
Fig 27. Cyclic voltammegrams of various mediators
Cyclic voltammegrams for ascorbic acid, uric acid and ferricyanide in the bare electrode and diazonium cation modified electrode.
(a)
(b)
Fig 28. Cyclic voltammegrams of ferricyanide on SPCE and modified
electrode
CV of SPCE (a) and modified electrode (b) was performed in 1X PBS buffer, pH 6.0. CV was carried out within a potential range -1.0 V ~ 1.0 V in 1 mM ferricyanide.
Fig 29. Successive tested on tyrosinase/CMA/SPCE electrode
Tyrosinase was immobilized by EDC/NHS. The electrochemical response of tyrosinase biosensor to 10 µM bispnenol A was determined in PBS, pH 6.0. The working potential was -0.2 V versus Ag/AgCl. Seven reactions were recorded.