國立政治大學亞太研究英語碩士學位學程
International Master’s Program in Asia-Pacific Studies
College of Social Sciences
National Chengchi University
碩士論文
Master’s Thesis
中國大陸創業投資產業之研究
The Study of Venture Capital Industry in China
Student: Eric M. Chang
Advisor: Dr. Jen Te Hwang
中華民國 101 年 7 月
July, 2012
中國大陸創業投資產業之研究
The Study of Venture Capital Industry in China
研究生:張閔傑 Student: Eric M. Chang
指導教授:黃仁德博士 Advisor: Dr. Jen Te Hwang
國立政治大學
亞太研究英語碩士學位學程
碩士論文
A Thesis
Submitted to International Master’s Program in Asia-Pacific Studies
National Chengchi University
In partial fulfillment of the Requirement
For the degree of Master in China Studies
中華民國 101 年 7 月
July, 2012
Abstract
The Study discusses the development of the venture capital (VC) industry in China, from its fundraising, investment to post investment, and comparisons on a global scale. We also analyzed the relationship between the innovative industries and economic growth, and discussed the VC’s exit route and stock market in China. The growth of China’s VC industry is still promising but there are still some challenges that it has to overcome. Furthermore, the VC development in China also implies the growth potential of the Chinese stock markets, and suggests that Taiwan should act as an active role and take advantage of its geographical position, strong relationship and regional stability with China to participate in the possible collaboration of the stock markets in the Asia-Pacific region.
Keyword: Venture Capital, Chinese Stock Market, Innovation, SME Board, Stock Market Collaboration.
Table of Contents
Chapter 1 Introduction ...1
1.1 Research Background and Motivation... 1
1.2 Research Purposes ... 2
1.3 Methodology ... 3
Chapter 2 The Global Venture Capital Industry ...4
2.1 The Role of Venture Capital ... 4
2.2 Overview of the Global VC Market ... 8
2.3 The Western VC Development ... 12
2.3.1 The VC Development in the United States ... 12
2.3.2 The Model of Silicon Valley ... 16
2.3.3 The VC Development in Europe ... 18
2.4 The Eastern VC Development ... 23
2.4.1 The VC Development in Taiwan ... 23
2.4.2 The VC Development in Israel ... 26
2.4.3 The VC Development in Japan and Singapore ... 29
2.5 Summary ... 32
Chapter 3 The Venture Capital Industry in China ... 34
3.1 The VC Market in China ... 34
3.1.1 The Transition in Economic System ... 34
3.1.2 The VC Participants in China ... 35
3.2 The Challenges Face by the Venture Capital in China ... 41
3.2.1 Legalization and Institutionalization ... 41
3.2.2 Information Transparency ... 43
3.2.4 The Control on Foreign Exchange ... 45
3.3 The Reform on Venture Capital in China ... 46
3.3.1 The Legal Environment... 46
3.3.2 The Loosen Control on the Foreign Exchange ... 49
3.4 Summary ... 50
Chapter 4 The Venture Capital Industry and the Economic Growth in China ... 52
4.1 Regional and Segmental Development in China ... 52
4.1.1 VC and Regional Development ... 52
4.1.2 VC and Industry Development ... 53
4.2. Venture Capital and Innovation in China-ZGC Case ... 57
4.2.1 The ZGC National Demonstration Zone ... 57
4.2.2 VC Activities in ZGC ... 59
4.2.3 Innovation in ZGC ... 60
4.3 Cross-Strait Comparison ... 63
4.4 Summary ... 65
Chapter 5 The Chinese Venture Capital Industry and the Stock Market ... 66
5.1 The Divestment of the VC in China ... 66
5.1.1 The IPOs of Chinese Enterprises ... 67
5.1.2 Performance of the Divestment of VC in China ... 69
5.2 IPO Activities and Stock Markets ... 71
5.2.1 The Western Stock Exchanges and Chinese Listed Companies ... 71
5.2.2 The Eastern Stock Exchanges and Chinese Listed Companies ... 74
5.2.3 Comparison of S&M Boards in the Exchanges ... 75
5.3 The Collaboration of Stock Exchanges ... 78
5.3.1 The Importance of Scale ... 78
5.4 Summary ... 86
Chapter 6 Conclusions and Suggestions ... 87
6.1 Conclusions ... 87
6.2 Suggestions ... 90
Appendix-1: China Venture Capital & Private Equity Annual Ranking—2009~2011 ... 93
Appendix-2: Top 20 VC Firms—2007~2011 ... 94
Appendix-3: Top 10 Domestic VC Firms—2010~2011 ... 95
Appendix-3: Active Taiwanese VC Firms in China—2010~2011 ... 97
Appendix-4: Top 10 Foreign VC Firms—2010~2011 ... 98
Appendix-5: Basic Requirements for the Admission of Securities to the Selected Capital Markets ... 99
List of Tables
Table 2-1: The Global Venture Capital Fund Raised by Region—2007~2011 ... 9
Table 2-2: The Global Venture Capital Investment by Geography—2007~2011 ... 10
Table 2-3: Venture Capital Investments by Industry Sector—2011 ... 11
Table 2-4: Time to Exit by Region—2003~2011 ... 11
Table 2-5: The Comparison of Venture-Backed IPOs—2007~2011 ... 12
Table 2-6: The Legalization of the VC in U. S. ... 15
Table 2-7: The Transformation of the Top 5 U. S. Investment Banks after 2008 ... 16
Table 2-8: The U. S. VC Investment by Stage—1985~2010 ... 16
Table 2-9: The VC Investment Contributed by Silicon Valley... 18
Table 2-10: Fund Investment in Europe by Buyout & Growth / VC —2007~2011 ... 19
Table 3-1: Domestic Sources of Venture Capital by Distribution-2005~2008 ... 41
Table 3-2: The VC Related Regulations in China... 48
Table 3-3: The Approved List for the QFLP Pilot Program ... 50
Table 4-1: VC Investment Distribution by Region-2006~2011 ... 53
Table 4-2: VC Investment Distribution by Stage-2009~2011... 54
Table 4-3: The High-tech Industries Supported by the State ... 55
Table 4-4: VC Investment Distribution by Industry—2009~2011 ... 56
Table 4-5: Number of the National Industrial Zones in China-June, 2012 ... 56
Table 4-6: VC Investment in ZGC and Contribution—2008~2010 ... 59
Table 4-7: Revenue and VC Investment Distribution in ZGC-2010 ... 60
Table 4-8: Number of the Listed Companies from ZGC-2011 ... 61
Table 4-9: Top 10 Listed Companies from ZGC by Market Value ... 61
Table 4-10: The National Technology Facilities in ZGC ... 62
Table 4-11: Patents Application in ZGC—2008~2010 ... 62
Table 5-2: Summary of Chinese Enterprises’ IPO—2006~2011 ... 68
Table 5-3: IPO of the Chinese Enterprises Backed by VC—2006~2011 ... 69
Table 5-4: IPO Rate Return of the Chinese Enterprises Backed by VC/PE—2006~2011 ... 69
Table 5-5: IPO Rate of Return of the Chinese Enterprises Backed by VC/PE in Exchanges—2010~2011 ... 70
Table 5-6: IPO Rate of Return of the Chinese Enterprises Backed by VC/PE in Industries—2010~2011 ... 70
Table 5-7: Summary of Listed Chinese Enterprises in the U. S.-June 27, 2012 ... 72
Table 5-8: Top 10 Listed Chinese Enterprises in the U. S. by Market Value-June 21, 2012 ... 73
Table 5-9: Comparison of the Major Securities Markets in World ... 77
Table 5-10: The Merger Intentions of Exchanges ... 78
List of Figures
Figure 1-1: Research Framework ... 3
Figure 2-1: The Category of Private Fund ... 5
Figure 2-2: Venture Capital Investment Stages ... 5
Figure 2-2: Patents Per Capita for Taiwan, the NICs, and Israel-1970~1997 ... 8
Figure 2-3: The U. S. Venture Capital Scale—1985~2011 ... 13
Figure 2-5: Silicon Valley’s Percentage of U. S. and California Patents ... 18
Figure 2-6: The Europe VC Investment by Country ... 20
Figure 2-8: Sales of Hisnchu Science Park and GDP in Taiwan—1991~2011 ... 25
Figure 2-9: VC-Investment in Taiwan by Stage—1997~2011 ... 26
Figure 2-10: Israel’s EITP Profile: Policies and Impacts ... 27
Figure 2-11: Comparison of Israeli and American VC Fund Raised—2002~2011 ... 29
Figure 3-1: Fund Raised in China by Currency—2004~2011 ... 38
Figure 3-2: Chinese Vs. Foreign VC investment—2006~2011 ... 38
Figure 4-1: VC-Investment as % of GDP-2001~2011... 57
Figure 4-2: The GDP of ZGC and Contribution to Beijing—1993~2011 ... 58
Figure 4-3: Comparison of Patents Owned to per 10 Billion GDP by Region ... 62
C
hapter
1
Introduction
1.1 Research Background and Motivation
The study endeavors to explore the development of the China’s venture capital (VC) industry and its post investment decision, and therefore to try to positioning its major exit markets which includes the western stock markets and the greater Chinese stock markets.
In this study, VC is defined narrowly as the early stages of equity investment as opposed to latter stage mezzanine, turnaround and buyout investments typically associated with private equity investment in the West.
Venture capital is further distinguished from traditional investment forms by its concurrent provision of business and managerial advice to the borrower. High levels of risk are present in venture capital products or services, with the expectation of large returns.
China represents the fastest growing economy in the world. As an investment class, venture capital and private equity (PE) have had an impact on the economic growth process that is significantly greater than the actual proportion of funds invested by the asset class (Koh and Koh, 2002).
The roaring of China economy provides a solid fundamental for the development of VC industry. In 2009, China took place of Germany to be the largest export country; and its gross domestic product surpassed Japan in first-half of 2010 and became the second largest economy. China is only behind the U.S. in term of economy power.
It therefore induces the interests of the global capital to flow in and enjoy the significant growth. According to the State Administration of Foreign Exchange (SAFE), the China’s record high foreign surplus was 3.2 trillion US dollars in the third quarter of 2011. The
accumulated surplus under the capital and financial accounts raised by US$ 720 billion from 2005 to the first half of 2011 compare to the US$ 1,899 billion in the current account.
In 2010, record numbers of Chinese IPOs (initial public offering) listed in Hong Kong and the U.S., producing two of the five largest IPOs of all time. Due in part to the surge in Chinese activity, the global IPO market nearly matched the previous peak of 2007. The Chinese enterprises therefore have become the most aggressive group to raise money. It does not only benefit from the economy rising in China, but also from the consumer force in the domestic market. The Chinese IPO market is therefore expected to attract the most eyespot of the institutional investors such as venture capital and private equity fund.
1.2 Research Purposes
The rising of China is mainly from its economic force, such as the title of “the factory of the world” or gradually replaced by “the market of the world”. Undoubtedly, the investment opportunities are everywhere in the animated economy.
Moreover, VC companies are both a crucial participant of the emerging economy and a main investor in the listed security market. In the study, we hope to accomplish a number of objectives:
Firstly, we plan to conduct an overview of the VC industry in China. Secondly, we therefore have the intention to study the development of the VC industry in China, and engage to analyze the economic impact caused by VC. Thirdly, we are interested in the innovation and VC as well and therefore will discuss on the developments and experiences in Silicon Valley and Taiwan. It is expected to analyze and evaluate the innovation leads by the VC in China. Furthermore, the development of the VC industry is mainly determined by the prosperity of IPO stock markets. The more active IPO stock market causes the more
prosperous development of the VC industry. We therefore plan to study the withdrawal mechanisms of the VC.
1.3 Methodology
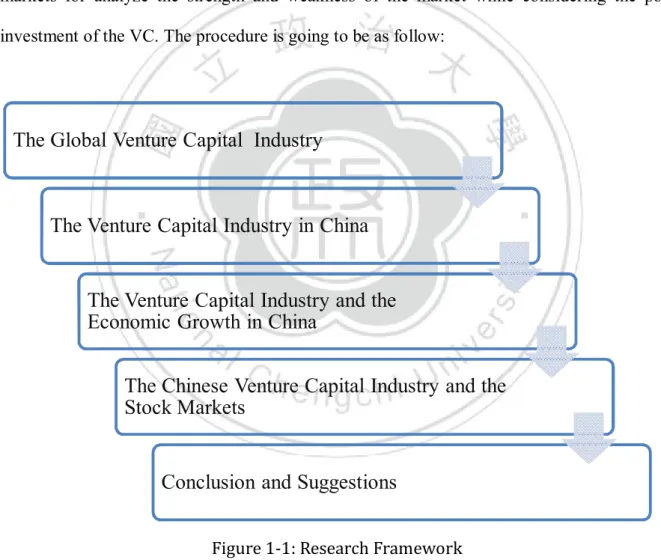
The study is going to be conducted by the top-down method. From the global aspect to China aspect, then focus on the relationship between VC and economic growth, and VC and the stock markets, respectively. It is expected to make some comparison among the stock markets for analyze the strength and weakness of the market while considering the post investment of the VC. The procedure is going to be as follow:
Figure 1-1: Research Framework
The Global Venture Capital Industry
The Venture Capital Industry in China
The Venture Capital Industry and the
Economic Growth in China
The Chinese Venture Capital Industry and the
Stock Markets
C
hapter
2
The Global Venture Capital Industry
The study is going to be started by the global development of the VC industry, such as the development in the U.S., Europe, and East Asia which including Taiwan. Accordingly, it is expected to discuss about the functional role plays by the VC and its exit mechanism. It therefore provides a comprehensive view on the VC industry, then project the eyespot to the market.
2.1 The Role of Venture Capital
Liles (1974) presented a broad spectrum of definitions of VC investment: Investment in any high-risk financial venture;
Investment in unproven ideas, products, or set-up situation; i.e. the provision of what is called “seed capital”;
Investment in going concerns that are unable to raise funds from conventional public or commercial sources; and
Investment in large and – in some cases- controlling interests in publicly traded companies where there is a considerable degree of uncertainty.
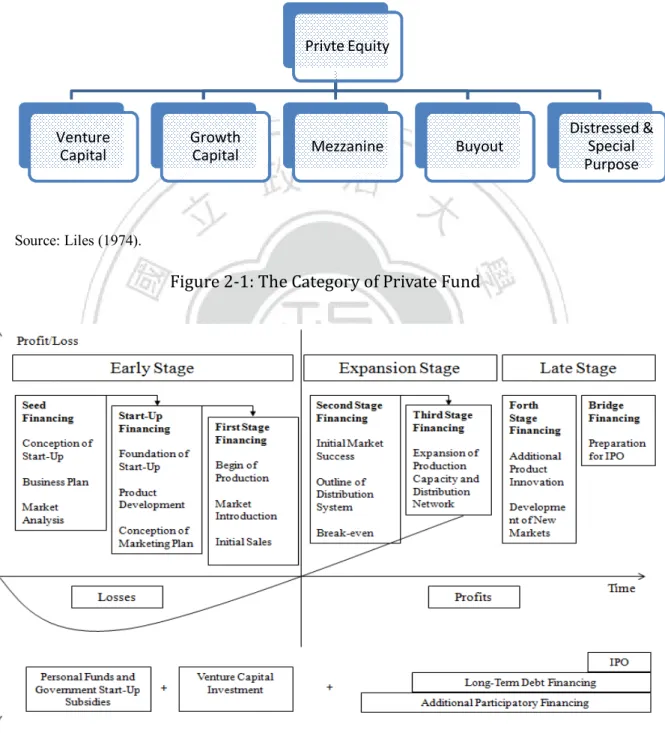
The concept is as shown in Figure 2-2. In addition, Liles also describes a dialectical phenomenon: “Interestingly enough, seed capital situations are considered by some individuals or firms as too risky to be described as suitable for venture capital and by others as the only form of a “pure” venture capital investment opportunity.”
Venture capital funds raise capital to invest in new business projects. These funds act as agents between the entrepreneurs who face search costs in location funding, and uninformed institutional and individual investors. Venture capitalists, unlike many other equity market participants, take active roles within their portfolio firms. In addition to the deal’s origination, screening, evaluation, and structuring, they are responsible for monitoring the venture’s
post-investment activities on behalf of the investors in their managed funds. A venture capitalist often takes some form of a non executive managerial position within the portfolio company. From Figure 2-1, V C belongs to the type of private equity fund.
Source: Liles (1974).
Figure 2-1: The Category of Private Fund
Source: Schmeisser (2000).
Figure 2-2: Venture Capital Investment Stages
Privte Equity
Venture Capital
Growth
Capital Mezzanine Buyout
Distressed & Special Purpose
McNaughton (1990) designed and administered a survey that collected information on these key variables from Canadian firms that had received venture capital funding between 1980 and 1987. The results showed that venture capitalists invest in the elite of small and medium sized companies. These firms have above average rates of revenue growth, and strong financial positions. They commit large amount of capital to R&D activity, and are highly export new employment opportunities.
Pfirrmann et al. (1997) stated that VC companies do not only provide capital, but also management support. Engel and Keilbach (2007) found that companies receiving venture capital had more patents at the time of funding than the average start-up. In Taiwan, an empirical study also indicated the information disclosures are significantly positively correlative to investments of the VC, their shareholding rate and number of VC (Sheu and Lin, 2006). It is because the VCs have the ability to ask the invested companies to disclose more relative information, strengthen information transparency, and minimize the possibility of concealment of information by insiders.
In general, there are three major functions of the VC, Enterprises Growth
For the investee, VC combines the provision of finance with active support, governance and mentoring of the startup companies. Entrepreneurs turn to VC it finance the development of new ideas and technologies and at the same time gain access to professional management skills and strategic support of experienced venture capitalists.
The link between the superior performance of venture-backed firms and changes to existing economic structures is identified by Florida and Kenney (1988). They suggest that venture capitalists affect economic development is the primary focus of entrepreneurial economics. This perspective is important to those hoping to link venture capital investment with economic growth. Thus, it is clear that the venture capitalists are generally involved in
firms that have rapid rates of growth, and maximizing the economic benefit of their investment.
Results from the venture capital industry seem to suggest that venture-backed firms outperform non-venture-backed firms in terms of job creation and revenue growth. Revenue growth was 5.3% for venture-capital backed firms compared to 3.5% total revenue growth over the period (NVCA, 2009). Similarly, the European Venture Capital Association (EVCA) reports that private equity and venture capital-financed companies created over 1 million new jobs in Europe from 2000 to 2004, with employment growing at an average rate of 5.4% annually, compared to a 0.7% growth rate in total employment in the EU25. About jobs creation, for example, in the United States, employment growth in venture-backed companies increased by 1.6% from 2006 to 2008 while total U.S. private-sector growth was only 0.2%, according to the National Venture Capital Association (NVCA).
Innovation
VC does not only play an important role in economic growth but also innovation. Jain and Kini (1995) found that firms financed by venture capital grew faster than in both scale and employment. Hasan and Wang (2006) have also found positive correlations between regional per capita and GDP growth though those correlations may reflect an attraction of VC to high-growth region. Samila and Sorenson (2011) further found that an expand supply of VC raises employment and aggregate income in a region, the results are quiet consistent with the notion that an expansion in financial intermediation improves the allocation of capital and therefore can stimulate growth (Greenwood and Boyan, 1990).
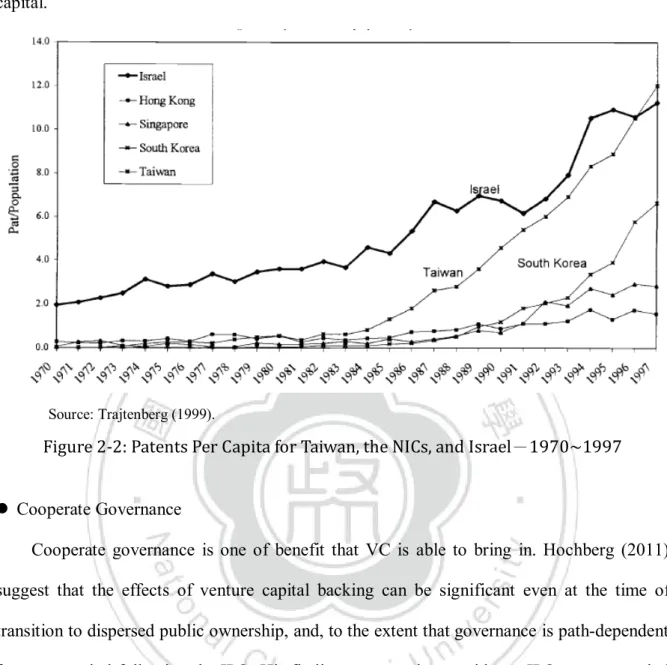
In 2010, venture capital backed companies had revenues corresponding to 21% of U.S. GDP and their headcount made up 11% of private sector jobs. Given that venture investment is less than 0.2% of GDP that shows the power of these growing businesses. Figure 2-2 shows their ranking ahead of all of the G7 countries except the U.S. and Japan in patents per
capital.
Source: Trajtenberg (1999).
Figure 2-2: Patents Per Capita for Taiwan, the NICs, and Israel-1970~1997 Cooperate Governance
Cooperate governance is one of benefit that VC is able to bring in. Hochberg (2011) suggest that the effects of venture capital backing can be significant even at the time of transition to dispersed public ownership, and, to the extent that governance is path-dependent, for some period following the IPO. His findings are consistent with pre-IPO venture capital backing having an effect on the governance and monitoring of the entrepreneurial firm at the time of transition to the public markets.
2.2 Overview of the Global VC Market
Worldwide, the U. S. is not only managing the largest portion of the global VC capital, but also the largest investor of the VC industry. In 2011, the U. S. venture capitalists manage the capital of US$ 196.9 billion and keep on playing the largest investor, according to NVCA. The European VC and PE firms hold a staggering US$138 billion of “dry powder” and are
seeking opportunities before their investment periods end.1 In 2010, the VC capital under management in China was closed to RMB (Renminbi) 240.66 billion, according to the Development Report of China VC Investment 2011. The VC scale in China is still behind the U. S. and Europe.
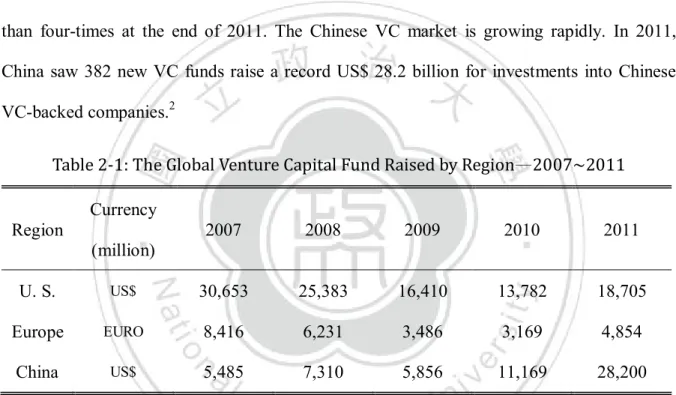
However, China attracts the significant amount of money for the rising market in the recent five years. As shown in Table 2-1, in 2007, the VC fund raised in China was nearly one-sixth of the capital raised in U. S., by contrast, the amount continuously grows by more than four-times at the end of 2011. The Chinese VC market is growing rapidly. In 2011, China saw 382 new VC funds raise a record US$ 28.2 billion for investments into Chinese VC-backed companies.2
Table 2-1: The Global Venture Capital Fund Raised by Region—2007~2011 Region Currency (million) 2007 2008 2009 2010 2011 U. S. US$ 30,653 25,383 16,410 13,782 18,705 Europe EURO 8,416 6,231 3,486 3,169 4,854 China US$ 5,485 7,310 5,856 11,169 28,200
Source: Compiled from EVCA (2012), EVCA Yearbook 2012; NVCA (2012), NVCA Yearbook 2012; and CVCRI (2012) , China Venture Capital & Private Equity Rising Report 2011.
While the U. S. VC still dominates, Asia is starting to surpass Greater Europe. The VC hotbeds around the world have seen some major shifts in recent years. Most notably, China and India are beginning to challenge Europe and Israel in investment amounts, respectively. In the past five years, China’s VC investment amount surged dramatically, from US$ 3.2 billion in 2007 to US$ 11.7 billion in 2011, in contrast, Europe’s number of investments is
1
See ERNST & YOUNG (2012), Globalizing Venture Capital Insights and Trends Report 2011.
2
See Zero2IPO (2012), China Venture Capital & Private Equity Rising Report 2011. Zero2IPO is a leading integrated service provider in the China venture capital and private equity industry.
still in steady decline (Table 2-2). Furthermore, due to Europe’s sovereign debt crisis and its muted medium-term growth potential, Europe’s VC industry has lost some of its robustness.
Table 2-2: The Global Venture Capital Investment by Geography—2007~2011 Region Currency (million) 2007 2008 2009 2010 2011 U. S. US$ 30,921 30,583 19,767 23,273 28,675 Europe EURO 6,193 6,849 4,125 3,932 3,896 China US$ 3,247 4,210 2,701 5,387 11,725 Israel US$ 1,900 2,100 800 1,800 1,600 India US$ 900 1,700 800 1,100 1,500
Source: Same as Table 2-1.
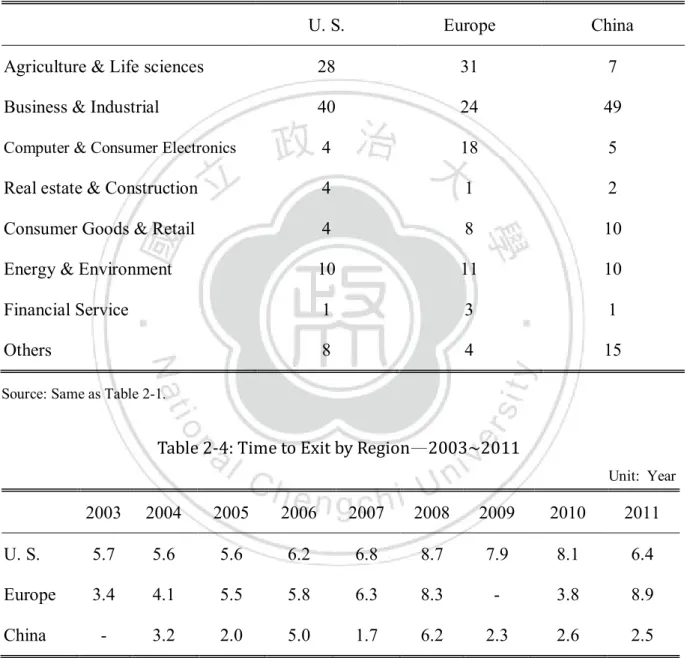
Due to China has a huge internal consumer market, the VC’s spotlight focuses more on the retailer market and e-commerce sectors. In 2011, the internet and telecommunication industry won nearly RMB 3.8 billion investment by the VC. Compare to the 30% of investment amount on the Agriculture and Life sciences in the West, the investment opportunity on Medical and Biotechnology is still rare in China (Table 2-3).
Compare to the West, China’s VC has relatively short time to exit. The more mature U. S. VC markets consistently invest a considerable amount in companies in the earlier “product development” stage (pre-revenue). In contrast, China generally prefer later-stage companies, and has a unique pattern of pouring only 15% below of its invested capital into the early stage, that’s why the Chinese VC has lower than 3 year of exit time in the recent three years (Table 2-4).
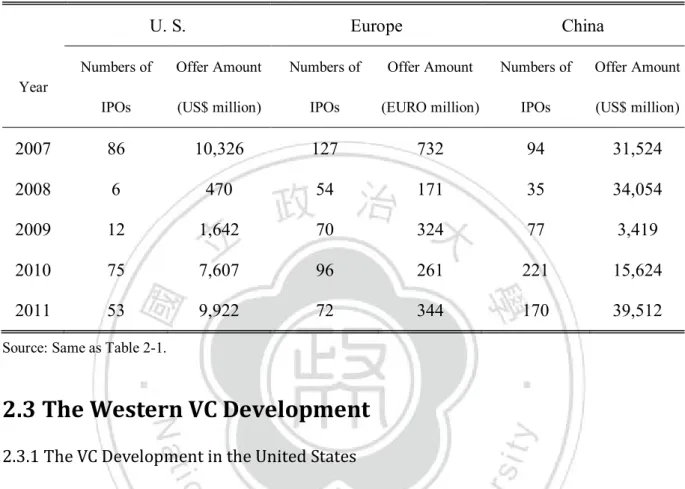
For the post investment, it benefits from the Chinese economy rising, the IPO by the Chinese enterprises is growing tremendously (Table 2-5). Therefore, the Chinese enterprises
backed by VC have become the anchor targets on the global stock market. The Chinese enterprises now are playing the most important role on the IPO market, even in 2009 after the 2008 financial tsunami.
Table 2-3: Venture Capital Investments by Industry Sector—2011
Unit: %
U. S. Europe China
Agriculture & Life sciences 28 31 7 Business & Industrial 40 24 49
Computer & Consumer Electronics 4 18 5 Real estate & Construction 4 1 2 Consumer Goods & Retail 4 8 10 Energy & Environment 10 11 10
Financial Service 1 3 1
Others 8 4 15
Source: Same as Table 2-1.
Table 2-4: Time to Exit by Region—2003~2011
Unit: Year
2003 2004 2005 2006 2007 2008 2009 2010 2011 U. S. 5.7 5.6 5.6 6.2 6.8 8.7 7.9 8.1 6.4 Europe 3.4 4.1 5.5 5.8 6.3 8.3 - 3.8 8.9 China - 3.2 2.0 5.0 1.7 6.2 2.3 2.6 2.5
Source: Same as Table 2-1.
In addition, the venture capital industry is experiencing a global shift, ranging from global fund-raising and cross-border investment, to exits on foreign stock exchanges or by
foreign acquirer, to VC firms opening offices overseas and helping their portfolio companies, access markets in new regions.
Table 2-5: The Comparison of Venture-Backed IPOs—2007~2011
U. S. Europe China Year Numbers of IPOs Offer Amount (US$ million) Numbers of IPOs Offer Amount (EURO million) Numbers of IPOs Offer Amount (US$ million) 2007 86 10,326 127 732 94 31,524 2008 6 470 54 171 35 34,054 2009 12 1,642 70 324 77 3,419 2010 75 7,607 96 261 221 15,624 2011 53 9,922 72 344 170 39,512
Source: Same as Table 2-1.
2.3 The Western VC Development
2.3.1 The VC Development in the United States
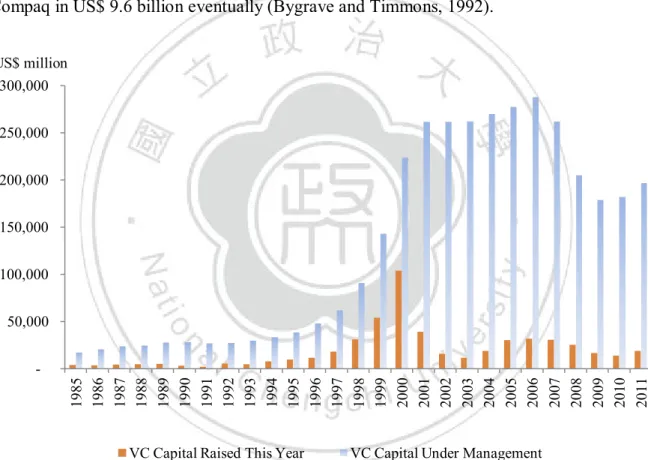
Even the U. S. still dominants the largest pool the venture capital. The VC industry in the U. S. continues to contract from the circa 2000 bubble high. The increase in capital was due to 2011 fundraising being stronger than it was eight years prior to 2003. Total capital total is well below US$ 220.3 billion in the bubble peak. The activity level of the U. S. venture capital industry is around half what it was at the 2000-era peak. For example, in 2000 more than 1,000 firms invested US$ 5 million or more during the year. In 2011, the amount was roughly half that (Figure 2-3).
Historically, the first VC was born in the U. S. can be traced the beginnings of the U. S. VC industry to the 1920s-1930s, when wealthy families and individuals directly provided large sums of start-up money for companies such as Eastern Airlines and Xerox. The first
organized venture capital firm was not founded until 1946, when Ralph E. Flanders, the president of the Federal Reserve Bank of Boston, and General Georges Doriot, a professor at the Harvard Business School, established American Research and Development (ARD) for the specific purpose of providing risk capital for new ventures. In 1957, the firm invested US$ 70,000 in exchange for 77% of common stock in a new company formed by four M.I.T graduate students. By 1971, the investment had grown to comprise US$ 355 million in common stock in Digital Equipment Corporation (DEC). DEC was acquired in June 1998 by Compaq in US$ 9.6 billion eventually (Bygrave and Timmons, 1992).
Source: NVCA (2012), NVCA Yearbook 2012.
Figure 2-3: The U. S. Venture Capital Scale—1985~2011
While VC comprises a relatively small percentage of capital market activities in the U. S., it provides an important source of funding for small businesses and offers the potential for high returns for investors. The industry has been responsible for helping to establish
-50,000 100,000 150,000 200,000 250,000 300,000 1985 1986 1987 1988 1989 1990 1991 1992 1993 1994 1995 1996 1997 1998 1999 2000 2001 2002 2003 2004 2005 2006 2007 2008 2009 2010 2011 US$ million
numerous successful enterprises. Among them are Apple, Intel, Federal Express, Microsoft, and Lotus Development.
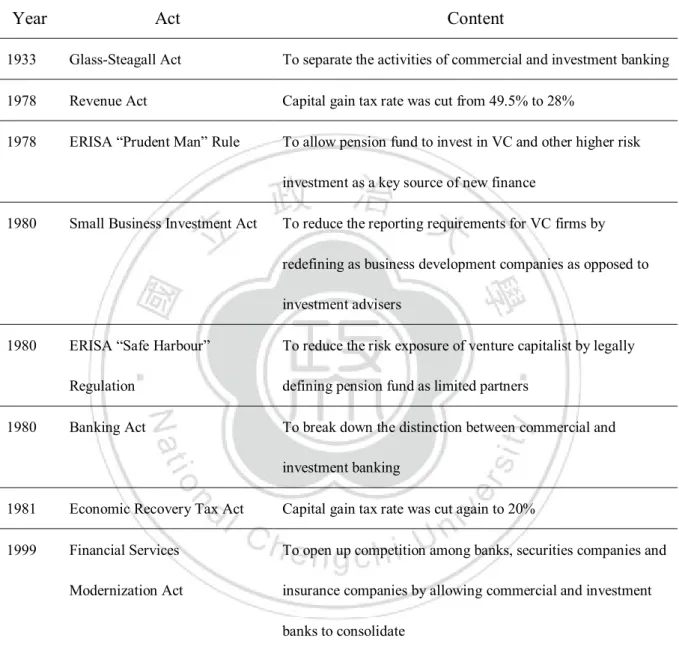
The venture capital industry’s growth in the U. S. was hampered by the recession set off by oil crises of the seventies. Venture capitalist, entrepreneurs, and government jointed in a combined effort to help revive the industry, started from 1978 to 1982. A more favorable environment for venture capital market was created by legislation (Table 2-6).
The Glass-Steagall Act was passed in 1933 to separate the activities of commercial and investment banking. Named after Senator Carter Glass and Congressman Henry Steagall, the act was a response to commercial banks' stock market speculation, which was widely seen as contributing to the Wall Street Crash of 1929. Banks were using depositors’ money to take a punt on stock markets as well as reselling shares back to their retail customers. The act forced banks to specialize in commercial or investment banking.
The Banking Act in 1980 allowed the commercial banks to expand into securities transactions, and commercial banks therefore became the formidable players in investment banking with their substantial asset base. Many bankers saw it as draconian response and campaigned against it for years on the basis that diversification helped spread risks. The Financial Services Modernization Act (also called the Gramm-Leach-Bliley Act) of 1999 repealed part of the Glass-Steagall Act. It allowed commercial and investment banks to consolidate.
The Banking Act in 1980 allowed the commercial banks to expand into securities transactions, and commercial banks therefore became the formidable players in investment banking with their substantial asset base. Many bankers saw it as draconian response and campaigned against it for years on the basis that diversification helped spread risks. The Financial Services Modernization Act (also called the Gramm-Leach-Bliley Act) of 1999 repealed part of the Glass-Steagall Act. It allowed commercial and investment banks to
consolidate, the so-called “financial super market” to be able to provide a comprehensive service to the clients.
Table 2-6: The Legalization of the VC in U. S.
Year Act Content
1933 Glass-Steagall Act To separate the activities of commercial and investment banking 1978 Revenue Act Capital gain tax rate was cut from 49.5% to 28%
1978 ERISA “Prudent Man” Rule To allow pension fund to invest in VC and other higher risk investment as a key source of new finance
1980 Small Business Investment Act To reduce the reporting requirements for VC firms by redefining as business development companies as opposed to investment advisers
1980 ERISA “Safe Harbour” Regulation
To reduce the risk exposure of venture capitalist by legally defining pension fund as limited partners
1980 Banking Act To break down the distinction between commercial and investment banking
1981 Economic Recovery Tax Act Capital gain tax rate was cut again to 20% 1999 Financial Services
Modernization Act
To open up competition among banks, securities companies and insurance companies by allowing commercial and investment banks to consolidate
Source: Compiled from Pfirrmann et al. (1997) and Media News by Author.
However, after the financial tsunami in 2008, the top five investment banking in U. S. have been either sold to the commercial banks or transformed to Pure-Play/Non-Deposit Taking Investments banks. It means that the investment banks have to be monitored more strictly than before by the authorities (Table 2-7).
Table 2-7: The Transformation of the Top 5 U. S. Investment Banks after 2008 Year/Month/Date Company Consequence
2008/3/16 Bear Stearns Acquired by J. P. Morgan 2008/9/14 Lehman Brothers bankruptcy
2008/9/16 U.S operations Acquired by Barclays 2008/9/22 European and Asian operations Acquired by Nomura 2008/9/14 Merrill Lynch Acquired by Bank of America 2008/9/21 Goldman Sachs Converted to Bank Holding
Company Morgan Stanley
Source: Compiled from Media News by Author.
2.3.2 The Model of Silicon Valley
From Table 2-8, VC investment in the U. S. has high exposure in the seed and early stage historically. It does not differentiate the U. S. VC from the VC in Europe, but also provides the fundamental of the model of Silicon Valley in success. Silicon Valley is generally viewed as a habitat for innovation and entrepreneurship (Koh and Koh, 2002).
Table 2-8: The U. S. VC Investment by Stage—1985~2010
Unit: % 1985 1990 1995 2000 2005 2010 Seed 19.01 14.60 15.35 2.91 4.22 7.56 Early Stage 19.27 25.26 22.47 23.34 17.15 24.40 Expansion 44.41 44.75 46.33 57.53 37.31 38.38 Later Stage 17.31 15.40 15.85 16.22 41.32 29.66
Source: Same as Figure 2-6.
The importance of venture capital in the economic growth process is seen most clearly in the contribution of Silicon Valley to the U. S. economy. Silicon Valley is better seen as a
style or culture of conducting business and investing, with a product that happens to be technology. Silicon Valley can also be compared with entrepreneurial “clusters”.
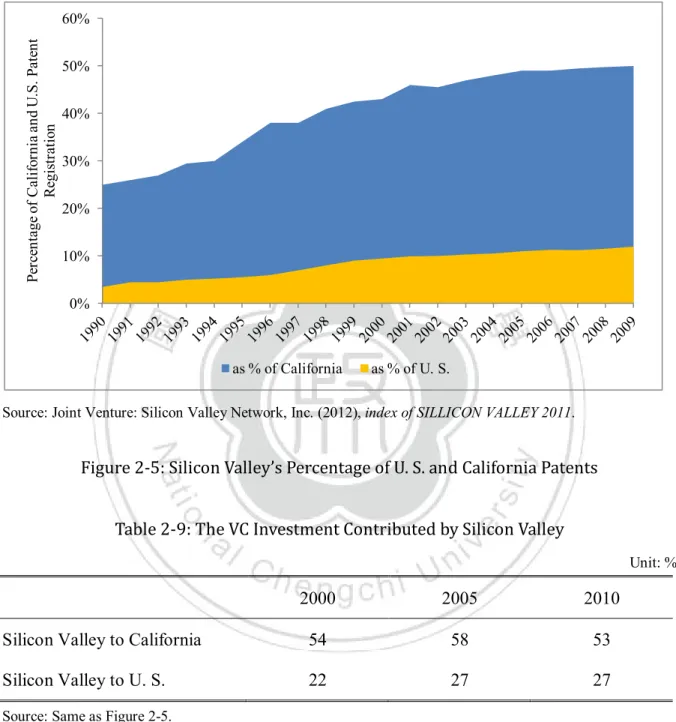
In Figure 2-8, it shows that Silicon Valley's percentage of patent registrations in the U. S. and in California continued to climb year over year. In the end of 2009, Silicon Valley contributed nearly 50% of the patent registrations in California, which was more than one tenth of the total registrations in the U. S.
VC investment in Silicon Valley is consequently aggressive as well. The VC investment in 2010 reaching nearly US$ 5.9 billion , which accounted for 27 percent of the nation’s total VC investment and 53 percent of the state’s in 2010 (Table 2-9). In addition, according to a study by Barry et al. (1990), 30% of the market value of firms going public between 1978 and 1987 had received venture capital financing. Furthermore, cleantech venture capital investment in Silicon Valley exceeded US$ 1.5 billion in 2010, up eleven percent from the prior year, accounting for 25 percent of the total investment. The Valley still plays a crucial role on the industrial fosters and innovation engine.
Saxenian and Hsu (2001) noted that the impact that the transnational community that developed as a result of the Silicon Valley connection has accelerated the upgrading of Taiwan's technological infrastructure by transferring technical know-how and organizational models as well as by forging closer ties with Silicon Valley. This linkage with the Silicon Valley is one factor contributing to the attraction of China, Taiwan and India as destinations for venture capital investments. These countries are now benefiting from the flow of talent, expertise and funding from their countrymen who had previously left for Silicon Valley and other technology hubs in the U. S.
The successes of Silicon Valley in fostering innovation and growth have prompted the other countries to announce plans to develop their own versions of Silicon Valleys, and support the development of venture capital industry. Such as Taiwan and Israel benefit from
close linkages with Silicon Valley in the United States, fostered by U. S. educated entrepreneurs and venture capitalists.
Source: Joint Venture: Silicon Valley Network, Inc. (2012), index of SILLICON VALLEY 2011.
Figure 2-5: Silicon Valley’s Percentage of U. S. and California Patents Table 2-9: The VC Investment Contributed by Silicon Valley
Unit: %
2000 2005 2010 Silicon Valley to California 54 58 53 Silicon Valley to U. S. 22 27 27
Source: Same as Figure 2-5.
2.3.3 The VC Development in Europe
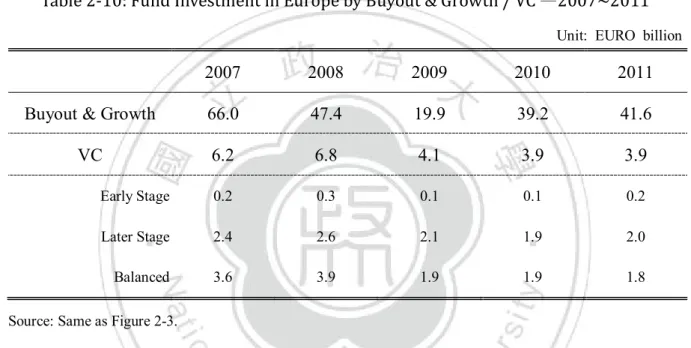
Unlike the U. S., the European VC prefers to invest in late stage of the investment project. In general, a large and increasing proportion of capital in Europe has been invested in management buyouts and buyins and there has been invested in very little investment in
0% 10% 20% 30% 40% 50% 60% P er ce n ta ge o f Ca li fo rn ia a n d U .S . P at en t R egi st ra ti o n as % of California as % of U. S.
start-ups and early stage investments, especially in technology-based sectors. From Table 2-10, it is clear that the European VC focuses more on the Buyout & Growth fund.
United Kingdom
The United Kingdom (UK) has the most active VC investment in Europe. In Figure 2-6, it shows that UK still has the most active VC investment in Europe and accounting for thirty to forty percent of the total investment value, according to EVCA.
Table 2-10: Fund Investment in Europe by Buyout & Growth / VC —2007~2011
Unit: EURO billion
2007 2008 2009 2010 2011 Buyout & Growth 66.0 47.4 19.9 39.2 41.6
VC 6.2 6.8 4.1 3.9 3.9
Early Stage 0.2 0.3 0.1 0.1 0.2
Later Stage 2.4 2.6 2.1 1.9 2.0
Balanced 3.6 3.9 1.9 1.9 1.8
Source: Same as Figure 2-3.
Prior to the 1980s, the only sources of venture capital in UK were the small business finance arms of the cleaning banks, merchant banks which specialized in small business clients (notably the National Enterprise and Development Corporation and the National enterprise Board, subsequently merged and renamed the British Technology Group) and Investors in Industry (3i). The foundation of the institutional UK venture capital industry can be traced to the setting up of 3i, as the Industrial and Commercial Finance Corporation (ICFC), and 3i was by far the most important of these sources of small business finance.
It had been established in 1945 by the Bank of England and the major clearing banks to provide long-term finance to growing firms. Only part of 3i’s activities can be considered as “pure” venture capital, investment is shares in small unquoted companies with the
expectation of capital gain. In the 1960s, the venture capital industry developed through the expanded activities of 3i and other private and public sector initiatives; there was general acceptance of the view that the small firm finance gap had effectively been closed.
Source: ERNST & YOUNG (2012), Globalizing venture capital insights and trends report 2011.
Figure 2-6: The Europe VC Investment by Country
In the 1970s, this early development of the UK venture capital industry was not maintained as rising interest rates made high-risk investments less attractively, and the structure of the financial markets limited the opportunities for realizing venture capital investment (Meade, 1977). In 1980s, an enormous expansion occurred in the number of private venture capital funds. Prior to 1979 there were just over twenty venture capital funds with a total investment of 20 million British pounds. Some 10 years later there were over 150 funds which invested over1 billion British pound sin the UK in 1988. In the 5 years to 1988 approximately 3 billion British pounds has been invested by UK venture capitalists, 89 percent in the UK homeland (Pratt, 1990).
0.0 0.5 1.0 1.5 2.0 2.5 3.0
UK France Germany Switzerland
US$ billion
Germany
The German venture capital market came into being in the 1960s as a result of an ongoing discussion on the part of the banks over private capital deficits and sinking private capital quotas for medium-sized companies and savings banks. This led to the creation of the first stock cooperation on this market to provide private capital or similar funds to medium-sized firms (i.e. firms with about 1,000 employees or an annual turnover of DM 100 million) that were not in a position to go public.
The second phase in the development of the German venture market began with a founding wave that occurred in the early seventies. Since 1970, the German Ministry of Economic Affairs, as the caretaker of European Recovery Program (ERP) special funds, has been offering refinancing funds at favorable interest rates as well as return guaranties for non-profit guarantee societies if they become involved in medium-sized firms. The expansion of the ERP program aimed at making it possible to use factors of economic promotion to prompt the funding of capital joint venture companies. This was intended to help secure existing medium-sized firms, as private societies did not use the ERP special funds offered to the extent anticipated.3
The third phase in the development of the German venture capital market started in the early eighties. It came about as a result of information and discussions over what the successful American venture-capital model had to offer. In the case of private capital and management that were supporting young high-technology firms with a high growth potential, the successful examples of Apple of Genentech (including the figures for turnover, profit and participation effects of firms financed by venture capital) also triggered venture-capital euphoria in Germany.
3
The Federal Laender promoted the creation the Mittelständische Beteiligungsgesellschaften (MBG), i.e. investment companies that aimed to provide equity capital of SMEs, especially in the form of silent partnership. MBGs initiated business activities in all Federal Laender in the seventies and eighties. Up to date, most of the MBGs had already either limited or even terminated their investment participation in the second half of the seventies.
1983 was the year in which the German venture capital scene was born, when associated companies such as “International Venture Capital Partners” and “Techno Venture Management” were created by banks and industrial firms following the U. S. model. Foreign venture capital firms also appeared on the German market in the second half of the eighties. This phase may be considered as the rapid development phase of the German venture capital market also got under way. Starting around 1964, this continued of twenty years, as subsequent calculations were to show, resulting in a portfolio of up to 1 billion DM. Four years later this figure had reached 2 billion DM and rose to more than 5.3 billion DM in 1994. From 1983 to 1994 the market volume increased by a factor of seven; a factor which includes the number of partnerships (Pifirrmann et al., 1997).
From Figure 2-7, the UK, France and German are the top three VC investors in Europe, their VC investment to GDP is higher than the average ratio of total Europe.
Source: EVCA (2012), EVCA Yearbook 2012.
Figure 2-7: VC Investment Contributed to European GDP-2011
0.047 0.037 0.03 0.029 0.000 0.005 0.010 0.015 0.020 0.025 0.030 0.035 0.040 0.045 0.050
UK France Germany European total
2.4 The Eastern VC Development
In fact, Taiwan along with Israel, have tight relationship with the Silicon Valley. Therefore, the VC in these two countries has developed the particularly innovation-driven force such as the Silicon Valley model (Saxenian and Hsu, 2001).
2.4.1 The VC Development in Taiwan
The Taiwanese venture capital industry remains the most dynamic in Asia and has forged very strong relationships with Silicon Valley. In addition, the Hsinchu Technology Park has had considerable success in the creation of technology startups, and is the demonstration of domestic industry development (Koh and Wong, 2005). Saxenian and Hsu (2001) also stated that Silicon Valley and Hsinchu might be viewed as industrial clusters, in which competition and vertical cooperation among local firms account for rising productivities, innovation and new firm formation. The development of an international technical community has also transformed the relationship between the Sillicon Valley and Hsinchu economies. The community of U. S.-educated Taiwanese engineers has coordinated a decentralized process of reciprocal industrial upgrading by transferring capital, skill and know-how to Taiwan, and by facilitating collaborations between specialist producers in the two regions. The cross-Pacific collaboration extends the localized processes of innovative upgrading through experimentation and recombination that occur within each region.
There was also strong government support for the Taiwanese venture capital industry through the provision of tax incentives. In 1983, tax incentives were given to individuals willing to invest in professional venture capital firms. Up to 20 percent tax deduction for Taiwanese individuals were given provided they maintained their venture capital investment for at least two years. Besides the investment in venture capital funds, the Taiwanese government also initiated the development of the Hsinchu Science District in 1980, with the
objective of attracting Taiwanese technologists and entrepreneurs located in the Silicon Valley to return to Taiwan.
The venture capital industry in Taiwan has facilitated the rapid developments of high-tech industries in Taiwan. Since its introduction in 1984, venture capital industry in Taiwan had raised over 170 billion NTD (new Taiwan dollar) for more than 12,000 venture targets. The capital indirectly brought in through venture capital in Taiwan had accumulated to 2.4 trillion NTD, equivalent to 19% of Taiwan’s GDP of 2007. At the end of 2007, nearly one out of two high tech listed companies in Taiwan had obtained venture capital investment. Thus it is clear that the venture capital industry had made great contributions to the early-stage and newly risen high- tech sector and Taiwan’s economic growth as well (Chou, 2009). In 1998, 109 of the 272 companies established in the Hsinchu district were founded by Taiwanese entrepreneurs who have had managerial, business and entrepreneurial experience in the U. S. (Lee and Yang, 2000). In Figure 2-8, it is easily to tell the significant contribution that Hisnchu Science Park made to the GDP of Taiwan. Even the sales to GDP ratio seems declined from 9.55% in 2004 to 7.53% in 2011, however, the ratio keeps growing to 13.9% if Central and Southern Taiwan Science Parks were included.
Throughout the late 1980s and 1990s, Taiwan’s VC industry supported the process innovation based development projects of the island. The VC industry’s relationship with innovation is a systemic one. By the 1990s, venture capital had become a key component of Taiwan’s innovation system. There were rapid technology based developments, but they were based on process innovation, not new-product innovation. The difference may seem subtle, but in reality the dominance of process innovation has set the tone for Taiwanese economic development and venture capital activity through to the present. Accordingly, to be successful the enterprises had to quickly adopt existing technologies into an efficient and
cheap product design timed to the market that met the needs of their customers and the requirements of their manufacturers.
Source: Hisnchu Sicence Park (2012), Yearbook 2012.
Figure 2-8: Sales of Hisnchu Science Park and GDP in Taiwan—1991~2011
The traditional Taiwanese VC investment mindset was tuned to turn a profit on these types of opportunities that required little value-added services, had shorter development times and lacked technology risk. The most valuable service VCs often provided was contacts to help portfolio companies quickly integrate into the supply chain. However, the process innovation-driven industries (such as IC and equipment manufacturing) have matured or moved away and are producing fewer investment opportunities for VCs. Taiwan’s general investment environment has also been harsh (Badino et al., 2006).
According to the Taiwan Venture Capital Association (TVCA), the VC activities in Taiwan were aggressively before 2001 (Figure 2-8). It was not only due to the model of process innovation getting matured, but also the 2000 internet bubble burst. During the bubble, Taiwanese VCs poured a lot of capital into overseas markets, specifically the U. S. This frenzy reached a high in 2001 when over 46% of its VCs’ cumulative investments were
1.57 2.66 4.11 4.94 9.12 9.55 7.53 -2.00 4.00 6.00 8.00 10.00 12.00 0 200 400 600 800 1000 1200 1400 % NT$ billion
overseas. When the bubble burst, the VCs were hit hard, especially in the U. S. The Taiwanese VC community’s reaction to this event was a large-scale pull out of the U. S. market. The ratio of early stage investments to total investments dipped from a high of almost 46% in 2001 to 9.3% in 2009.
Source: TVCA (2011), TVCA Yearbook 2010.
Figure 2-9: VC-Investment in Taiwan by Stage—1997~2011 2.4.2 The VC Development in Israel
As for Israel, it is often considered as the most successful case of the export of Silicon Valley-style venture capital practice. The close relationships between Israelis and Jewish individuals in the high-technology industry of the U. S. have enabled the development of the Israeli venture capital industry since the 1980s. It was until the creation of a government-funded Israeli venture capital fund, named Yozma, in 1993 that the venture capital industry in Israel took off. Yozma was very successful and was credited with triggering the creation of the domestic VC industry in Israel.
-10,000 20,000 30,000 40,000 50,000 60,000 1997 1998 1999 2000 2001 2002 2003 2004 2005 2006 2007 2008 2009 NT$ million
In Israel, the government also plays an important role in encouraging the growth of venture capital. In 1991, there was only one venture capital fund, it was Athena Venture Partners Fund with size of US$ 29 million. Since 1995, the Israeli venture capital industry has raised and managed more than US$ 11 billion, and over 120 Israeli companies, mostly venture-backed, have been listed on NASDAQ(National Association of Securities Dealers Automated Quotations) with a combined market capitalization exceeding US$ 42 billion (Hasson, 2005). The Israeli government has also been generous in its fiscal incentives to start-ups and to foreign investment. Generous tax incentives and grants were offered to attract U. S. technology companies to locate R&D operations in Israel.4
Avnimelech (2008) states that Israeli government’s entrepreneurial innovation and technology policy (EITP) is triggering a VC industry. The promotion by the Israeli government promote of the start-ups seems to be crucial to the creation of a high-tech cluster and in sustaining it high impact and growth (Figure 2-10).
Source: Avnimelech (2008).
Figure 2-10: Israel’s EITP Profile: Policies and Impacts
4
Such a strategy was necessary in the early years of Israel’s venture capital industry. The strategy has worked; at present, many of the world's leading companies, including Cisco. Intel, Motorola, Sony and Volvo, have significant operating and R&D presence in Israel (Koh and Wong, 2005).
Phase 1
• Diffusion of R&D and generation of innovation capabilities (1969-1984)
Phase 2
• Extensive start-up and VC experiments (1985-1992)
Phase 3
• Targeting VC and accerlerated growth of R&D /innovation activities and start-up intensive high-tech cluster (1993-2000)
Phase 4
• Congfronting with the crisis and system failure and experiment with sophisticated targeted related policy (2001-2005)
In 2010, Israeli VC funds were not able to attract new capital during the year. Capital raising trends in Israel tend to be in line with trends in the U. S., where a 50% reduction was seen from 2009 levels (Figure 2-11). Also, the VC investment correlation between Israel and the U. S. is significant.
Israeli entrepreneurs have a proven technological track record in network security and data communications, and the top-tier venture capital firms in Israel have been able to generate returns comparable to those found in Silicon Valley.
However, on the other hand, the Israeli VC was associated with the transformation of Israeli’s high-tech industry-from a military-dominated industry toward a start-up-intensive high-tech cluster. This case probably represented the most successful instance of diffusion of the Silicon Valley model of VC and star-up-intensive high-tech cluster beyond North America (Avnimelech, 2008).
In addition, some scholars claim that Israel, in select niches, has successfully completed new-product innovation projects and launched their products in large foreign markets, primarily the U. S. Product innovation based investment opportunities, with their technology risk, long R&D stages, greater service demands and historically poor performance in Taiwan’s environment have been unappealing to Taiwanese VCs who also lack experience in managing these investments effectively. The cost of this seemingly endless cycle is an innovation system with underdeveloped new-product innovation capabilities and players from government to industry to the VC community that are reluctant or unwilling to take the initiative necessary to develop and support these capabilities (Badino et al, 2006).
To be briefing, in Israel and Taiwan, there is a stronger entrepreneurship culture. Moreover, R&D intensity is much higher, and there are stronger linkages with other technological hotspots such as Silicon Valley.
Source: NVCA(2012) and IVC Research Center.
Figure 2-11: Comparison of Israeli and American VC Fund Raised—2002~2011 2.4.3 The VC Development in Japan and Singapore
In Asia (Taiwan and Israel excluded), the major countries are reluctant to invest the start-ups and early stage, as well as the European VC. Therefore, Bruton et al. (2003) called the venture capital in East Asia as private equity financing. In the West, venture capitalists are engaged in early stage investments.
Japan
Japan was used to be the largest VC market in East Asia, however, it depressed dramatically. The investment made in 2009 fell by about 40% annually to Japanese Yen 37.8 billion (US$ 417 million), an even more marked sharp drop compared with 2007, when VCs invested about Japanese Yen 193 billion (US$ 2.1 billion), according to the Japan Venture Capital Association (JVCA).5
5
The amount was much lower than the US$ 2.7 billion investment in China VC. In addition, the venture capital over 472 deals from one year ago, Activities of venture capitalists have ebbed since their portfolio companies have been affected by the onset of the economic downturn, giving no option for investors to exit while they struggle with fundraising. As for new fund formation, only three venture funds raised 2.4 billion Japanese yen (US$ 26.5 million) in 2009, compare with nearly US$ 5.9 billion raised in China within the period.
2.8 1.3 0.3 0 0.6 1.5 0.8 1.1 0.9 0.2 0 0.8 -20 40 60 80 100 120 0.0 0.5 1.0 1.5 2.0 2.5 3.0 2000 2001 2002 2003 2004 2005 2006 2007 2008 2009 2010 2011 US$ billion US Israel (LHS)
In the1970’s, Japanese main financial institutions formed their risk averse subsidiaries. Furthermore, hot markets in the1980s stimulated Japanese attention and accelerated forming new venture capital companies (Kirkulak, 2004). Basically, Japanese venture capital industry is one of the most established venture capital industries in the world. It started its venture capital industry about 30 years ago. To date, it still has many of the world’s largest private equity groups attached to NTT, Softbank and Honda. In Japan, it was the first VC boom from 1970 to 1973. In 1971, some members of Kyoto Economic Council visited Boston. After their coming back, they tried to set up the first Venture Capital Firm in Kyoto. So, the first VC firm named Kyoto Enterprise Development (KED) was set up in Kyoto in 1972. Between 1972 and 1974, eight private VC firms (VCFs) were formed by major banks and security firms (four were formed by banks and four were formed by security firms). The large part of the Japanese VC pool is controlled by firms associated with securities companies.
In 1983 the Japanese government deregulated the over-the-counter (OTC) market act. This action made it easier for VCFs to make investments for new ventures managed toward IPO. So Japan stimulated a second VC boom. From 1980 to 1985, 68 VCFs were founded (Liang, 2008). However, the VC boom declined as a result of the recession caused by the rise of the yen in 1986 and 1987 after the Plaza Accord.
Traditionally Japanese venture capitalists invest in the later stage of a firm’s growth. They rarely invest in new business. It is due to the major Japanese financial institution formed VC subsidiaries.6
Furthermore, regulations and government policies force Japanese VCs take small stakes in a large number of firms; limiting the potential for true venture type businesses. The regulations restrict venture capitalists to take risky positions. Therefore, the holdings of venture capitalists in portfolio firms are relatively low.
6
Singapore
Recognizing the importance of VC in the growth process, the Singapore government has assiduously supported the development of the VC firms. Besides implementing regulatory and fiscal changes to attract top-tier international VC firms to establish a regional base in Singapore, the Government has also funded a number of new local and foreign VC funds based in Singapore. As Singapore restructures its economy in the midst of the current global economic downturn, VC will continue to play an important role in fostering entrepreneurship and economic growth. The Singapore government plays a key role in the development of the VC industry. First, there are several incentive schemes offered by the Singapore government to attract venture capital firms to locate in Singapore. These schemes include the Pioneer Service Incentive (Income Tax (Section 13H)) for new venture fund, the Venture Capital Incentive (section 97 of the Economic Expansion Incentives Act) for corporate investors, as well as subsidies for training of venture capital professionals (Koh and Koh, 2002).
Besides providing tax incentives to operate in Singapore, the government is a significant institutional investor in new venture capital funds. About 30% of the venture capital present in Singapore had its origins in government funding.
In Singapore, one of the first venture capital fund set up in Singapore was South East Asia Venture Investment (“SEAVI”) in 1983, with participation from the U.S venture capital firm Advent International. The first public investment in venture capital fund was in 1986 by the Economic Development Board of Singapore (EDB). Government agencies that have invested in venture capital as passive investors include Temasek Holdings,7 Government of Singapore Investment Corporation (GIC) and the Infocomm Development Authority (iDA).
7
Temasek Holdings is not a pure venture capital firm. According to the Temasek Review 2011, Temasek is an investment company and managed SUS dollar193 billion in portfolio at 31 March 2011. Its top five investments are mainly listed companies such as Bank of China, China Construction Bank, Standard Chartered PLC, Singapore Telecommunications Limited and Li & Fung Limited. Furthermore, the portfolio value in 2003 was SUS dollar 90 billion, compare to the VC capital under management in Singapore was 10.72 billion US dollars in the period.
Several government agencies, such as the EDB have also taken an active role to set up technology and biotechnology venture capital funds and directly managed them.
As in other parts of Asia, venture capital firms in Singapore focus more on late-stage expansion financing and investment in mature companies, rather than early-stage financing in startups. Very few venture capital funds invested in start-ups unless there are significant compensatory government incentives to do so (Koh and Wong, 2005). Meanwhile, Singapore’s venture capital industry is much less domestically invested.8
Due to the availability of various tax incentive schemes, Singapore attracted many foreign venture capital firms to use it as their regional base for investment in the Asian-Pacific region. Singapore's efficient legal, financial and urban infrastructure has always been a draw in encouraging multinational companies to establish their regional headquarters facilities in the country. They have invested in opportunities in China, India, Middle East, Japan, United States and Europe (Koh and Koh, 2002).
2.5 Summary
Unlike the U. S., the Europe and Asian venture capitalists do not take parts in start-ups so aggressively. They find these investments risky therefore most of VC investments are involved in later stages, except Israel and Taiwan before 2001.
In terms of development, the Asian private equity-venture capital industry is still relatively less developed compared with the United States and Europe. Generally, with a longer history of venture capital, the venture capital industry in Europe and the United States have well-developed mechanisms for monitoring and managing risks, as well as exercising governance. In Asia, the regulatory framework for the venture capital industry still lags
8
In 2000, close to 74% of Taiwan’s venture capital funds are invested domestically, compared with about15-30% in the case of Singapore (Koh and Wong, 2005). In 2003, the VC investment in Singapore was
behind although governments have recently stepped up efforts to create the appropriate set of incentives and legislation to promote and regulate the venture capital industry.
Venture capitalists in Taiwan and Israel invest more in riskier early-stage investments, due to the connection with the Silicon Valley. Compared with Israel and Taiwan, the development of the venture capital industry in Asian region such as Hong Kong and Singapore are best considered as supply-pushed (i.e. driven by the government), rather than demand-pulled (i.e. driven by the demand for capital financing by startups and entrepreneurs).
C
hapter
3
The Venture Capital Industry in China
In this chapter, it is expected to discuss the legal environment and regulation development as a main part of the sector. We will review the historical development of the VC industry in China and then focus on its current status base on the legalization procedure. From the part, we expect to catch a broad view on the China VC industry for further studying.
3.1 The VC Market in China
China’s venture capital system has emerged over the last two decades in the context of China’s dramatic transition from central planning to more market-based coordination of economic activity. In 2011, the venture capital industry in China was rapidly growing with an estimated total of RMB 240.66 billion of funds in the country, another US$ 4.07 billion was raised worldwide to invest in China, according to Zero2IPO.
3.1.1 The Transition in Economic System
Previous research about VC and entrepreneurship in China often assumes that due to China’s transitional nature, there is a conflict between two institutional systems, socialism and capitalism (Bruton and Ahlstrom, 2003), and this conflict causes such confusion that entrepreneurial firms often cannot capitalize on some business opportunities. Fuller (2010) therefore argues that instead of inherent conflict between these two institutional systems, there is actually institutional separation although not on the neat socialist and capitalist divide envisioned in these earlier works. Instead of socialist and capitalist systems at loggerheads over the same institutional terrain, today there are two partially overlapping but mainly separate institutional systems, the one in which pervasive government influence shapes the marketplace and the one where foreign institutions, accessed via various offshore financial
arrangements and brought onshore via foreign direct investment (FDI). Thus, the government interference in the economy that many correctly noted in previous studies (Peng and Luo, 2000) is still there and still often unpredictable (Peng, 2001).9
The different learned experience gained from operating in different environments explains why the foreign firms avoid investing in technology-generating activities in China whereas the ethnic Chinese firms are willing to do so despite China’s notorious weak intellectual property rights regime. The political factors influencing the distribution of finance in China explain the behavior and essential failure of the local state-run venture capital firms. These findings demonstrate that several distinct, separate and non-clashing institutional arrangements are concurrently operating within China and shaping the behavior of venture capital firms there.
3.1.2 The VC Participants in China
Due to the political system, the VC source of Chinese is different from that of Japanese. The main source in China is from the government, while the financial system finances the venture capital to be extremely limited. The experience in the United States suggests that, as an economic policy, allowing pension funds to invest in venture capital could be a great success. Therefore, in the source of funds, China should let individual fund and the commercial fund enter the venture capital market, break the sole funds source pattern. Moreover, in the investment stage, the capital should invest into the seed and early stage of emerging and high tech enterprises. Today, there are four distinct types of VC firms in China,
Foreign Firms;
Government Firms (university firms included); Corporate Firms; and
9
However, today this pervasive government role in the economy is in one of the two institutional systems that potentially impact firms’ behavior. China’s transition has led not to a full-fledged market economy but to two divergent outcomes.
Chinese-foreign Equity Joint-venture Firms.
Each of the different types of venture capital firms has experienced some successes and some difficulties, though foreign venture capital firms are most active. Each of the different types of venture capital firms has experienced some successes and some difficulties, though foreign venture capital firms are most active (Ahlstrom et al., 2007). The VC industry in China saw meteoric growth through the decade, first led by American and other foreign private equity firms, with domestic firms entering the scene in late 2006 and rapidly catching up. The American private equity firms are pioneers and industry leaders in the world. There players brought fresh and bold ideas into the fledging and tightly controlled capital markets in China (Zhang, 2011).
From Figure 3-1, we see the RMB funds become the main power of venture capital market in China. The raising and investment of RMB Funds increased rapidly, about 70% newly raised funds in the total number were raised in RMB. Obviously, RMB began to dominate the absolute advantage in the number. although the foreign capital was still the main part in the volume, the foreign venture capital institutions have established RMB funds one after another with the gradual maturity of venture capital market. In terms of the structure of ownership, the local VC firms keep on growing and occupy around 40% of the investment amount (Figure 3-2). Both trends show that the Chinese venture capitalists are getting mature after 30 years development in China. The money inner China is not only sufficient for VC development, but also looks for investment opportunities outside.
It is mainly because that China government allows foreign private equity and venture capital firms to raise funds that are structured as limited partnerships (LP, it will be discussed in later content). It enables RMB funds to become the fund platform of choice for China's private equity market. These funds raise capital mainly from institutional investors such as government and corporate pension funds, insurance companies, and endowments, as well as