日射量估計模式比較之研究-以嘉義地區為例
廖大經
1,*、利幸貞
1、李炳和
2、陳俊仁
3、姚銘輝
3 1行政院農業委員會農業試驗所嘉義農業試驗分所農藝系
2行政院交通部中央氣象局嘉義氣象站
3行政院農業委員會農業試驗所農業工程組
摘要
日射量在農業生產或模擬作物生長模式
的研究中,是不可或缺的氣象資料,但常受
限於量測儀器不足或歷史資料的不完整,必
須以估計方式來彌補資料的欠缺。日射量估
計模式依其利用之氣象資料種類,可概分為
日照型、氣溫型、雲量型及其他等類型,不
同類型之模式各有其使用條件上的侷限及優
缺點,通常以地理(緯度、海拔)及氣候等因素
對於估計的影響最大。本研究以
2003-2010
年農業試驗所嘉義農業試驗分所與中央氣象
局嘉義氣象站的氣象資料,對於日照型模式
Angström-Prescott model 及 El-Metwally
model,氣溫型模式 Hargreaves model 及
Richardson model , 以 及 雲 量 型 模 式
Badescu model 等 5 個估計模式進行參數計
算及配適性指標
R
2之比較。另以嘉義農業試
驗分所之
2011-2013 年資料,及嘉義氣象站
2011-2012 年 資 料 進 行 估 計 準 確 度 指 標
RMSE、MBE、MABE、相關係數 r 及 t 統計
量的驗證比較。結果顯示,2 處氣象站一致以
日照型模式之配適性及估計準確度的表現最
好,其次為雲量型模式,而氣溫型模式最差。
關鍵詞︰日射量、日照、日射量估計模式、
嘉義。
Comparison of Model Estimation on
Solar Radiation-A Case Study in
Chiayi Area of Taiwan
Dah-Jing Liao
1,*, Hsin-Chen Li
1,
Ping-Ho Lee
2, Chun-Jen Chen
3and
Ming-Hwi Yao
31 Department of Agronomy, Chiayi Agricultural Experiment Branch, Taiwan Agricultural Research Institute, Chiayi 60044, Taiwan ROC 2 Chiayi Weather Station, Central Weather
Bureau, Chiayi 60086, Taiwan ROC
3 Agricultural Engineering Division, Taiwan Agricultural Research Institute, Wufeng, Taichung 41362, Taiwan ROC
ABSTRACT
Solar radiation is an indispensable climatic data for the use in estimating agricultural production or simulation model of crop growth. However, in case of malfunction of measurement devices, the missing data need to be provided by estimated values yielded from simulation models. Basically there are three types of simulation models for the estimation of solar radiation, sunshine-based model, temperature-based model and cloud-based model, by climatic data used. Each type of model has its own advantages and disadvantages, but is greatly affected by factors of geography (e.g., latitude and elevation) and surroundings. In this study, weather data from both Chiayi Agricultural Experiment Branch (CAEB) of Taiwan Agricultural Research Institute and Chiayi Weather Station (CWS) of Center Weather Bureau in 2003-2010 were used for parameters calculation and goodness of fit (R2). Five simulation models, Angström-Prescott model, El-Metwally model, Hargreaves model, Richardson model and Badescu model, were
* 通信作者, [email protected] 投稿日期:2013 年 11 月 25 日 接受日期:2013 年 12 月 25 日
作物、環境與生物資訊 10:261-271 (2013)
Crop, Environment & Bioinformatics 10:261-271 (2013) 189 Chung-Cheng Rd., Wufeng, Taichung 41362, Taiwan ROC
adopted. Weather data of 2011-2013 from CAEB and 2011-2012 from CWS were used for validation the accuracy of the estimated values, by the indices of RMSE, MBE and MABE, correlation coefficient (r), and t-statistic. Results of validation indices and goodness of fit indicated that sunshine-based models had the better performance in these two weather stations, followed by cloud-based model. On the other hand, temperature-based models had the least performance.
Key words: Irradiance, Solar radiation, Irradiance
estimation model, Chiayi.
前言
太 陽 經 由 核 融 合 反 應 所 產 生 大 量 的 熱
能,藉由電磁輻射的方式持續向宇宙發射,
稱之為日照(solar radiation),其中波長介於
0.25 至 3.0μm 的電磁波,包含了極大部分的
太陽輻射能(Duffie and Beckman 2013)。植
物或藻類吸收太陽輻射能以進行光合作用,
為地球上生命活動的基礎。另一方面,除了
傳統化石能源以外,太陽能也是推動農業設
施的再生能源之一。因此,在許多農業生產
研 究 , 或 是 模 擬 作 物 生 長 模 式 , 日 射 量
(irradiance) 是 不 可 或 缺 的 氣 象 資 料
(Mahmood and Hubbard 2002, Mavromatis
and Jagtap 2005)。但是,對於發展中國家或
是一些較為偏遠的地區而言,購置日射量儀
器所需的經費及維修校正技術上的短缺,造
成有關太陽能效率研究或利用的發展受到限
制。針對日射量估計模式的研究,對於彌補
日射量資料的不足,以及提高太陽能利用效
率方面,具有相當重要的理論與應用價值。
日 射 量 估 計 模 式 屬 於 經 驗 模 式
(empirical models) (Besharat et al. 2013,
Wu et al. 2007, Ahmad and Tiwari 2010,
Robaa 2009, Chen, et al. 2004),包括以氣象
參數利用回歸分析估計日射量。歷來學者即
根據不同的氣象參數,發展出相當多的估計
模式,可大致歸納為
4 種類型,即日照型、
雲量型、氣溫型及其他氣象參數型
(Besharat
et al. 2013)。亦有利用時間序列(Time series)
(Gordon and Reddy 1988) 或 傅 立 葉 分 析
(Fourier analysis) (Baldasano et al. 1988)等
數學分析方式來估計日射量,然而需要較為
艱深的數學理論,因此實用性不及回歸分析
方式(Yao et al. 2002)。氣象參數有很高的地
域性,受緯度、海拔高度及地形的影響很大,
也進而影響估計模式的效能。
世界各國不同地區的日射量估計模式屢
見發表於文獻中,Hounam (1963)利用日照
模式計算澳洲
6 個日射量測站逐月的模式參
數;Mavromatis and Jagtap (2005)利用氣溫
模式計算美國佛羅里達州
7 個氣象站的模式
參數;Yang and Koike (2002)以高空相對濕
度模式計算日本
18 個氣象站的模式參數;Liu
and Scott (2001)同時以氣溫及降雨量模式計
算 澳 洲
39 個 日 射 量 測 站 的 模 式 參 數 ;
Rivington et al. (2005)使用日照及氣溫模式
等
3 個模式估算英國 24 個氣象站的日射量,
並且對於不同模式間的估計效率進行比較。
在我國學者相關研究方面,
Yen (1974)利用臺
北、臺南、花蓮及宜蘭等
4 地的實測日射量
資料,分別以雲量及日照模式進行估計並加
以評估。
Lin and Su (1986)採用以日照模式所
改進之日本吉田回歸模式來推算臺灣地區逐
月平均日射量,並以臺北、臺中、臺南、高
雄、花蓮與臺東等
6 地的實測日射量作為驗
證。Tang (1979)以日照模式探討臺南地區日
射量與日照的關係。Chang (1992)以日照時
數、日照率及平均總雲量為自變數,根據各
別建立的回歸方程式,估算臺東地區的日射
量 , 並 與
Angström-Prescott model
(Angström 1924, Prescott 1940)比較,獲得
Angström-Prescott model 較 佳 的 結 論 。
Chen et al. (1994)採用 Angström-Prescott 模
式,以臺灣地區
33 個平地記錄完整的氣象站
資料,進行日射量估計模式分析。Yao et al.
(2002)依據不同氣候及海拔條件,選取臺北、
臺中、高雄、花蓮、日月潭及阿里山等
6 個
中 央 氣 象 局 所 屬 氣 象 站 的 氣 象 資 料 , 探 討
Richardson (1985)所提出之氣溫型估算模式
用於估計日射量的可行性。
臺灣嘉義地區(含嘉義縣、市)位於臺灣中
部略偏南的位置,因境內有北回歸線穿越,
所以兼具亞熱帶及熱帶氣候兩種氣候類型,
本地區的東側為阿里山山脈,由平地至山頂
的海拔落差達
2,000 m 以上,更造成了多樣
性的天氣變化,也增加日射量估計的不穩定
及複雜程度。本研究擬以位於山坡地之農業
試驗所嘉義農業試驗分所氣象站,與位於平
地之中央氣象局嘉義氣象站的氣象資料為對
象,分別計算日照型、氣溫型及雲量型等
3
種類型共
5 個估算模式的模式參數及日射
量,並以實測資料進行驗證,以瞭解各估計
模式的估計效果。
材料與方法
一、氣象資料
採用行政院農業委員會農業試驗所嘉義
農 業 試 驗 分 所
(Chiayi Agricultural
Experiment Branch) (以下簡稱 CAEB)內所
設 置 農 業 氣 象 站
(經 度 120°27’15”E, 緯 度
23°29’10”N,海拔 50 m)與交通部中央氣象局
嘉 義 氣 象 站
(Chiayi Weather Station,
CWB)(以下簡稱 CWS) (經度 120°25’28”E,
緯度
23°29’52”N,海拔 26.9 m)所記錄的氣象
資料,CAEB 的資料記錄時間由 2002 年 4 月
至
2013 年 5 月,記錄方式為逐時記錄,再換
算為逐日平均最高氣溫、最低氣溫、日射量、
日照時數、相對濕度及降雨量等
6 項。CWS
的資料記錄時間由
1983 年 1 月至 2012 年 12
月,採逐日記錄方式,包括日最高氣溫、最
低氣溫、日射量、日照時數、相對濕度、降
雨量及雲量等
7 項。
本 研 究 將 氣 象 資 料 依 年 度 別 分 為 兩 部
分,第一部分的資料用來估計各模式參數,
CAEB 及 CWS 均自 2003 年 1 月迄 2010 年
12 月止。第二部分的資料用來驗證日射量估
計值與實測值間的準確程度及配適性,
CAEB
自
2011 年 1 月起迄 2013 年 5 月止,CWS 則
自
2011 年 1 月迄 2012 年 12 月止。
二、理論日長與外氣層水平輻射量計算
理論日長
N 係採用 Duffie and Beckman
(2013)所提出之估算式
tan
tan
cos 15 2 1 N(1)
在
(1)式中,為當地緯度,δ係太陽赤緯,本
研究採用
Iqbal (1983)提出精確度較高的估
計 式 , 其 估 計 誤 差 值 小 於
0.035∘ (Duffie
and Beckman 2013)
B B B B B B 3 sin 00148 . 0 3 cos 002697 . 0 2 sin 000907 . 0 2 cos 006758 . 0 sin 070257 . 0 cos 399912 . 0 006918 . 0 180 (2)
(2)式中,B 為日角
365 360 1 n B(3)
(3)式中 n 為日數,自 1 月 1 日開始起算。例
如
1 月 1 日,n = 1;1 月 2 日,n = 2…依此
類推。
三、外氣層水平幅射量計算
外氣層水平幅射量
G
0(MJ m
-2)係採用
Duffie and Beckman (2013)之估算式:
sinsin 180 sin cos cos 365 360 cos 033 . 0 1 3600 24 0 SC S S n G G
(4)
(4)式中,G
SC為太陽常數,約為
1367 W m
-2。
ω
S為日落時角(sunset hour angle),
cos
1
tan
tan
S
(5)
四、日射量估計模式
本研究分別選取日照型、氣溫型及雲量
型等共計
5 個日射量估計模式進行比較,分
別說明如下:
1. Angström-Prescott model (以下簡稱 AP
model)
AP model 屬於日照型簡單線性回歸估
計模式,由
Angström (1924)首先提出原型模
式,但因原型模式在定義及實際應用上有其
困難,Prescott (1940)以 Angström 原型模式
加以修改,故稱
Angström-Prescott model
0 0 S S b a G G(6)
(6)式中,G 為逐月平均水平日射量,G
0為逐
月平均外氣層水平日射量,
S 為逐月平均日
照時數,
S
0為逐月平均最大可能日照時數。
a
與
b 分別為截距與斜率,通常因當地緯度、
季節等地區條件不同而有所變化,又稱為地
區性參數(Prescott 1940)。
2. El-Metwally model (以下簡稱 EM model)
EM model (El-Metwally 2005)屬於日照
型非線性回歸估計模式,
0 1 0 S S a G G(7)
(7)式中,a 為待估計係數。
3. Hargreaves model (以下簡稱 Ha model)
Ha model (Hargreaves 1982)屬於氣溫
型估計模式,
0.5 min max 0 T T a G G (8)
(8)式中,T
max為日平均最高氣溫,
T
min為日
平均最低氣溫,
a 為待估計係數。
4. Richardson model (以下簡稱 Ri model)
Ri model (Richardson 1985) 與 Ha
model 類似,差別在於(8)式中項次
TmaxTmin的乘冪,由常數
0.5 改為未知參數 b,
T T
b a G G min max 0 (9)
5. Badescu model (以下簡稱 Ba model)
Ba model (Badescu 1999)屬於雲量型估
計模式,
bC a G G 0(10)
(10)式中,C 為白晝觀察平均總雲量,a 與 b
則為回歸係數截距與斜率。
五、統計分析
本研究以誤差均方根(root mean square
error; RMSE)、平均偏差(mean bias error;
MBE)、平均絕對偏差(mean absolute bias
error; MABE) 、 相 關 係 數 (correlation
coefficient; r) 、 決 定 係 數 (coefficient of
determination; R
2)及
t 統計量(t-statistic)等 6
個指標,評估日射量估計模式的準確度與配
適性(goodness of fit)。各指標的計算公式如
下:
0.5 1 2 , , 1
n i o i m i G G n RMSE(11)
n i o i m i G G n MBE 1 , , 1(12)
n i o i m i G G n MABE 1 , , 1(13)
0.5 1 1 2 , 2 , 1 , ,
n i n i o o i m m i n i o o i m m i G G G G G G G G r(14)
n i io o n i m i o i G G G G R 1 2 , 1 2 , , 2 1(15)
5 . 0 2 2 2 1 MBE RMSE MBE n t(16)
(11)~(16)式中,日射量 G 的足標 i 與 n
表示總數為
n 筆日射量資料中第 i 筆資料,
足標
o 與 m 分別表示量測值與模式估計值,
o G代表平均量測日射量值,
Gm代表平均估計
日射量值。以上估計運算及統計分析均使用
SAS/STAT 9.1 套裝統計軟體完成。
結果與討論
一、回歸估計模式配適性之比較
回歸估計模式之配適性高低,即自變數
對於總變異解釋能力的大小,主要以決定係
數
R
2來描述。
R
2的範圍介於
0 與 1 之間,R
2愈接近
1 表示模式的總變異大部分來自變數
的影響,亦即回歸模式為適合的。由回歸模
式所得之估計值是否為統計顯著則以
t 統計
量決定(Stone 1993, Robaa 2009),t 統計量愈
小代表模式的估計效能愈好,若
t 統計量小
於臨界值則認為該模式為統計顯著,亦即估
計 值 與 實 測 值 之 間 的 差 異 不 具 統 計 上 的 意
義。臨界值係在指定之雙尾機率水準下,查
t-Test 統計表上對應自由度的數值所得。比較
2003-2010 年嘉義分所與嘉義氣象站日照時
數比
S/S
0與
G/G
0之散佈圖(Fig. 1),高低氣
溫差
T
max-
T
min與
G/G
0之散佈圖(Fig. 2) 以
及雲量(cloud cover; C)與 G/G
0之散佈圖
(Fig. 3),分別表示日照型、氣溫型及雲量型
模式在
CAEB 與 CWS 的配適性差異。Table 1
所列為
5 個回歸模式分別在 CAEB 與 CWS
S/S0 0.0 0.1 0.2 0.3 0.4 0.5 0.6 0.7 0.8 0.9 1.0 G/ G0 0.0 0.1 0.2 0.3 0.4 0.5 0.6 0.7 0.8 0.9 1.0 G/ G0 -0.1 0.0 0.1 0.2 0.3 0.4 0.5 0.6 0.7 0.8 0.9 1.0 (A) (B)Fig. 1. The scatter-diagram of the sunshine ratio
(S/S0) and the ratio of average daily global
radiation to the corresponding value of extraterrestrial radiation on a horizontal
surface (G/G0) in areas of (A) Chiayi
Agricultural Experiment Branch of Taiwan Agricultural Research Institute (CAEB) and (B) Chiayi Weather Station of Central Weather Bureau (CWS) during 2003-2010.
計算所得之回歸係數,
R
2與
t 統計量則列
於
Table 2。由於 CAEB 無雲量值資料,因
此
Ba model 僅針對 CWS 的資料進行估計
與統計分析。
Table 1 中 CAEB 之 AP model
的截距項為負值,觀察
Fig. 1 發現係由左下
方的尾部拖曳現象所造成,可能是日射計的
靈敏度較低所導致。Table 2 顯示各估計模
式的配適性在
CAEB 及 CWS 有一致的表現,
其中
CAEB 之 4 個估計模式之 t 統計量均
小於臨界值
t0.005,df95 3.3959,顯示所有模式
皆為統計顯著,決定係數
R
2則以
AP model
之
0.76 為最高。CAEB 所 5 個估計模式之 t 統
計 量 均 小 於 臨 界 值
t0.005,df963.39477,
G/ G0 0.0 0.1 0.2 0.3 0.4 0.5 0.6 0.7 0.8 0.9 1.0 Tmax -Tmin 0 2 4 6 8 10 12 14 16 G/ G0 0.0 0.1 0.2 0.3 0.4 0.5 0.6 0.7 0.8 0.9 1.0 (A) (B)Fig. 2. The scatter-diagram of temperature difference
(Tmax-Tmin, ℃) and the ratio of average daily
global radiation to the corresponding value of extraterrestrial radiation on a horizontal
surface (G/G0) in areas of (A) Chiayi
Agricultural Experiment Branch of Taiwan Agricultural Research Institute (CAEB) and (B) Chiayi Weather Station of Central Weather Bureau (CWS) during 2003-2010.
Table 1. Regression coefficients of solar radiation models calculated from weather data recorded at Chiayi Agricultural Experiment Branch of Taiwan Agricultural Research Institute (CAEB) and Chiayi Weather Station of Central Weather Bureau (CWS), respectively, during 2003-2010.
Model CAEB CWS a b P-value a b P-value AP model -0.17755 0.78156 < .0001 0.25408 0.48388 < .0001 EM model 0.46912 - < .0001 0.71693 - < .0001 Ha model 0.09094 - < .0001 0.16722 - < .0001 Ri model 0.04557 0.77238 0.0193 0.19036 0.43835 < .0001 Ba model - - - 0.73902 -0.42750 < .0001
Table 2. Coefficients of determination (R2) and t-statistic of solar radiation models calculated from weather data recorded at Chiayi Agricultural Experiment Branch of Taiwan Agricultural Research Institute (CAEB) and Chiayi Weather Station of Central Weather Bureau (CWS), respectively, during 2003-2010. Model CAEB CWS R2 t R2 t AP model 0.76 0.6007** 0.90 0.1857** EM model 0.69 0.6105** 0.85 1.7050** Ha model 0.07 0.2185** 0.73 0.3793** Ri model 0.04 1.8600** 0.73 0.6377** Ba model - - 0.85 0.2411**
*, **: significant at 5% and 1% level, respectively.
亦均為統計顯著。決定係數
R
2同樣是以
AP
model 之 0.90 最高。氣溫型模式 Ha model
與
Ri model 的 R
2在
2 處氣象站同為最低,
特別在
CAEB 之 R
2分別僅有
0.07 與 0.04,
代表氣溫型模式對於
CAEB 日射量資料變異
的解釋能力很低,Fig. 2 也同樣顯示該情形。
若比較相同模式在
2 處氣象站 R
2的大小,則
除
Ba model 因 CAEB 無雲量資料無法比較
外,其餘
4 個模式均以 CWS 為優,Fig. 1 至
Fig. 3 也明顯的呈現此一結果。
二、驗證回歸估計模式之準確度
Fig. 4 至 Fig. 6 為 2011-2013 年 CAEB 與
2011-2012 年 CWS 實測日射量 G 與估計日射
量
G
m之比較,CAEB 與 CWS 估計值的走勢
與實測值大體上一致,表示模式均能大致掌
握實測值高低起伏的變化,但是
CWS 估計值
與實測值接近的程度則優於
CAEB,例如 Fig. 4
中
CAEB 之 AP model 估計值出現負值,而
Ha model 與 Ri model 更是完全高估。
C 0.0 0.1 0.2 0.3 0.4 0.5 0.6 0.7 0.8 0.9 1.0 G/G 0 0.0 0.1 0.2 0.3 0.4 0.5 0.6 0.7Fig. 3. The scatter-diagram of cloud cover (C) and the ratio of average daily global radiation to the corresponding value of extraterrestrial
radiation on a horizontal surface (G/G0) in
area of Chiayi Weather Station of Central Weather Bureau (CWS) during 2003-2010.
Fig. 4. Comparison of the observed (G) and the predicted (Gm) values of the monthly average of daily global
solar radiation by (A) AP model, (B) EM model, (C) Ha model and (D) Ri model in area of Chiayi Agricultural Experiment Branch of Taiwan Agricultural Research Institute (CAEB) during 2011-2013.
Fig. 5. Comparison of the observed (G) and the predicted (Gm) values of the monthly average of daily global
solar radiation by (A) AP model, (B) EM model, (C) Ha model and (D) Ri model in area of Chiayi Weather Station of Central Weather Bureau (CWS) during 2011-2012.
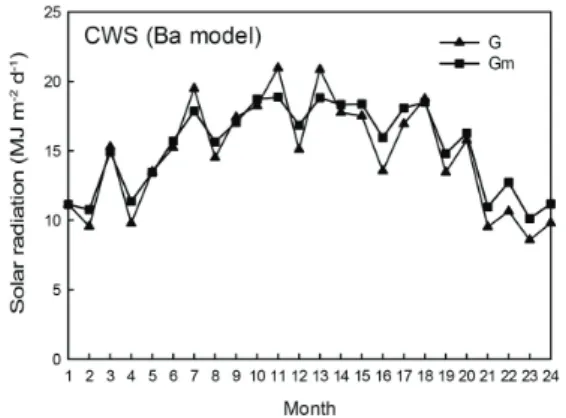
代表回歸估計模式準確度指標的驗證統
計結果如
Table 3 所示,RMSE、MBE 及
MABE 愈接近 0 表示估計準確度愈高,相關
係數
r 值則應儘可能接近 1。4 個估計模式在
CAEB 之相關係數 r 皆為統計顯著,並以 EM
model 之 0.9677 最高,Ha model 之 0.7915
最低。
RMSE 分布的範圍在 1.5942 至 3.9942
MJ m
-2d
-1之間,以
EM model 之 1.5942 MJ
m
-2d
-1最低,而
AP model 之 MBE 為-0.6370
MJ m
-2d
-1,表示該模式有低估的趨勢。
MABE
為 量 測 值 與 估 計 值 偏 差 之 絕 對 值 , 因 此 較
MBE 更可客觀呈現估計偏差的大小,各估計
模式之
MABE 以 EM model 為 1.3893 MJ m
-2d
-1最小,Ha model 之 3.8884 MJ m
-2d
-1最
大。歸納
CAEB 之 4 個估計模式之 RMSE、
MBE 及 MABE 表現,一致以 EM model 最
低,
Ha model 最高,顯示 EM model 在 CAEB
估計的準確度最佳。CWS 各模式準確度指標
的表現,均以
AP model 最佳,其中 5 個估
計模式的相關係數均為統計顯著,並以
AP
model 之 0.9722 最高。RMSE 以 AP model
之
0.9393 MJ m
-2d
-1最低,5 個模式之 RMSE
分布範圍在
0.9393 至 2.0931 MJ m
-2d
-1之
間,較
CAEB 的範圍為窄。AP model 之 MBE
值為
0.2935 MJ m
-2d
-1最低,EM model 的
MBE 值為-0.4762 MJ m
-2d
-1,顯示
EM model
在
CWS 有低估的趨勢。MABE 值以 AP
model 之 0.8358 MJ m
-2d
-1最低,Ri model
之
1.7738 MJ m
-2d
-1最高。
日 射 量 估 計 模 式 之 配 適 性 與 估 計 準 確
度,在本研究中以日照型最佳,其次為雲量
型,氣溫型則最差,此與其他學者研究的結
論頗為一致(Yao et al. 2002, Chen et al. 2004,
Wu et al. 2007, Besharat et al. 2012)。日照時
數為影響日射量的直接因子,受到環境條件
的干擾最少,雲量亦可直接影響日射量,Fig.
3 顯示雲量與日射量比值呈負相關,符合實際
狀況。在本研究中雲量型模式的配適性及準
確度,與日照型模式相差無幾,所以若能利
用人造衛星空照圖以取代目測,雲量型模式
亦有不錯的估計效果。日照型與雲量型的估
計效果雖然令人滿意,但是某些偏遠或資源
缺 乏 的 地 區 難 以 獲 得 相 關 氣 象 資 料 進 行 估
Fig. 6. Comparison of the observed (G) and the
predicted (Gm) values of the monthly average
of daily global solar radiation by Ba model in area of Chiayi Weather Station of Central Weather Bureau (CWS) during 2011-2012. Table 3. Statistical results for the validation of solar radiation models calculated from weather data
recorded at Chiayi Agricultural Experiment Branch of Taiwan Agricultural Research Institute (CAEB), during 2011-2013, and Chiayi Weather Station of Central Weather Bureau (CWS), during 2011-2012.
Model CAEB CWS
RMSE MBE MABE r RMSE MBE MABE r
AP model 2.2002 -0.6370 1.6642 0.9413** 0.9393 0.2935 0.8358 0.9722** EM model 1.5942 0.0359 1.3893 0.9677** 1.6249 -0.4762 1.2858 0.9455** Ha model 3.9942 3.8884 3.8884 0.7915** 2.0759 1.1896 1.7487 0.9086** Ri model 3.0343 2.9276 2.9276 0.8139** 2.0931 1.1921 1.7738 0.9054**
Ba model - - - - 1.3102 0.5455 1.1130 0.9609**
計。相對於日照與雲量資料,氣溫資料則較
易於取得,氣溫型模式係根據正午前後太陽
輻射加熱於空氣使氣溫上升之顯熱
(sensible
heat)最大,即最高氣溫,以及日出前之最低
氣溫,利用高低氣溫的差幅與日射量大小所
建立的回歸模式來推估。但是,常因下雨後
水分吸收太陽輻射發生「液-氣」相態轉變,
並使顯熱減少,進而導致日射量大小無法藉
由高低氣溫變化所充分反映,所以估計效果
較差。Liu et al. (2009)認為高低溫差大小是影
響氣溫型模式準確度的關鍵,溫差愈大,有
助 於 提 高 模 式 估 計 的 準 確 度 。 但 是 , 若 以
t-Test 比較 2003-2010 年 CAEB 與 CWS 之逐
月平均溫差的差異,發現未達統計顯著差異
水準(P = 0.5336),因此溫差大小亦無法充分
說明氣溫型模式在
2 處氣象站表現差異的原
因。
誌謝
本研究承行政院農業委員 會
102 農科
-7.1.1-農-C1 計畫補助經費,以及黃哲倫先生
協助繪製圖表,特此誌謝。
引用文獻
Ahmad MJ, GN Tiwari (2010) Solar radiation models-review. Intl. J. Energy Environ. 1:513532.
Angström A (1924) Solar and terrestrial radiation.
Q. J. R. Meteorol. Soc. 50:121125.
Baldasano JM, J Clar, A Berna (1988) Fourier analysis of daily solar radiation data in Spain.
Solar Energy 41:327333.
Badescu V (1999) Correlations to estimate monthly mean daily solar global irradiation: application to Romania. Energy 24:883893. Besharat F, AA Dehghan, AR Faghih (2012)
Empirical models for estimating global radiation in Yazd city, Iran. p.18. In: Proceedings of the International Conference on Solar energy for MENA region (INCOSOL). Oct 2223, 2012. Amman, Jordan.
Besharat F, AA Dehghan, AR Faghih (2013) Empirical models for estimating global solar radiation: A review and case study. Renew.
Sust. Energ. Rev. 21:798821.
Chang YF (1992) Study on the estimation of solar radiation at Taitung. (in Chinese with English abstract) Meteorolog. Bull. 38:7379.
Chen CL, CF Lin, TS Liu (1994) Estimate and Analysis of solar radiations in Taiwan. (in Chinese with English abstract) J. Agric. Res.
China. 43:7792.
Chen R, K Ersi, J Yang, S Lu, W Zhao (2004) Validation of five global radiation models with measured daily data in China. Energy Convers.
Manage. 45:17591769.
Duffie JA, WA Beckman (2013) Solar engineering of thermal process. 4th ed. John Wiley & Sons, Inc., Hoboken, New Jersey. 936pp.
EL-Metwally M (2005) Sunshine and global solar radiation estimation at different sites in Egypt.
J. Atmos. Sol.-Terr. Phys. 67:13311342.
Gordon JM, TA Reddy (1988) Time series analysis of daily horizontal solar radiation. Solar
Energy 41:215226.
Hargreaves GH, ZA Samani (1982) Estimating potential evapotranspiration. J. Irrig. Drain.
Eng. 108:223230.
Hounam CE (1963) Estimates of solar radiation over Australia. Aust. Meteorol. Mag. 43:114. Lin HT, RC Su (1986) A study on the distribution
of monthly solar radiation in Taiwan. (in Chinese with English abstract) Meteorol. Bull. 32:1119.
Liu DL, BJ Scott (2001) Estimation of solar radiation in Australia from rainfall and temperature observations. Agric. For. Meteorol. 106:4159.
Liu X, X Mei, Y Li, Q Wang, JR Jensen, Y Zhang, JR Porter (2009) Evaluation of temperature-based global solar radiation models in China. Agric. For. Meteorol. 149:14331446.
Mahmood R, KG Hubbard (2002) Effect of time of temperature observation and estimation of daily solar radiation for the Northern Great Plains, USA. Agron. J. 94:723733.
Mavromatis T, SS Jagtap (2005) Estimating solar radiation for crop modeling using temperature data from urban and rural stations. Clim. Res. 29:233243.
Prescott JA (1940) Evaporation from a water surface in relation to solar radiation. Trans. R.
Richardson CW (1985) Weather simulation for crop management models. Trans. ASAE 28:16021606.
Rivington M, G Bellocchi, KB Matthews, K Buchan (2005) Evaluation of three model estimations of solar radiation at 24 UK stations.
Agric. For. Meteorol. 132:228243.
Robaa SM (2009) Validation of the existing models for estimating global solar radiation over Egypt.
Energy Convers. Manage. 50:184193.
Stone RJ (1993) Improved statistical procedure for the evaluation of solar radiation models. Solar
Energy 51:289291.
Tang RJ (1979) The analysis of solar radiation in Tainan area. (in Chinese with English abstract)
Meteorol. Bull. 25:1520.
Wu G, Y Liu, T Wang (2007) Methods and strategy for modeling daily global solar radiation with measured meteorological data-A case study in Nanchang station, China.
Energy Convers. Manage. 48:24472452.
Yang K, T Koike (2002) Estimating surface solar radiation from upper-air humidity. Solar
Energy. 72:177186.
Yao MH, S Chen, KS Chi, JC Tsai (2002) Estimating solar radiation from daily temperature data. (in Chinese with English abstract) J. Agric. Res. China. 51:7383.
Yen CS (1974) The estimation of the total shortwave radiation in Taiwan. (in Chinese with English abstract) Atmos. Sci. 1:7280.