國 立 交 通 大 學
生物科技學系
生物科技研究所
碩 士 論 文
蛋白質亞硫酸基轉移酶及 3'磷酸腺甘酸 5'磷酸硫酸合成酶之螢光
檢測法
Fluorometric Assay for Protein Sulfotransferase & PAPS Synthetase
研 究 生:廖昱樹
指導教授:楊裕雄 博士
蛋白質亞硫酸基轉移酶及3′磷酸腺甘酸5'磷酸硫酸合成酶 之螢光檢測法
Fluorometric Assay for Protein Sulfotransferase &
PAPS synthetase
研 究 生:廖昱樹 Student: I-Shu Liao
指導教授:楊裕雄 博士 Advisor: Dr. Yuh-Shyong Yang
國立交通大學
生物科技學系
碩 士 論 文
A Thesis
Submitted to Department of Biological Science and Technology National Chiao Tung University
in Partial Fulfillment of the Requirements for the Degree of
Master of Science in
Biological Science and Technology July 2006
Hsinchu, Taiwan, Republic of China
Abstract
Sulfation is a major pathway in the biotransformation of many drugs and other xenobiotic compounds. The sulfotransferase (ST) enzymes that catalyze these reactions use 3*-phosphoadenosine 5*-phosphosulfate (PAPS) as a sulfate donor co-substrate. The synthesis of PAPS from inorganic sulfate and ATP is catalyzed by PAPS synthetase (PAPSS). Protein sulfation has been known for 50 years. Tyrosine O-sulfation is a common post-translational modification for all multicellular organisms. It was recently discovered that there are similar phenomena in serine and threonine. However, the enzyme which catalyzes this transformation and its mechanism are still unknown. In the first part of this thesis, a continuously flouremetric assay for PAPS synthetase was developed for the first time. It was performed by coupling with the physiological reaction of phenol sulfotransferase (PST). In the second part of the thesis, we developed a very effective assay for the sulfotransferase that catalyzes the sulfation of serine and threonine. It utilized PAPS regenerated from 3-phosphoadenosine 5-phosphate (PAP) by a recombinant PST using 4-methylumbelliferyl sulfate (MUS) as the sulfuryl group donor. The change in the fluorescence intensity of 4-methylumbelliferone (MU) corresponded directly to the amount of active protein sulfotransferase.
摘要
在許多藥物以及異體化合物的生物轉化中,亞硫酸化是一個相當重要的反應 路徑,亞硫酸轉移酵素(sulfotransferase, ST)利用3'硫酸腺甘酸 5'磷酸硫酸 (3’-phosphoadenosine 5’-phosphosulfate, PAPS)當作亞硫酸基的來源,進行以上所 述反應的催化,而PAPS則是由無機硫以及三磷酸腺甘(ATP)經由3'硫酸腺甘酸 5'磷酸硫酸合成酶(3’-phosphoadenosine 5’-phosphosulfate synthetase, PAPSS)催 化而成。蛋白質亞硫酸化的現象已經被證實了五十多年,酪胺酸亞硫酸化為一種 普遍存在於所有的多細胞生物中的後修飾作用。最近幾年,這種蛋白質亞硫酸化 的現象也被發現會發生在絲胺酸和蘇胺酸上,然而,催化這個反應的酵素尚未被 發現。本論文主要分為兩部份,第一部份主要探討的是 PAPSS螢光檢測法,此 活性檢測法的操作結合了酚亞硫酸轉移酵素(phenol sulfotransferase, PST)的生理 活性,為一靈敏度極高的活性檢測法。第二部份則是探討蛋白質亞硫酸轉移酵素 的 活 性 檢 測 方 法 , 檢 測 系 統 的 主 旨 是 利 用 重 組 的 PST 催 化 受 質 4-methylumbelliferyl sulfate(MUS) 做 為 亞 硫 酸 基 提 供 者 並 轉 移 至 3’-phosphoadenosine 5’-phosphate (PAP)再生PAPS ,此核苷酸的亞硫酸基再由蛋 白質亞硫酸轉移酵素催化,反應後所產生的4-methylumbelliferone (MU)之螢光變 化可用來定量蛋白質亞硫酸轉移酵素的活性。
Acknowledgement 在進入研究所唸書前,總喜歡好奇地翻翻別人論文裡的誌謝,當真正輪到自 己寫時,卻因為發現要感謝的人實在是太多了,而遲遲無法下筆。我想首先最要 感謝應該是我的父母以及家人,無論如何總是在背後支持,讓我沒有後顧之憂地 專注在研究所課業之上,接著要感謝我的指導教授楊裕雄老師,楊老師總是在最 適當的時機給予意見以及鼓勵,讓初次踏進生科領域的我不會感到惶恐以及不 安,另外要感謝口試委員劉明毅老師,林照雄老師以及黃憲達老師對我的論文所 提出的建議,使整篇論文更加地精確以及完整。 在實驗上,則要感謝陳大晃學長以及陳偉迪學長,讓我從對實驗的一知半解 逐漸進入狀況,此外,謝謝實驗室的夥伴莊博、RICH 學長、小米學姐、僕僕學 長、Linda 學姐、淵仁學長、程允學長、萊姐、陸宜、小志、Peggy、淑婷、嘉 蔚、江大哥、小丸和韋汝,你們為平常乏味的實驗室生活注入了活力,也讓 LEPE 這個團隊更有競爭力,如果要我再選擇一次,LEPE 還是我不變的選擇。 謝謝我的好朋友們,身為室友的又仁,偉宗和志明,在臺中作育英才的宛郁, 在業務界打滾的 KR,你們總是能在我最沮喪無助時給我支持,最後,感謝陪在 我身邊的葉蓁,有你們的陪伴,最後寫論文的這段日子,再苦也值得。
Contents
...Page
Abstract (Chinese) ... i Abstract (English) ... ii Acknowledgement ... iii Contents ... iv Contents of Figures ... viAbbreviation and Symbol... vii
Introduction
...1Experimental Procedures
...7Material...7
Preparation of hPAPSS ...7
Preparation of biological samples for enzyme assay...8
Preparation of PAP-free phenol sulfotransferase ...9
PST enzyme assay ...9
Coupled-enzyme assay for hPAPSS...10
Preparation of APS and PAPS ...10
Determination of protein concentration ...11
Coupled-enzyme assay for protein sulfotransferase ...11
Sample preparation of mass spectrum...12
MALDI-TOF MS Analysis ...13
Purification of human PAPS synthetase ...14
K65ER68G as catalyst for the depletion of PAPS ...14
Selection of excitation and emission wavelength s for the coupled-enzyme assay ...15
Coupled-enzyme assay for human PAPS synthetase ...16
Coupled-enzyme assay for serine and threonine protein sulfotransferase...17
Result of mass spectrum...18
Conclusion
...20Reference
...38Appendix
...46Contents of Figure
...Page
Table 1 The Relative Emission Coefficient of MU at 450 nm ...21
Table 2 Inhibition of ATP in Physiological reaction...22
Table 3 Inhibition of ATP in reverse Physiological reaction ...23
Figure 1 Scheme for the determination of PAPSS activity ...24
Figure 2 SDS-PAGE for determination of human PAPS synthetase ...25
Figure 3 Progress curves of the coupled-enzyme assay for hPAPSS ...26
Figure 4 Standard curve of hPAPSS at 37oC ...27
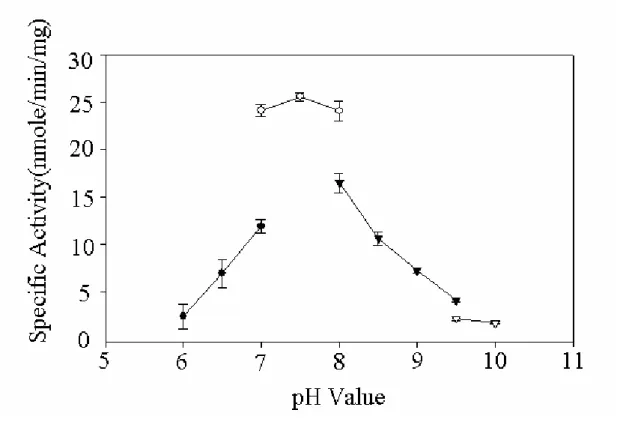
Figure 5 pH profile of recombinant hPAPSS ...28
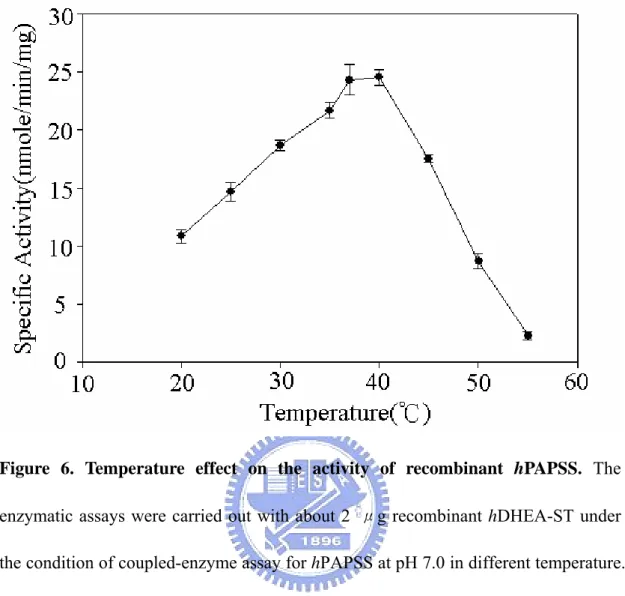
Figure 6 Temperature effect on the activity of recombinant hPAPSS ...29
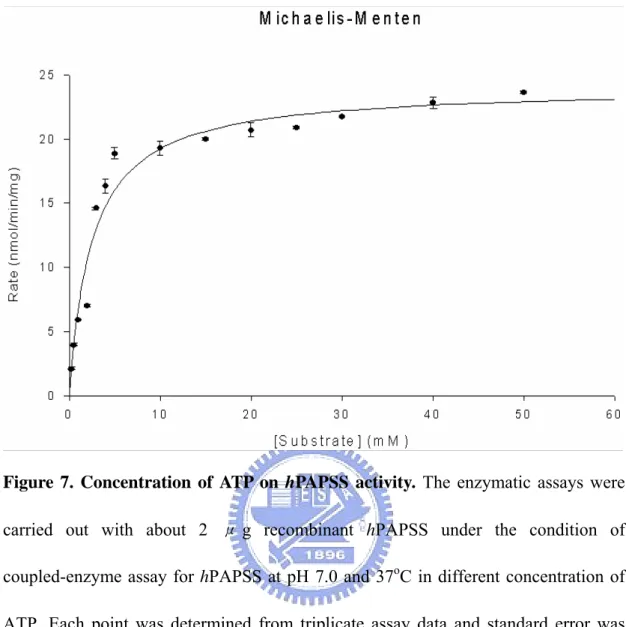
Figure 7 Concentration of ATP on hPAPSS activity ...30
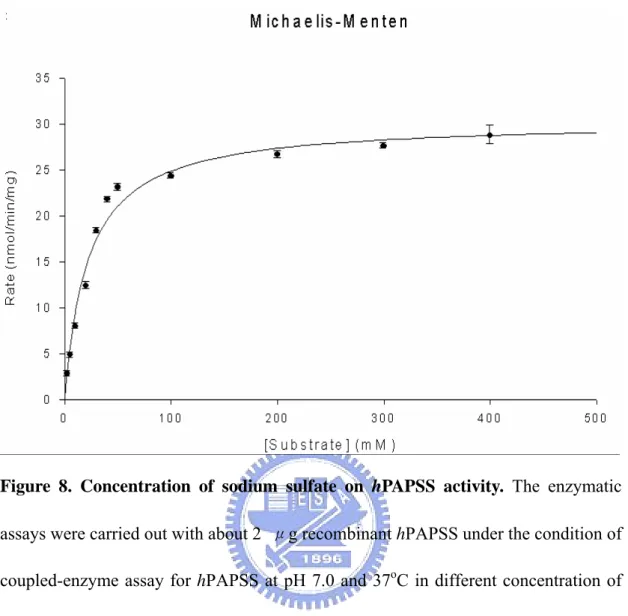
Figure 8 Concentration of sodium sulfate on hPAPSS activity ...31
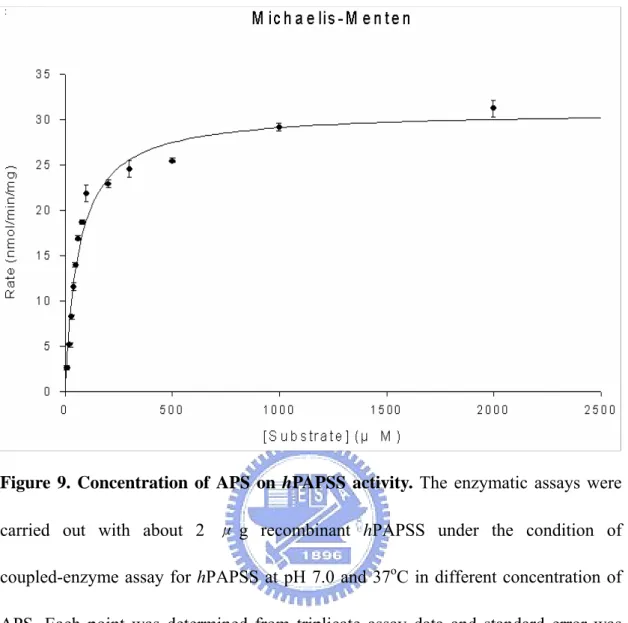
Figure 9 Concentration of APS on hPAPSS activity...32
Figure 10 Scheme for the determination of protein sulfotransferase ...33
Figure 11 Progress curves of the coupled-enzyme assay for protein sulfotransferase ...34
Figure 12 Effective range of fluorometric assay for protein sulfotransferase ....35
Figure 13 Concentration of peptide on protein sulfotransferase activity ...36
Abbreviation and Symbol
Abbreviation and Symbol Full name
PST Phenol sulfotransferase
AST Alcohol sulfotransferase
hPAPSS Human PAPS synthetase
PAP Adenosine 3’,5’-bisphosphate
3’-phosphoadenosine 5’-phosphate
PAPS Adenosine 3’-phosphate 5’-phosphosulfate 3’-phosphoadenosine 5’-phosphosulfate
ATP Adenosine 5’-triphosphate
MU 4-methylumbelliferone
MUS 4-methylumbelliferyl sulfate
Tris tris[hydroxymethyl]aminomethane EDTA (Ethylenedinitrilo)tetraacetic acid
DTT Dithiothreitol PMSF Phenylmethylsulfonyl fluoride MES 2-[N-morpholino]ethanesulfonic acid
SDS Sodium dodecyl sulfate
TEMED N, N, N’, N’-tetramethylethylene diamine
ε Extinction coefficient
U Unit:μmole/min
RFU Relative fluorescence unit Km Michaelis constant
Introduction
Sulfation biological system has been recognized for over a century. In 1876, Baumann first described sulfate conjugation as a pathway in biotransformation (Williams, 1959). These reactions are catalyzed by a large family of enzymes, sulfotransferase (STs). Through many years of the development, scientists have determined definitely the mechanism of STs, their substrate specificities, regulation, and evolutionary relationships. In 1954, Bettelheim first discovered the sulfation in a peptide (fibrinopeptide B) derived from fibrinogen (Bettelheim et al., 1954). Since then, protein sulfation in tyrosine residue has emerged as a widespread post-translational modification in multicellular eukaryotes (Huttner, 1982). In the mid-1980s, a series of tyrosine-sulfated proteins was discovered, which includes diverse molecules such as α-choriogonadotrophin and heparin cofactor Ⅱ (Kehoe and Bertozzi, 2000; Huttner, 1998; Niehrs et al., 1994). In the past few years, tyrosine sulfation has been identified as a key modulator of protein-protein interactions that mediate inflammatory leukocyte adhesion (Wilson and Rider, 1992).
The sulfation reaction of protein is catalyzed by tyrosylprotein sulfotransferase, a membrane-bound enzyme of the trans-Golgi-network (Kehoe and Bertozzi, 2000; Niehrs et al., 1994). Two membrane-bound forms of tyrosylprotein sulfotransferase
were as revealed by phase partitioning in Triton X-114 in Golgi-enriched fractions from bovine adrenal medulla (Xia et al., 2000). In 1998, there was a major advance in the field, The gene of the two tyrosylprotein sulfotransferases, TPST-1 and TPST-2, from human tissue and mouse liver, were cloned(Ouyang et al., 1998; Ouyang et al., 1998; Beisswanger et at., 1998). The human TPSTs share 67% sequence identity. TPST-A, a related protein which was found in Caenorhabditis elegans, is 54% identical to human TPST-1 (Ouyang et al., 1998). There was a second gene found in C.
elegans, it has 39% identity and 62% similarity to TPST-A, but its function is also
unknown. Northern analysis indicates that both human TPSTs are expressed in many tissues. However, whether human TPST-1 and TPST-2 are co-expressed in the same cells has not been determined.There might be more than one TPST exist which have not yet been discovered. The additional TPST might explain the diversity of sequences that are tyrosine sulfated;each of them may act on different amino acid residues of target protein and have a different substrate.
It has been recently discovered that there are similar phenomena occurring in serine and threonine. In 2004, Medzihradszky described this situation for the first time (Medzihradszky et al., 2004). The post-translational modification of serine and threonine sulfations are discovered in four proteins from very different species. This situation suggests that this modification is widespread and may occur ubiquitously in all eukaryotes. The four proteins include a neuronal intermediate filament and a myosin light chain from the invertebrate mollusk Lymnaea stagnalis, a cathepsin-C-like enzyme of the unicellular malaria parasite Plasmodium falciparum,
and the cytoplasmic domain of the human orphan receptor tyrosine kinase Ror-2. Moreover, the four modified proteins reported by the scientists are targeted to distinct cell compartments, Lymnaea intermediate filament locates in cytoplasm, the human orphan receptor tyrosine kinase Ror-2 locates in plasma membrane. The location of
Plasmodium cathepsin-like enzyme is still unknown. This suggests that sulfation of
serine and threonine may be involved in multiple functions including protein assembly and signal transduction and occurs both in the endoplasmic reticulum continuum and the cytoplasm.
To date, there are lots of STs known, and they could be divided into two main groups. One of them is a membrane-bound class which of them is found in the Golgi membrane, this group of STs involved in the modification of protein amino acid residues(tyrosine), proteoglycans and polysaccharides, the other is a soluble cytoplasmic class that modifies small molecules, such as estrogen (Strott, 2002). Among all of the STs, PAPS is the universal sulfate group donor(Robbins and Lippmann, 1956; Moore, 2003; Kehoe and Bertozzi, 2000). Therefore, although we do not know which enzyme(s) might catalyze the sulfation of serine and threonine in proteins yet, one or more of the already known STs are the most likely candidates. However, we cannot figure out whether a different as yet unidentified enzyme is involved, we cannot conceivably figure out a different donor compound, either. Similar considerations apply to any sulfatases, assuming that these modifications are physiologically reversible.
Since this situation has been discovered only recently, the mechanism of this enzyme is not clear yet. In order for the convenience of further study, we decided to develop a continuous assay for protein sulfotransferase. Suitable assays for protein sulfotransferase are essential for investigation into its physiological functions. The most common assays for protein sulfotransferase activities to date are usually conducted by monitoring the transfer of radioisotopic sulfate from [35S]PAPS to specific products (Niers et al., 1990), which involve stopping the reactions by heat treatment after a fixed time interval, centrifugation to remove precipitates formed, and changing the solvent system prior to thin-layer or paper chromatography. These procedures are tedious for routine and detailed kinetic studies of protein sulfotransferase. Routine spectrophotometric assays have been available only for PST (Ramaswamy and Jakoby, 1987) and AST (Chen et al., 2005). Despite the considerable progress made in recent years on protein sulfotransferase, several fundamental issues concerning the role of regulation in signal transductions and physiological involvement still remain to be fully elucidated. The present study was prompted by an attempt to develop a convenient assay in order to address these important issues.
Here we proposed a fluorometric assay for protein sulfotransferase (Figure 10). In this assay, the regeneration of PAPS from PAP with MUS as the sulfuryl group donor was catalyzed by PAP-free PST in a reverse physiological reaction (Lin and
Yang, 1998). This reaction was coupled to protein sulfotransferase. Since we don’t have purified protein sulfotransferase, we use rat liver crude extract as the source of protein sulfotransferase, and the product, MU, served as fluorometric indicator to monitor protein sulfotransferase activity.
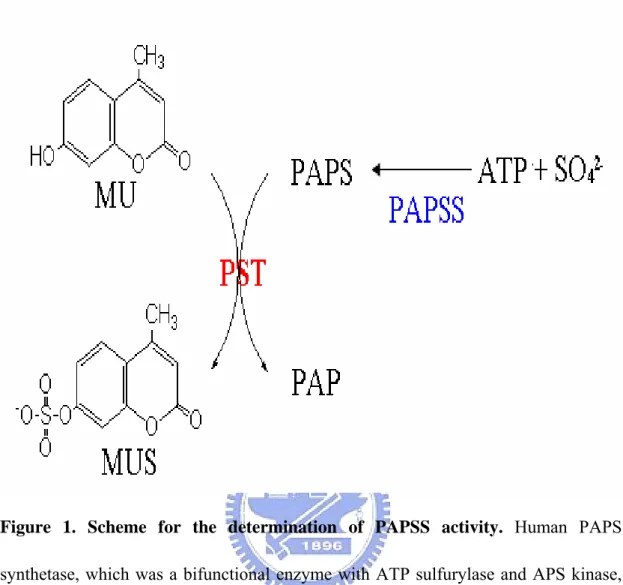
Sulfation, as described above, is mediated through the universal sulfuryl group donor, 3’-phosphoadenosine 5’-phosphosulfate (PAPS) (Grogory and Robbins, 1960). PAPS plays an important role in offering sulfuryl group for the sulfotransferases that catalyze these reactions (Klaassen and Boles, 1997; Weinshilboum et al., 1994). PAPS is synthesized from two moles of ATP and one mole of SO42-. In prokaryotes, this reaction is catalyzed by two separate enzymes, ATP sulfurylase and adenosine 5’-phosphosulfate kinase (Klaassen and Boles, 1997; Farooqui, 1980). ATP sulfurylase catalyzes the synthesis of adenosine phophosulfate (APS) from ATP and SO42-. APS kinase, as its name suggests, phosphorylates APS in the presence of another molecule of ATP to form PAPS. In higher organisms, such as human and mice, these reactions are catalyzed by a single by bifunctional enzyme, PAPS synthetase (PAPSS) (Figure 1). There are two different isoforms of PAPSS, PAPSS1 and PAPSS2. They have been identified in both human and mice previously (Girard et
al., 1998; Kurima et al., 1998; Li et al., 1995; ul Haque et al., 1998; Venkatachalam et al., 1998).
evidence demonstrated different PAPSS patterns of tissue expression, and no common simple nucleotide polymorphism(SNP) that change the biochemical activity or expression level of these enzymes have been described in human. Therefore, suitable assays for PAPSS are essential for investigation into their physiological functions. To date, the most common assays for PAPSS activities are usually conducted by monitoring [35S]PAPS from free carrier [35S]SO42- (Hazelton et al., 1985; Vargas, 1988; Wong and Khoo, 1990) which involve stopping the reactions by heat treatment after fixed time interval, removing precipitates formed by centrifugation, and changing the solvent system prior to thin-layer or paper chromatography. These procedures are tedious for routine and detailed kinetic studies of PAPS synthetase. Other reported PAPSS assays are also end-point analyses requiring the determination of PAPS using radiochemical coupled-enzyme assay ( Xu et al., 2001). In an attempt to begin the process of characterizing PAPSS activity, the objective of the present study was to develop a convenient assay in order to address these important issues.
We report the purification of human PAPSS (hPAPSS) for the biosynthesis of PAPS (figure 1). This reaction was coupled to PAP-free PST, and a continuous flourometric assay was developed. In this assay, the deletion of MU to MUS with PAPS as the sulfuryl group donor was catalyzed by PAP-free PST in physiological reaction (figure 1). The reactant, MU, served as a flourometric indicator to monitor hPAPSS activity.
Experimental Procedures
Materials.
PAPS, PAP, MUS, MU, tris[hydroxymethyl]aminomethane (Tris), 2-[N-morpholino]ethanesulfonic acid (MES), phenylmethylsulfonyl fluoride (PMSF), [ethylenedinitrilo] tetracetic acid (EDTA), glutathione (reduced form) and dithiothreitol (DTT) were purchased from Sigma (St. Louis, MO). Potassium phosphate (dibasic), glycine, and sodium dodecyl sulfate (SDS) were obtained from J. T. Baker (U.S.A.). The P-selectin glycoprotein ligand-1 PSGL-1 peptide (Niers et al, 1990) (QATEYEYLDYDFLPEC) and the Ror-2 peptide (QAKLKEISLSAVRFME) were synthesized and purified by Genesis Biotech Inc. (Taiwan). All other chemicals were obtained commercially at the highest purity possible.
Preparation of hPAPSS.
The experimental method was modified from Satishchandran and Markham (1998). The positive clones were sequenced in their entirety before transformation into BL21(DE3) cells by the CaCl2 method. A single colony was used to inoculate an LB/ampicillin liquid culture, which was then placed on a shaker at 37oC. Growth was continued to an A600 of 0.4~0.6 and then the culture was centrifuged, and the cells
were resuspended in LB/ampicillin and stored overnight at 4oC. This suspension culture was subsequently used to inoculate a second, larger LB/ampicilin liquid culture, which was grown with shaking at 37oC for approximately 4 hours; then cDNA expression was induced with 1 mM isopropyl-thio-β-D-galactoside (IPTG) during additional 12 hours incubation. The cultures were centrifuged at 8000 rpm for 20 minutes, and the pellet was sonicated in IMAC 5 buffer(5mM imidazole, 50mM Tris, pH 7.9) many times. Following removal of cellular debris by ultracentrifugation at 15,000 rpm for 30 minutes, the supernatant was diluted 1:2 in IMAC 5 sonication buffer. To purify the expressed protein, the chelating column from Pharmacia was used following the supplier’s protocol. Briefly, the resin was washed with double distilled H2O to remove ethanol from the storage solution, charged with 100mM NiSO4, and then equilibrated in sonication buffer. Then crude supernatant was loaded onto the 5 ml column in a 1:1 dilution with sonication buffer and incubated at 4oC for 20 minutes with intermittent mixing. Following incubation, the flow-through was collected, and the column was washed with 30mM imidazole to remove the majority of nonspecifically bound bacterial proteins, after which the expressed protein was eluted with 400 mM imidazole. The purified protein was dialyzed against Q column buffer (50 mM Tris, pH 8.0, 1 mM dithiotreitol, 1mM EDTA, 10% glycerol) overnight for purification with Hitrap Q. Then the Q column was eluted with 0.5 M NaCl gradient (total volumn 500 mL with flow rate at 1mL/min).
The liver extracts were prepared from 20 g of frozen rat liver, which was mixed with a 20 ml buffer (10 mM Tris-HCl at pH 7.4 plus 125 mM sucrose, 10% glycerol, 1 mM DTT, l.5 mM PMSF, and 1 mM EDTA, 0.1% Triton X-100) and was homogenized by grinding with liquid nitrogen. All further steps were performed at 4oC. Liver were minced, suspended in 30ml of buffer per g of liver and homogenized by homogenizer three times and the homogenate centrifuged (10min, 800 × g). The following steps were described previously (Ouyang et al., 1998).
Preparation of PAP-free phenol sulfotransferase.
The β-form of recombinant phenol sulfotransferase (Yang et al., 1996) was used as the PAP-free enzyme. Recombinant mutant PST, K65ER68G, was cloned into expression vector pET3c and transformed into Escherichia coli BL21 (DE3) (Chen et
al., 1992). The enzyme isolation procedure was the same as described earlier (Yang et al., 1996), which resulted in a homogeneous protein as determined by
SDS-polyacrylamide gel electrophoresis (Laemmli, 1970).
PST enzyme assay.
The activity of PAP-free PST, K65ER68G, was determined by the change of fluorescence due to the production of MU from MUS by a spectrofluorometer (Hitachi F-4500, Japan). The excitation and emission wavelengths were 360 nm and 450 nm, respectively. The reaction mixture included 5 mM 2-mercaptoethanol, 4 mM MUS, 20 μM PAP, 100 mM potassium phosphate buffer, and 0.5-2 μg K65ER68G at
pH 7.0, 25℃. This assay also referred to the reverse-physiological reaction catalyzed by K65ER68G. One unit was defined as 1 μmol of PAP converted to PAPS per minute with 4-methylumbelliferyl sulfate under the reaction condition described above.
Coupled-enzyme assay for hPAPSS.
Reaction mixture (1ml) containing 100 mM potassium phosphate buffer (pH 7.0), 5 mM 2-mercaptoethanol, 1 mM ATP, 4 mM Na2SO4, 1 mM MgCl2, 20 μM MU,3 mU (5 μg) K65ER68G, and 1-2 μg hPAPSS. ATP or Na2SO4 was added last so as to start the reaction at 25°C.
Preparation of APS and PAPS.
This method was modified from Satishchandran and Marjham (1989). In brief, the reaction mixture for the preparation of APS and PAPS contained 1 mM MgCl2, 1 mM ATP, 4 mM carrier free Na2SO4, 100 mM Tris-HCl (pH 7.0), 5.0 units of inorganic pyrophosphatase, and 2.0 units of purified ATP surfurylase/APS kinase (PAPSS) in a total volume of 50 μL. The reaction was stopped after thirty minutes by placing the reaction vessel in a boiling water bath for two minutes. The precipitate formed was removed by centrifugation. HPLC analysis showed that the SO42- was completely converted to PAPS. In order to facilitate purification of PAPS, 10 units oh hexokinase and 5 mM D-glucose (final concentration) were added.
The solution was incubated at 30℃ for 30 min to convert ATP into ADP. This reaction was stopped by boiling water, and the precipitate was removed by
centrifugation (stage II). For the synthesis of APS, 25 units of either 3’-nucleotidase or P1-nuclease were added to stage I material, and the mixture incubated for 30 min in order to convert PAPS to APS. The reaction was terminated by placing the reaction vessel in a bath of boiling water, and the precipitate was once again removed by centrifugation (stage III). Pure PAPS and APS could be obtained by HPLC with RP-18 column with pump A (0.1 M KH2PO4 and 10 mM TBHS at pH 5.8, 0.9 ml/min) and pump B (acetonitrile, 0.1 ml/min) (Lin and Yang, 1998).
Determination of protein concentration.
The protein concentration of the homogeneous form of K65ER68G was estimated on the basis of absorbency at 280 nm (1.7 ml/mg cm-1) (Gills and Hippel, 1989) with a UV/Vis spectrophotometer (Hitachi UV/Vis-3300, Japan). Protein concentration of crude extract was estimated by Bradford protein assay kit.
Coupled-enzyme assay for protein sulfotransferase.
Each reaction mixture (1ml) contained 100 mM potassium phosphate buffer at pH 7.0, 5 mM 2-mercaptoethanol, 20 μM PAPS, 4 mM MUS, substrate (Ror2 peptide), 3.2 mU (5.4 μg) K65ER68G.. Crude extract was added following the pre-incubation period to start the reaction at 37°C. Because commercial PAPS contained significant amounts of PAP, which is an inhibitor of sulfotransferase (Yang et al., 1996; Duffel and Jakoby, 1998), the assay solution was pre-incubated for 15 min prior to the addition of substrate to ensure that all PAP was transferred to PAPS by K65ER68G
before the start of the complete reaction. The production of MU was monitored by fluorescence as previously described. The change of fluorescence was linear for over 20 min of the initial reaction time.
Sample preparation of mass spectrum.
Before MALSI-TOF MS analysis, we processed the peptides by Ziptip to get a higher purity. The Ziptip must be pre-wetted before we use. This is performed by depressing the pipettor plunger to a dead stop using the maximum volume setting of 10 µL. Aspirate wetting solution into tip, dispense to waste, repeat this step for several times. After that, equilibrate the tip for binding by washing with the equilibration solution 3 times. Following by these steps after equilibration, binds peptides and proteins to the ZipTip by fully depressing the pipettor plunger to a dead stop. Aspirate and dispense the sample 3 to 7 cycles for simple mixtures and up to 10 cycles for maximum binding of complex mixtures. Wash the tip and dispense to waste using at least five cycles of wash solution. A 5% methanol in 0.1% TFA/water wash improves desalting efficiency. Dispense 1 to 4 µL of elution solution into a clean vial using a standard pipette tip. Carefully, aspirate and dispense elution through the ZipTip at least three times without introducing air. Sample recovery can be improved (at the expense of concentration) by increasing elution volume to 10 µL or by performing multiple elutions.
MALDI-TOF MS Analysis.
Peptide mass mapping was performed on a Bruker (Bruker-Daltonics, Bremen, Germany) REFLEX III time-of-flight mass spectrometer equipped with a SCOUT source and delayed extraction. Detection was performed in the positive ion reflector mode with each mass determination being the average of 100 spectra. Samples for mass measurement were prepared using the solution-phase nitrocellulose method (Landry et al., 2000) with a-cyano-4-hydroxycinnamic acid as the matrix. Alternatively, samples were deposited on a Bruker 600 micron AnchorChip according to the manufacturer's instructions. Angiotensin II (1,045.54 amu), adrenocorticotropic hormone fragment 18–39 (2,465.73 amu), and somatostatin (3,146.47) were used as external calibration standards. The peptide mass spectra obtained on MALDI-TOF analysis were analyzed using PeptidIdent (http://tw.expasy.org) and Profound
Result and Discussion
Purification of human PAPS synthetase.
The hPAPSS cDNA were ligated into expression vector pET-21b using T4 DNA ligase at 3:1 molar ratio of insertion to vector. The resulting plasmid was verified for the presence of the hPAPSS by DNA sequencing, then transformed into E coli strain. The expressed protein had hexa-His in C-terminal, so we purified hPAPSS to homogeneity from an overproducing strain of E coli BL21 (DE3), which encoded
hPAPSS, through Ni2+-chelating column and then Hitrap Q column. The isolated
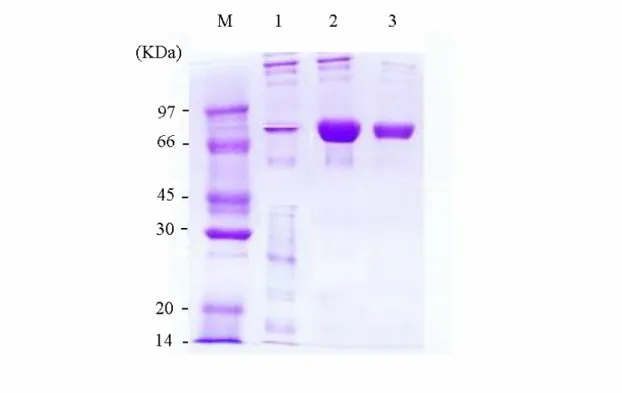
enzyme analyzed by SDS-PAGE existed ~ 70 kDa, as shown in Figure 2.
K65ER68G as catalyst for the depletion of PAPS.
In this proposed coupled-enzyme assay, PST was used to deplete PAPS to PAP with MU as a sulfuryl group acceptor. For maintaining the coupled-enzyme assay, a suitable ST was required for use in the PAPS measurement step (Chen et al, 2005). Since all STs need PAPS as a cofactor (Klaassen and Boles, 1997), it is said that any ST-catalyzed reaction could potentially be used for this purpose. However, the sensitivity of the previous coupled enzyme assays for PAPSS was limited (Hazelton et
al., 1985; Wong et al., 1990; Wong and Wong, 1994; Vargas, 1988), because ATP,
Rens-Domiano and Roth, 1987). Fortunately, previous studies had demonstrated that a PST mutant, K65ER68G, could diminish the inhibition of ATP mentioned above (Chen et al., 2005; Xu et al., 2001; Yang et al., 1996). Previous reports indicated that the maximal sulfonating activity of MU by K65ER68G was almost four times that of wild-type PST(Chen et al., 2005). In addition, K65ER68G could tolerate substrate inhibition to higher extent than wild-type PST as mentioned above. In a physiological reaction catalyzed by K65ER68G with 1 mM ATP and 20 μM MU, 70-80% activity was still observed (shown in Table 2 ) compared to nearly no activity with that of wild-type PST (data not shown) (Xu et al., 2001). This situation could be observed in the reverse physiological reaction (Table 3). In addition, preliminary studies also showed that K65ER68G could efficiently catalyze PAPS for the transfer of sulfuryl group, and PAP and MU did not form ternary complex to inhibit the reaction under the conditions adopted in this report (Chen et al., 2005; Yang et al., 1996).
Selection of excitation and emission wavelength s for the coupled-enzyme assay.
A suitable excitation wavelength was determined to prevent the “inner filter effect” (Lackowicz, 1983) caused by the absorption of MUS. Therefore, PAPSS activity was in effect determined by the decrease of fluorescence of MU at 450 nm upon excitation at 360 nm (Chen et al., 2005). The relative emission coefficient of the fluorescence at 450 nm was determined under different conditions as shown in Table 1. The sensitivity of this method could thus reach nM range since the pmole amount of MU could be reliably determined. The intensity of the fluorescence was significantly
dependent on the pH value ranging from 6 to 10, primarily due to the deprotonation of MU at alkaline pH (pKa of MU = 7.8 (Sun et al., 1998)). The temperature effect was less significant as shown in Table 1.
Coupled-enzyme assay for human PAPS synthetase.
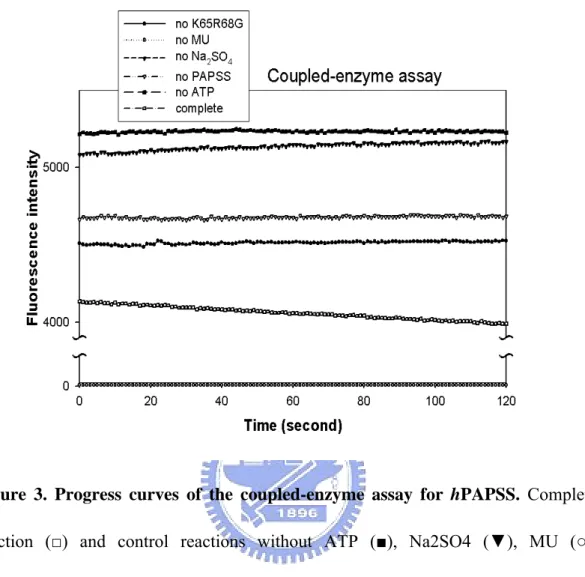
It is expected that the rate of hPAPSS, which was in the range of nmole/min/mg (Xu et al, 2001), could be easily monitored using this coupled-enzyme system. It is worth pointing out that the major requirements for this assay were the adequate amount of MU and an excess of K65ER68G activity. Figure 3 shows the time course of the changes in fluorescence for the coupled hPAPSS/K65ER68G reaction and corresponding controls, where specific components of the reaction mixture were omitted. Only for the complete reaction did we observe a decrease in fluorescence, reflecting the enzymatic activity of hPAPSS. The fluorescence background was, however, almost constant in the absence of K65ER68G or MU. Under these conditions, the coupled reaction did not take place. No effects were observed on the measured rates by raising the amount of K65ER68G (data not shown), which indicated that the reaction rate of K65ER68G is fast enough for the coupling system to reach its maximum activity. Taken together with the results shown in Figure 3, it was concluded that the continuous changes in fluorescence were specifically attributable to hPAPSS activity.
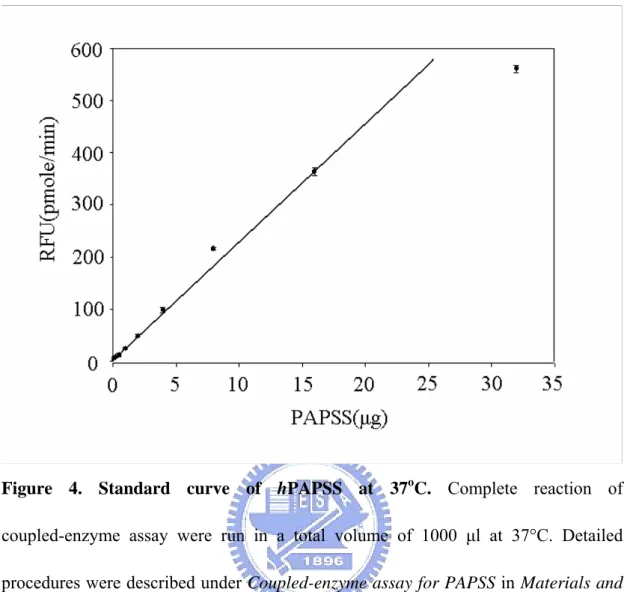
To determine the linear range of hPAPSS assay at a given K65ER68G concentration (5mU), the rate of MU reduction was measured using a concentration
range (0.5-8 μg) of hPAPSS as shown in Figure 4. In addition, this linear range and sensitivity of hPAPSS assay could be further extended for other needs.
To test our coupled-enzyme assay and compare the results with the data appeared in the literature, the hPAPSS was characterized by this fluorometric assay as shown in
Figures 5 to Figure 9. These results fit perfectly with previously reported data using
radioactive assay procedures (Fuda et al, 2002 ). Figure 5 shows the pH-dependency of the hPAPSS activity. The optimum pH spans from 7 through 9. The enzyme activity at pH 6.0 was approximately 50% of that in the optimum pH range. At pH 10.0, there was no activity be detected. The effects of temperature on the hPAPSS activity was examined over 20-55℃ as shown in Figure 6. Maximum activity was observed at approximately 40℃. The enzyme activity at 20℃ and 50℃ were approximately 50% of the maximum activity at 40℃. At 55℃ or higher, hPAPSS became inactive. Figure 7 to Figure 9 shows the concentration of ATP、sodium sulfate and APS on the hPAPSS activity. ATP was determined to yield Km and Vmax values of 2.5mM and 24 nmole/min/mg. Sodium sulfate was determined to yield these values of 22mM and 30.3 nmole/min/mg. The Km and Vmax values of APS was determined to be 63.3μM and 30.9 nmole/min/mg.
Coupled-enzyme assay for serine and threonine protein sulfotransferase .
Figure 11 shows the time course of the changes in fluorescence for the coupled
serine and threonine protein sulfotransferase/K65ER68G reaction and corresponding controls, where specific components of the reaction mixture were omitted. Only for
the complete reaction did we observe an increase in fluorescence, reflecting the enzymatic activity of serine and threonine protein sulfotransferase. Some background fluorescence due to the auxiliary reaction was observed. This was probably because of the presence of an impurity of PAP in commercially available PAPS (Duffel and Jakoby, 1981; Yang et al., 1996). The fluorescence in the background was, however, low in the absence of PAPS, K65ER68G, or MUS. Under these conditions, the auxiliary reaction did not take place. No effects were observed on the measured rates by raising the concentration of PAPS (data not shown), which indicated that the PAPS concentration was saturating enough for the coupling system to reach its maximum activity. Taken together with the results shown in Figure 11, it was concluded that the continuous changes in fluorescence were specifically attributable to serine and threonine protein sulfotransferase activity.
In the experiment of standard curve (Figure 12 ), we found that the crude extract also has a linear range in the catalyzation of protein sulfation. Besides this, we found that there was a familiar result with the enzyme kinetic (Figure 13). This suggested that the crude extract surely has the activity of serine and threonine protein sulfotransferase.
Result of mass spectrum
Figure 14 shows the intensity signal of the peptide QAKLKEISLSAVRFME (Ror-2 peptide) treated with rat liver crude extract. The molecular weight of peptide Ror-2 peptide was 1850.21 Dalton. The intensity of the MS signal represents the
amount of the peptide. After performing the coupled enzyme assay, we have found the MS intensity of Ror-2 peptide to be decreased. It indicates that the amount of the Ror-2 peptide decreased. After sulfation, the Ror-2 peptide would add two sulfuryl groups whose molecular weight was 79.9568 Dalton. Eventually, the molecular weight of peptide Ror-2 peptide becomes 2010.12 Dalton. Since the molecular weight of Ror-2 peptide changed, the signal intensity of Ror-2 peptide decreased. The situation described above could change the intensity signal of the MS data. Fortunately, we found there were apparently decrease at 1850.21 Dalton. This represents that the peptide Ror-2 peptide surely would be used under this coupled-enzyme assay condition.
Conclusion
We have developed a non-radioisotopic coupled-enzyme assay for PAPS synthetase and serine and threonine protein sulfotransferase. This is the first report for continuous flourometric assay for PAPS synthetase and serine and threonine protein sulfotransferase. In the enzyme-coupled assay for PAPS synthetase, the selection of recombinant PAP-free PST (K65ER68G) for use in the PAPS measurement step represented a critical factor not only to tolerate substrates inhibition by PAP and MU but also inhibition by ATP to higher extent. Not only is this method useful for the routine and detailed kinetic study of this important class of enzymes but also has the potential for the development of a high-throughput procedure using microplate reader. In the enzyme-coupled assay for serine/threonine protein sulfotransferase, the assay must be modified in the future.
Table 1
The Relative Emission Coefficient of MU at 450 nma
Relative Emission coefficient (cm-1nM-1) Temperature (℃) pH 25 30 35 37 40 45 50 6.0 0.14 6.5 0.31 7.0 0.48 0.50 0.52 0.55 0.58 0.60 0.63 7.5 0.73 8.0 1.31 8.5 1.85 9.0 2.35 9.5 3.30 10.0 4.45
a The fluorescence of MU (100, 200, and 400 nM) in 100 mM buffer (MES at pH 6.0, potassium phosphate at pHs 7.0 and 7.5, Tris-base at pHs 8.0 and 9.0 and glycine at pH 10.0) was determined with a spectrofluorometer (Hitachi F-4500, Japan). The excitation and emission wavelengths were at 360 and 450 nm, respectively.
Table 2
Inhibition of ATP in Physiological reaction
[ATP](mM) Activity(pmole/min) Inhibition rate
0 514.0278
1 401.0417 22%
Table 3
Inhibition of ATP in reverse physiological reaction
[ATP](mM) Activity(pmole/min) Inhibition rate
0 206.6667
1 147.0347 29%
Figure 1. Scheme for the determination of PAPSS activity. Human PAPS
synthetase, which was a bifunctional enzyme with ATP sulfurylase and APS kinase, catalyzed the biosynthesis of PAPS from ATP and sodium sulfate. This enzyme coupled assay was based on the depletion of PAPS to PAP catalyzed by a recombinant PST (K65ER68G) which uses MU as the sulfuryl group acceptor. In coupled-enzyme assay, PST represented an auxiliary enzyme, and MU was used as a fluorescent indicator of enzyme turnover.
Figure 2. SDS-PAGE for determination of human PAPS synthetase. Lane 1
represented the extract induced by IPTG. Lane 2 and 3 indicated the expressed proteins were purified by Ni2+-chelating column and then Hitrap Q column, respectively. Lane M represented protein marker.
Figure 3. Progress curves of the coupled-enzyme assay for hPAPSS. Complete
reaction (□) and control reactions without ATP (■), Na2SO4 (▼), MU (○), K65ER68G (●), or human PAPSS( ) of coupled▽ -enzyme assay for PAPSS were conducted at pH 7.0, 25°C. Detailed procedures were described in Materials and
Figure 4. Standard curve of hPAPSS at 37oC. Complete reaction of
coupled-enzyme assay were run in a total volume of 1000 μl at 37°C. Detailed procedures were described under Coupled-enzyme assay for PAPSS in Materials and
Methods. Each point was determined from triplicate assay data and standard error was
Figure 5. pH profile of recombinant hPAPSS. The enzymatic assays were
carriedout with about 2 μg recombinant hPAPSS under the condition of
Coupled-enzyme assay for AST as described in Materials and Methods using different
buffer systems (100 mM MES at pH 6.0 to 7.0, potassium phosphate at pH 7.0 to 8.0, Tris-base at pH 8.0 to 9.5, and glycine at pH 9.5 to 10.0). Each point was determined from triplicate assay data and standard error was obtained by SigmaPlot 2001, V7.0 (SPSS Inc., Chicago, IL).
Figure 6. Temperature effect on the activity of recombinant hPAPSS. The
enzymatic assays were carried out with about 2 μg recombinant hDHEA-ST under the condition of coupled-enzyme assay for hPAPSS at pH 7.0 in different temperature. Each point was determined from triplicate assay data and standard error was obtained by SigmaPlot 2001, V7.0 (SPSS Inc., Chicago, IL).
Figure 7. Concentration of ATP on hPAPSS activity. The enzymatic assays were
carried out with about 2 μ g recombinant hPAPSS under the condition of coupled-enzyme assay for hPAPSS at pH 7.0 and 37oC in different concentration of ATP. Each point was determined from triplicate assay data and standard error was obtained by SigmaPlot 2001, V7.0 (SPSS Inc., Chicago, IL).
Figure 8. Concentration of sodium sulfate on hPAPSS activity. The enzymatic
assays were carried out with about 2 μg recombinant hPAPSS under the condition of coupled-enzyme assay for hPAPSS at pH 7.0 and 37oC in different concentration of sodium sulfate. Each point was determined from triplicate assay data and standard error was obtained by SigmaPlot 2001, V7.0 (SPSS Inc., Chicago, IL).
Figure 9. Concentration of APS on hPAPSS activity. The enzymatic assays were
carried out with about 2 μ g recombinant hPAPSS under the condition of coupled-enzyme assay for hPAPSS at pH 7.0 and 37oC in different concentration of APS. Each point was determined from triplicate assay data and standard error was obtained by SigmaPlot 2001, V7.0 (SPSS Inc., Chicago, IL).
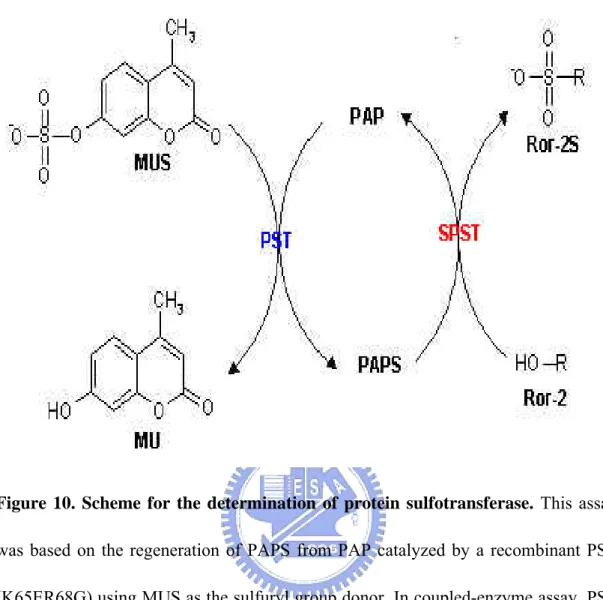
Figure 10. Scheme for the determination of protein sulfotransferase. This assay
was based on the regeneration of PAPS from PAP catalyzed by a recombinant PST (K65ER68G) using MUS as the sulfuryl group donor. In coupled-enzyme assay, PST represented an auxiliary enzyme, and the product, MU, was used as a fluorescent indicator of enzyme turnover. Moreover, the biosynthesis of PAPS from ATP and SO42- was catalyzed by hPAPS synthetase, which was a bifunctional enzyme with activity of ATP sulfurylase and APS kinase.
Figure 11. Progress curves of the coupled-enzyme assay for protein sulfotransferase. Complete reaction(▽) and control reactions without PAPS (●),
subtrate ( ▼ ) and crude extract ( ○ ) of coupled-enzyme assay for protein sulfotransferase were conducted at pH 7.0, 37°C. Detailed procedures were described under Coupled-enzyme assay for protein sulfotransferase in Materials and Methods.
Figure 12. Effective range of fluorometric assay for protein sulfotransferase.
Complete reaction of coupled-enzyme assay were run in a total volume of 1000 μl at 37°C. Detailed procedures were described under Coupled-enzyme assay for AST in
Materials and Methods. Each point was determined from triplicate assay data and
Figure 13. Concentration of peptide on protein sulfotransferase activity. The enzymatic assays were carried out with about 150 μg rat crude extract under the condition of coupled-enzyme assay for protein sulfotransferase at pH 7.0 and 37oC in different concentration of peptide. Each point was determined from triplicate assay data and standard error was obtained by SigmaPlot 2001, V7.0 (SPSS Inc., Chicago, IL).
1833.190 1650.882 1961.280 1704.901 1522.776 1890.240 2089.437 1779.953 1589.786 2217.421 1SRef 0 1 2 3 4 x10 In ten s . [a .u. ] 1650.944 1850.018 1704.881 1522.862 1978.040 1763.965 1890.040 1593.860 2107.055 1SRef 0 2000 4000 6000 8000 Inte ns . [a.u .] 1850.228 1961.276 1704.854 2089.391 1921.170 1SRef 0 0 0.5 1.0 1.5 4 x10 In ten s . [a .u. ] 1849.954 1721.865 1977.962 1SRef 0 200 400 600 800 1000 In ten s . [a .u. ] 1500 1600 1700 1800 1900 2000 2100 2200 m/z
Figure 14. MALDI-TOF spectrum analysis. spectrum 1 and spectrum 2 are the
peptide treated after coupled-enzyme assay, and spectrum 3 and spectrum 4 represent the untreated peptide.
Reference
Beisswanger R., Corbeil D., Vannier C., Thiele C., Dohrmann U., Kellner R., Ashman K., Niehrs C., Huttner W. B., Existence of distinct tyrosylprotein sulfotransferase genes : molecular characterization of tyrosylprotein sulfotransferase-2, Proc. Natl. Acad. Sci. USA 95 (1998), 11134-9.
Bettelheim F. R., Tyrosine-O-sulfate in a peptide from fibrinogen, J. Am. Chem. Soc.
76 (1954), 2838-2839.
Chen W. -T., Liu M. -C., Yang Y. –S., Flourometric assay for alcohol sulfotransferase.
Anal Biochem. 339 (2005) 54-60.
Chen X., Yang Y. –S., Zheng Y., Martin B. M., Duffel M. W., Jakoby W. B., Tyrosine-ester sulfotransferase from rat liver: bacterial expression and identification, Protein Expr. Purif. 3 (1992), 421-426.
Duffel M. W., Jakoby W. B., On the mechanism of aryl sulfotransferase, J. Biol.
Farooqui A. A., 3’-phophoadenosine 5’-phosphosulfate metabolism in mammalian t tissues. Int J Biochem. 12 (1980) 529-536.
Fuda H., Shimizu C., Lee Y. C., Akita H., Strott C. A., Characterization and expression of human bifunctional 3’-phosphoadenosine 5’- phosphosulfate synthase isoforms. Biochem. J. 365 (2002) 497 – 504.
Gill S. C., von Hippel P. H., Calculation of protein extinction coefficients from amino acid sequence data, Anal. Biochem. 182 (1989), 319-326
Girard J. P., Baekkevold E. S., Amalric F., Sulfation in high endothelial venules: cloning and expression of the human PAPS synthetase. FASEB J. 12 (1998) 603-612.
Grogory J. D., Robbins P. W., Metabolism of sulfur compounds (sulfate metabolism).
Annu. Rev. Biochem. 29 (1960) 347-364.
Hazelton G. A., Hjelle J. J., Dills R. L., Klaassen C. D., A radiometric method for the measurement of 3’-phosphoadenosine-5’-phosphosulfate in rat and mouse liver.
Drug Metab Dispos. 13 (1985) 30-34.
proteins, Nature 299 (1982), 273-276.
Huttner W. B., Tyrosine sulfation and the secretory pathway, Annu. Rev. Physiol. 50 (1998), 363-376.
Kehoe J. W., Bertozzi C. R., Tyrosine sulfation:a modulator of extracellular protein-protein interactions, Chem. Biol. 7 (2000), 57-61..
Klaassen C. D., Boles J. W., The improtance of 3’-phosphoadenosine 5’-phosphosulfate (PAPS) in the regulation of sulfation. FASEB J. 11 (1997) 404-418.
Kurima K., Warman M. L., Krishnan S., Domowicz M., Krueger R. C. Jr., Deyrup A., Schwartz N. B., A member of a family of sulphate-activating enzymes causes murine brachymorphism. Proc. Natl. Acad. Sci. USA 95 (1998) 8681-8685.
Lackowicz J. R., Principles of Fluorescence Spectroscopy, Plenum Press, New York, 1983.
Laemmli U. K., Cleavage of structural proteins during the assembly of the head of bacteriophage T4, Nature 227 (1970), 680-685.
Landry F., Lombardo C. R., Smith J. W., A method for application of samples to matrix-assisted laser desorption ionization time-of-flight targets that enhances peptide detection. Anal. Biochem. 279 (2000), 1–8.
Lackowicz J. R., Principles of Flourescence Spectroscopy, Plenum Press, New York, 1983.
Li H., Deyrup A., Mensch J. R. Jr., Domowicz M., Konstantinidis A. K., Schwartz N. B., The isolation and characterization of cDNA encoding the mouse bifunctional ATP sulfurylase adenosine 5’-phosphosulfate kinase. J. Biol. Chem. 270 (1995) 29453-29459.
Lin E. –S., Yang Y. –S., Colorimetric determination of the purity of 3’-phospho adenosine 5’-phosphosulfate and natural abundance of 3’-phospho adenosine 5’-phosphate at picomole quantities, Anal. Biochem. 264 (1998) 111-117.
Medzihradszky K. F., Darula Z., Perlson E., Fainzilber M., Chalkley R. J., Ball H., Greenbaum D., Bogyo M., Tyson D. R., Bradshao R. A., Burlingame A. L., O-Sulfonation of serine and threonine, Molecular & Cellular Proteomics. 3 (2004) 429-443.
Chem. 278 (2003) 24243-24246
Niehrs C., Beisswanger R., Huttner W. B., Protein rytosine sulfation, 1993-an update,
Chem. Biol. Interact. 92 (1994), 257-271.
Niers C., Kraft M., Lee Raymond W. H., Huttner W. B., Analysis of the substrates specificity of tyrosylprotein sulfotransferase using synthetic peptides. J. Biol. Chem.
265 (1990) 8525-8532.
Ouyang Y., Lane W. S., Moore K. L., Tyrosylprotein sulfotransferase:purification and molecular cloning of an enzyme that catalyzes tyrosine O-sulfation, a common posttranslational modification of eukaryotic proteins, Proc. Natl. Acad. Sci. USA 95 (1998), 2896-901.
Ouyang Y. B., Moore K. L., Molecular cloning and expression of human and mouse tyrosylprotein sulfotransferase-2 and a tyrosylprotein sulfotransferase homologue in Caenorhabditis elegans, J. Biol. Chem. 273 (1998), 24770-4.
Ramaswamy S. G., Jakoby W. B., Sulfotransferase assays. Method Enzymol. 143 (1987) 201-207.
analogues of 3’-phosphoadenosine 5’-phosphosulfate. J. Neurochem. 48 (1987) 1411-1415.
Robbins P., Lippmann F., Identification of enzymatically active sulfate as adenosine-3’-phosphate-5’-phospho-sulfate. J. Am. Chem. Soc. 78 (1956) 2653-2653
Satischchandran C., Markham G. D., Adenosine-5’-phosphosulfate kinase from
Escherichia coli K12. J. Biol. Chem. 264 (1989) 15012-15021
Sun W.C., Gee K.R., Haugland R.P., Synthesis of novel fluorinated coumarins:excellent UV-light excitable fluorescent dyes, Bioorg Med Chem Lett.
8(1998) 3107-3110.
Strott, C. A., Sulfonation and molecular action. Endorcr. Rev. 23 (2002) 703-732
ul Haque M. F., King L. M., Krakow D., Cantor R. M., Rusiniak M. E., Swank R. T., Superti-Furga A., Haque S., Abbas H., Ahmad W., Ahmad M., Cohn D. H., Mutations in orthologous genes in human spondyloepimetaphyseal dysplasia and the brachymorphic mouse. Nat. Genet. 20 (1998) 157-162.
5’-phospho[35S]sulfate with high specific activity. Anal Biochem. 172 (1988) 82-88.
Venkatachalam K. V., Akita H., Strott C. A., Molecular cloning, expression, and characterization of human bifunctional 3’-phosphoadenosine 5’-phosphosulfate synthase and its functional domains, J. Biol. Chem. 273 (1998) 19311-19320.
Weinshilboum R., Otterness D., Kaufmann F. C., Conjugation-deconjugation reactions in drug metabolism and toxicity, Springer-Verlag, Berlin, (1994), 45-78.
Williams R. T., Detoxication Mechanisms 2nd ed., Chapmam and Hall, London.
Wilson A. P., Rider C. C., Evidence that leukosialin, CD43, is intensely sulphated in the murine T lymphoma line RDM-4, J. Immunol. 148 (1992) 1777-1783.
Wong K. O., Wong K. P., Biosynthesis of 3’-phosphoadenosine 5’-phosphosulfate (PAPS) in rate skin. Biochem. Pharmacol. 47 (1994) 477-483.
Wong K. P., Khoo B. Y., Sit K. H., Biosynthesis of PAPS in vitro by human liver: Measurement by two independent assay procedures. Biochem. Pharmacol. 47 (1990) 63-69.
Xia G., Evers M. R., Kang H. G., Schachner M., Baenziger J. U., Molecular cloning and expression of the pituitary glycoprotein hormone N-acetylgalactosamine 4-O-sulfotransferase, J. Biol. Chem. 275 (2000), 38402-38409.
Xu Z. –H., Otterness D. M., Freimuth R. R., Carlini E. J., Wood T. C., Mitchell S., Moon E., Kim U. J., Xu J. P., Siciliano M. J., Weinshilboum R. M., Human 3’-phosphoadenosine 5’-phosphosulfate synthetase 1 (PAPSS1) and 2 gene cloning, characterization and chromosomal localization. Biochem. Biophys. Res. Commun.
268 (2000) 437-444.
Xu Z. -H., Wood T. C., Adjei A. A., Weinshilboum R. M., Human 3’-phosphoadenosine 5’-phosphosulfate synthetase: radiochemical enzymetic assay, biochemical properties, and heptic variation, Drug Metab. Dispos. 291 (2001) 172-178.
Yang Y. –S., Marshall A. D., McPhie P., Guo W. X., Xie X., Chen X., Jakoby W. B., Two phenol sulfotransferase species from one cDNA: nature of the differences,
Appendix
Enzyme purification (rat phenol sulfotransferase)
This experiment uses DEAE-Sephacel Column(Pharmacia, Hong Kong).
1. Load the sample into equilibrated DEAE-Sephacel Column, and wash the column with three column volumes of Buffer A (10mM Tris-Base at pH 7.4、125mM Sucrose 、 10% Glycerol 、 1mM PMSF(2-propanol) 、 1mM EDTA 、 1mM Dithiothreitol) to elute non-bound protein
2. Elute the bound protein with Buffer B which is Buffer A containing 0.2 M NaCl and collect wash fraction.
3. Remove the salt by dialysis or ultra-filtration, store the protein at -80oC.
Enzyme purification (human PAPS synthetase)
This experiment uses Hitrap Chelating HP (Pharmacia, Hong Kong ).The following step is modified from affinity handbook of Pharmacia.
1. This avoids the risk of nickel salt precipitation in the next step. If air is trapped in the column, wash the column with distilled water until the air disappears.
2. Prepare column by washing with distilled water and loading with 0.5 column volume of NiSO4. After that, washing with 5 column volumes of distilled water again.
4. Apply sample at a flow rate 5 ml/min. Collect the flow-through fraction. A pump is more suitable for application of sample volumes greater than 15 ml.
5. Wash with 10 column volumes of binding buffer. Collect wash fraction.
6. Elute with 5 column volumes of elution buffer. Collect eluted fractions in small fractions such as 1 ml to avoid dilution of the eluate.
7. Wash with 10 column volumes of binding buffer. The column is now ready for a new purification and there is rarely a need to reload with metal if the same (His)6 fusion protein is to be purified.
Estimate Kmand Vmax
This experiment performed couple-enzyme assay and enzyme transformation with
different substrate concentration. Plot the figure with enzyme activity and substrate concentration, use computer to calculate Km and Vmax.
Equation for calculating protein concentration Rat phenol sulfotransferase (rPST)
ε = ( 5690×7 + 1280×14 + 120×5 ) M-1cm-1 = 58350 M-1cm-1 M. W.: 33904
ε = 58350 M-1cm-1÷ 33904 = 1.7 (mg/mL)-1cm-1
Human PAPS synthetase (hPAPSS)
M. W.: 70833
Autography
2004-2006:Department of Biological Science and Technology, National Chiao Tung University, Hsinchu, Taiwan, ROC
1997-2002:Department of Atmospheric Sciences, National Taiwan University, Taipei, Taiwan, ROC