國 立 交 通 大 學
電機工程學系
博士論文
腦神經訊號感測元件開發與系統整合應用
Development of Neural Recording Sensors and Electronics for
Microsystem Integration
研 究 生:張志瑋
指導教授:邱俊誠 教授
腦神經訊號感測元件開發與系統整合應用
研究生:張志瑋 指導教授:邱俊誠 博士
國立交通大學電控工程研究所博士班
摘要
此論文討論各式腦神經電訊號感測器與生醫電子電路系統設計相關研究,以應用於神 經醫療微系統整合為最終目的。研究內容包括(一) 微機電針狀乾式電極,使用於腦電 波紀錄,擁有優秀的感測介面阻抗表現;具有自我穩定機制與可應用於光動力療法之 微探針陣列亦在本論文中逐一探討。(二) 可撓性大腦皮層感測電極陣列,利用高分子 聚合物製造,可應用於腦部表面電位量測,此成果已在聲音刺激大鼠腦部聽覺神經反 應紀錄中獲得驗證。(三) 三維神經探針感測陣列,以觀察與紀錄神經訊號在三維神經 組織空間中的傳遞以及訊號源的分析為目的,其相關製程與封裝技術可用於與後級晶 片整合。(四)無線傳能系統,包括了電感耦合線圈以及低壓降整流器製作,可用於無 電池之微系統應用。(五)多通道類比前端放大器的設計與製作,其具有低功耗低雜訊 的特色,並結合微控器與藍芽傳輸介面設計,做為各式神經訊號感測之醫療輔具應用 系統之初步實現。上述諸類感測器涵蓋了各式腦神經電訊號範圍,而電源與感測電路 設計亦為生醫微系統不可或缺的重要角色,搭配其他電子元件即可成為應用於生醫感 測之整合式微系統。Development of Neural Recording Sensors and Electronics
for Microsystem Integration
Student:Chih-Wei Chang
Advisor:Dr. Jin-Chern Chiou
Institute of Electrical and Control Engineering
National Chiao-Tung University
Abstract
In this dissertation, versatile neural sensors and electronics are developed for biomedical microsystems integration. Presented devices include (1) MEMS surface mounted dry electrode (MDE), which provides superior low interface impedance performance. Alternative diamond-shaped MDE and transparent MDE for self-stability enhancement and PDT applications are also reported. (2) Flexible gird electrode array using parylene-C as structure is fabricated for ECoG recording with in-vivo auditory response recording in rat. (3) Stacked three dimensional (3D) microprobe array developed for implantable neural recording provides simple process, solid structure with possibility for system integration, design flexibility and volume usage efficiency. The neural signal data acquired by the 3D array achieves the recording and mapping of the neural signal network and interconnections among the target brain structure, which allows further studies for event-related observation. (4) Wireless RF-powering electronics, which is designed for implantable biomedical microsystem applications. Miniaturized spiral coils as a wireless power module and low-dropout linear regulator circuit convert RF signal into DC voltage for batteryless applications. (5) 16-channel analog front end neural amplifier is introduced for biopotential conditioning, which offers technical merits of reduced supply voltage, sufficient low power per channel and reasonable low noise performance, yet offers integration with micro controller unit and Bluetooth modules for conceptual biomedical microsystem representation. Proposed sensors and electronics provide versatile neural recording and key component realization in microsystem design, as well as achieving the development of biomedical prosthesis applications by integrating with commercial modules.
誌謝
感謝指導老師 邱俊誠教授在求學路上的諄諄教誨,師恩浩蕩,永銘於心。感謝 口試委員吳重雨教授、羅錦興教授、歐陽盟教授、梁勝富教授與段正仁博士的 指導與建議,讓此論文更加完備。此外,感謝辛裕隆醫師、陳右穎教授、黃建 峻博士與張嘉麟博士在研究上的協助與勉勵。 感謝實驗室朝夕相處互相砥礪的夥伴,陳志良、洪振鈞、謝禮忠、侯冠州、蔡 尚瑋、林君穎、林岳正、黃煜傑、周俊仲、鄒慶華、何檀均、王詠鋒、洪聖昕、 陳彥璋、楊可筠以及詹巧雯,小弟感銘五內。 感謝女友婉筠的支持與陪伴,是促使我不斷前進的動力。 最後謹以此論文獻給我的父母,以及弟妹,沒有你們,就沒有今天的我。 江雨霏霏江草齊,六朝如夢鳥空啼。 無情最是臺城柳,依舊煙籠十里堤。 張志瑋 2011 年五月 新竹Content
摘要 ... i
Abstract ... ii
誌謝 ... iii
Chapter 1 Introduction ... 1
1.1 Biopotential Signals in Brain ... 1
1.2 Preview of Neural Recording Sensors and Systems ... 3
1.3 Motivation for sensor and system development. ... 4
1.4 Organization of Dissertation Work ... 5
Chapter 2 Skin Surface-Mounted MEMS Dry Electrode ... 7
2.1 Biopotential Electrode for Electroencephalography Recording ... 7
2.2 MEMS Dry Electrode ... 7
2.3 Diamond-Shaped MDE ... 9
2.3 Fabrication and Characterization ... 10
2.4 Drowsiness Monitoring with MDE ... 14
2.5 Transparent MDE for Photodynamic Therapy Application ... 17
2.6 Summary ... 20
Chapter 3 Flexible Brain Surface Grid Electrode Array ... 22
3.1 Electrocorticography in Brain ... 22
3.2 Design Criterion ... 22
3.3 Fabrication and Characterization ... 24
3.4 In-vivo Recording of Auditory Response in Rat ... 25
3.5 Summary ... 28
Chapter 4 Three Dimensional Neural Probe Array ... 29
4.1 3-Dimensional Electrophysiology Recording of Biological Cells ... 29
4.2 Stacked Multichip Structure Design ... 32
4.3 Fabrication, Assembly and Characterization ... 34
4.4 Neural Recording in Rat Brain ... 37
4.5 3D Signal Acquisition in Human Brain Resection Tissue ... 38
4.6 Summary ... 40
Chapter 5 Integrated Electronics toward Microsystem ... 41
5.1 Biomedical Microsystem for Neuroprosthesis ... 41
5.2 Wireless Powering Coil and Circuitry ... 42
5.3 Multichannel Analog Front End ... 51
5.4 Summary ... 58
Chapter 6 Conclusion ... 59
6.1 Summary of Thesis ... 59
6.2 Future Work ... 60
List of Figures
Fig. 1.1 Waveforms of the biopotentials ... 2
Fig. 1.2 Biopotentials in brain ... 3
Fig. 1.3 Brain electrical activity recording ... 3
Fig. 1.4 Proposed neural sensors and microsystems in this thesis ... 5
Fig. 2.1 Implementation diagram of wet electrode, MDE and DS-MDE ... 8
Fig. 2.2 Electrode-skin interface comparison . ... 9
Fig. 2.3 Stability modeling ... 10
Fig. 2.4 Fabrication process flow ... 11
Fig. 2.5 Fabrication results ... 11
Fig. 2.6 Electrode-skin interface impedance characterization ... 12
Fig. 2.7 Recording example of alpha rhythm by MDE and standard wet electrode ... 12
Fig. 2.8 (A) Simultaneously EEG (B) 5-s segment signals. (C) Statistics analysis. ... 13
Fig. 2.9 Pulling test result. . ... 14
Fig. 2.10 Drowsiness level detection by EEG power spectrum observation ... 15
Fig. 2.11 EEG estimated (red line) and actual VR driving error (blue). ... 16
Fig. 2.12 Light propagation in skin: direct illumination or through transparent MDE ... 18
Fig. 2.13 The hot embossing process to manufacture transparent polymer based MDE ... 19
Fig. 2.14 The optical microscope photograph of transparent MDE. ... 19
Fig. 2.15 (A) Eexperiment setup (B) Experiment results ... 20
Fig. 3.1 Fabrication process flow of the presented implantable grid electrode array... 24
Fig. 3.2 Fabricated grid electrode array ... 25
Fig. 3.3 Impedance characterization of single electrode ... 25
Fig. 3.4 Electrode implantation location, rat brain anatomy is adopted from reference ... 26
Fig. 3.5 16-channel recoding in 1 second time frame ... 26
Fig. 3.6 Time-magnitude plot of the averaged 16ch auditory ECoG response. ... 27
Fig. 3.7 Time-frequency plot of the averaged 16ch auditory ECoG response. ... 27
Fig. 4.1 The schematic of stacking a 4 × 4 3-D microprobe array ... 32
Fig. 4.2 (A) Presented stacking method (B) Conceptual representation interface ... 33
Fig. 4.3 (A)Fabrication steps (B) Fabricated Probe (C) Fabricated parts (D) Tip electrode .... 35
Fig. 4.4 Proposed assembly anti-flow process and related practical photographs ... 36
Fig. 4.5 (A) Stacked 4-layer probe array (B)Packaged 3D structure ... 37
Fig. 4.6 Impedance characterization of fabricated 3D probe array ... 37
Fig. 4.7 (A) Photograph of microprobe (B) The in situ location (C) The neural recording ... 38
Fig. 4.8 Recorded spontaneous neural activity in motor cortex of rat ... 38
Fig. 4.9 Recorded raw data from resection brain tissue ... 39
Fig. 4.10 (A) 3D distributed electrodes (B) Normalized LPF propagation ... 39
Fig. 5.1 Electrical system block diagram of the wireless powering system ... 42
Fig. 5.3 (A) Receiving coil (B) External coil (C) Measured S parameter (D) Smith chart ... 44
Fig. 5.4 Full-wave bridge rectifier using 4 diodes ... 44
Fig. 5.5 Antenna efficiency characterization ... 45
Fig. 5.6 Block diagram of the proposed low-dropout linear regulator ... 45
Fig. 5.7 Error amplifier circuit... 46
Fig. 5.8 (A) Bandgap voltage reference generator and (B) Over-thermal protection circuit ... 47
Fig. 5.9 (A) Optical microphotograph of the fabricated chip (B) PSRR of the LDO ... 47
Fig. 5.10 (A) Stability (B) Load transient (C) Ripple observation (D) Output spike ... 48
Fig. 5.11 (A) Fabricated system (B) Schematic (C) Receive module (D) Temperature raise .. 50
Fig. 5.12 (A) Output ripple (B) IOUT = 200 mA (C) Load regulation ... 50
Fig. 5.13 (A) Electrical structure of the 16-channel amplifier (B) Schematic of the DDA ... 52
Fig. 5.14 Schematic of the 2nd and 3rd stages which serve as programmable gain and filter ... 53
Fig. 5.15 (A) Microphotograph (B) Frequency response (C) Noise (D) Comparison ... 54
Fig. 5.16 Human EEG recording is obtained from on occipital region ... 54
Fig. 5.17 16-channel recording ... 55
Fig. 5.18 System block diagram of the chip-on-Broad level integrated microsystem ... 56
Fig. 5.19 (A) Control flow of the MCU (B) Data timing and packaging method ... 56
List of Tables
Table 2.1 Correlation performance comparison between MDE and wet electrodes ... 16
Table 4.1 Comparison of 3D microprobe arrays with some major design parameters ... 31
Table 5.1 Load/Line Regulation Test Result ... 48
Table 5.2 Summary of LDO Regulator performance ... 49
Table 5.3 Measured Load regulation of the system ... 51
Table 5.4 Measured performance of the proposed neural amplifier ... 55
Chapter 1
Introduction
1.1 Biopotential Signals in Brain
Many organs in the human body, such as the heart, brain, muscles, and eyes, manifest their function through electric activity. The heart, for example, produces a signal called the electrocardiogram (ECG). The brain produces a signal called an electroencephalogram or EEG. The contraction and relaxation activity of muscles produces an electromyogram (EMG). Eye movement results in a signal called an electrooculogram (EOG), and the retina within the eyes produces the electroretinogram (ERG). Measurements of these and other electric signals from the body can provide vital clues as to normal or pathological functions of the organs. For example, abnormal heart beats or arrhythmias can be readily diagnosed from an ECG. Neurologists interpret EEG signals to identify epileptic seizure events. EMG signals can be helpful in assessing muscle function as well as neuromuscular disorders. EOG signals are used in the diagnosis of disorders of eye movement and balance disorders [1]. Examples of human biopotential waveforms are shown in Fig. 1.1 [1].
The origins of these biopotentials can be traced to the electric activity at the cellular level [2]. The electric potential across a cell membrane is the result of different ionic concentrations that exist inside and outside the cell. The electrochemical concentration gradient across a semi-permeable membrane results in the Nernst potential. The cell membrane separates high concentrations of potassium ion and low concentrations of sodium ions (along with other ions such as calcium in less significant proportions) inside a cell and just the opposite outside a cell. This difference in ionic concentration across the cell membrane produces the resting potential [3]. Some of the cells in the body are excitable and produce what is called an action potential, which results from a rapid flux of ions across the cell membrane in response to an electric stimulation or transient change in the electric gradient of the cell [4]. The electric excitation of cells generates currents in the surrounding volume conductor manifesting itself as potentials in the body.
Fig. 1.2 illustrates the biopotentials in brain [5]. Different signals are acquired depend on the recording methodology and location. The neural spikes, which are known as nerve impulses or action potentials, are produced by single unit firings. The temporal sequence of action potentials emitted by a neuron is called its spike train. The neural spikes are recorded
Fig. 1.1 Waveforms of the biopotentials: (a) ECG (b) EEG (c) EMG (d) EOG [1]
via microelectrodes or probes placed close to the neuron cell body. Local field potential (LFP), or near-field potential, is a particular class of electrophysiological signals, which is dominated by the electrical current flowing from all nearby synaptic activity within a volume of tissue. The signal is produced by the summed synaptic current flowing across the resistance of the local extracellular space. The electrical potential or voltage is recorded with a very small electrode embedded within neuronal tissue, typically in the brain of an anesthetized animal or in-vitro within a slice of brain tissue maintained [6]. Briefly speaking, the LPF is the summation of pre/post-synaptic activity from a population of neurons recorded the electrode tip.
Electrocorticography (ECoG) is the electrical activity on the cortical surface resulted from volume conduction of coherent collective neural activity throughout cortex. ECoG is recorded via electrodes placed directly on the exposed surface of the brain to record electrical activity from the cerebral cortex. ECoG may be performed either in the operating room during surgery (intra-operative ECoG) or outside of surgery (extra-operative ECoG). Because a craniotomy (a surgical incision into the skull) is required to implant the electrode grid, ECoG is an invasive procedure [4].
EEG is the electrical activity on the scalp resulted from volume conduction of coherent collective neural activity through the brain and skull, and laterally along the scalp. The recording of EEG along the scalp can be seen as producing by the firing of neurons within the brain [7]. In clinical contexts, EEG refers to the recording of the brain's spontaneous electrical activity over a period of time, as recorded from multiple electrodes placed on the scalp. In neurology, the main diagnostic application of EEG is in the case of epilepsy, as epileptic activity can create clear abnormalities on a standard EEG study [8]. Fig. 1.3 detailed the recording electrode placements for different recording proposes.
Fast Sl ow Mac ro Mi cro Fast Sl ow Mac ro Mi cro
Fig. 1.2 Biopotentials in brain [5]
skin skull dura brain
EEG Recording EcoG Recording Near field RecordingExtracellular/
Non-invasive/
semi-invasive Invasive Invasive
skin skull dura brain
EEG Recording EcoG Recording Near field RecordingExtracellular/
Non-invasive/
semi-invasive Invasive Invasive Fig. 1.3 Brain electrical activity recording
From the scale point of view, EEG provides low resolution information of the brain activity but benefits by non-invasive recording requirement with smaller magnitude and behaves in low frequency band. The Derivatives of the EEG technique includes evoked potentials (EP) and Event-related potentials (ERPs), which involves averaging EEG activity time-locked to the presentation of stimuli in cognitive psycho-physiological researches [7]. In the other hand, neural spike recordings provide detailed information in a localized area or specified neuron unit. In processing neural spike signals, spike sorting is a critical step in neuroscience research. When an electrode is inserted into the brain for neural recording, it typically detects signals from multiple different neurons. Each neuron exhibits spikes with distinct characteristics, such as amplitude and shape. Spike sorting is the process of using these characteristics to determine which neuron contributed a given spike. This critical step in the neural processing stream decodes patient’s intentions for neuroprosthesis applications [9].
1.2 Preview of Neural Recording Sensors and Systems
a promising path to revolutionary progress in understanding neural functions and to the realization of practical neural prostheses. Also, long-tem, real-time and stable observation on the monitoring target for treating disorders such as epilepsy, seizures as well as for rehabilitative prosthesis is required for these biomedical device designs. Such biomedical device usually includes two main parts, the sensors and the systems. The former collects the biopotentials from the target volume of tissue, while the latter provides signal conditioning, processing and transmission. Miniaturized, light-weight, wireless implantable bio-sensors and microsystems are the key solution to capture accurate biological signals from an untethered subject in his natural habitat.
Many neuroscience techniques have been reported to study the functional relationships in the brain. In addition to the brain imaging techniques such as functional magnetic resonance imaging (fMRI) and positron emission tomography (PET), electrical recording techniques play an important role in brain functionality mapping as well. For example, electrocorticography recorded with intracranial electrodes onto dura surface and local-field potentials using penetrated probes or non-penetrating grid electrodes, are clinically applied methods to record the electrical activity in the brain. Penetrated electrode probes in brain may cause the risk of damaging the brain tissue but benefits from precise signal location, while the flexible grid electrode arrays placed on the cortical surface can be used as a less invasive method in some clinical cases, e.g. in epilepsy surgery. Therefore, different sensors are chosen for the application conditions requirements.
To date, many types of sensor/microsystem manufacture technology for neural sensing are reported. Versatile microprobe arrays are fabricated by bulk silicon, polymer or assembly structure for biopotential sensory and implantable microsystems. For the silicon bulk etched arrays, one of the disadvantages is every probe in array only functions as one recording site [10]. Also when the array was integrated with active circuit boards [11], the minimal opening for implantation is relatively huge. Polymer-based sensors usually are used as planar or grid electrode arrays [12]. The flexible property of polymer makes it easier to fit the shape of the implant tissue. Some fully integrated microsystems for implantation application have been reported, such as blood pressure monitoring [13] and single unit recording [14]. However, disadvantages still exist, such as low channel account and bulky sensor array designs.
1.3 Motivation for sensor and system development.
Prior art shows demands for new fabrication technology in sensors design and integrated system for advanced neural recording, including smaller size, improved performance, convenient usage and integration probabilities. For example, standard electrodes in EEG recording are known as its disadvantage that using electrolytic gel. Also, for ECoG and extracellular measurement, new material, structure and assembly advancements are needed
for superior recording performance. Furthermore, electronics for the amplification, conditioning and transmission are required to achieve fully integrated sensing environment. Therefore, sensors fabricated by Micro Electro-Mechanical Systems (MEMS) technique are utilized in this dissertation, as well as the Integrated Circuits (ICs) design for analog biopotential processing and powering issues in the neural sensing microsystem. Such system is demanded to deal with every kind of neural signals that recording by the MEMS based sensors in brain.
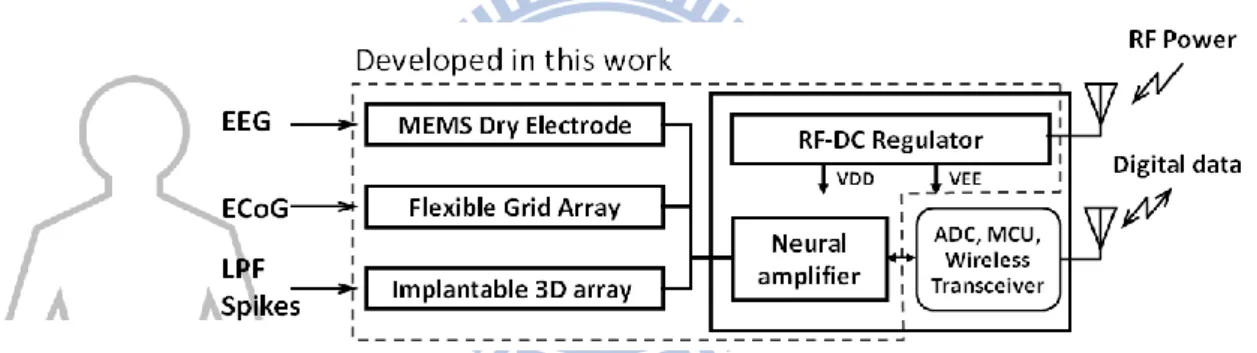
In this work, versatile neural sensors associated with powering/amplification bioelectronics are presented for implantable microsystem design. Proposed system structure is shown in Fig. 1.4. MEMS dry electrode (MDE), Grid electrode array and 3D neural array are developed for EEG, ECoG, LPF and neural spike acquisition. Bioelectronics including neural amplifier and RF-DC regulator are designed for wireless powering and signal conditioning purposes. Electrode arrays sense and transfer the neural signals from the target tissue to the neural amplifier for signal conditioning and amplification. The developed components can be integrated with commercial chips for a conceptual representation toward microsystem in the thesis.
Fig. 1.4 Proposed neural sensors and microsystems in this thesis. The dotted area denotes the devices that developed in this work.
1.4 Organization of Dissertation Work
This dissertation is organized as follows. Chapter 1 provides the introductions and motivations as well as the background on this research. A microsystem structure consists of versatile neural sensors associated with powering and signal conditioning electronics for neuroprosthesis applications is described. Detailed designs and results for the sensors and electrical systems are reported in the following chapters. Chapter 2 introduces a series of surface-mounted MEMS dry electrode (MDE) development for EEG, drowsiness and photo dynamic therapy (PDT) applications. Functions including low interface impedance, self-stability and transparent light guide are detailed in this chapter. Chapter 3 presents a flexible gird electrode array made by polymer for ECoG measurements; related device fabrication and characterization are investigated in this chapter. Chapter 4 reports a new stacking method for assembling a 3D microprobe array with great structure strength,
smaller implantable opening and simple assembly steps. Proposed method also provides design flexibility and volume usage efficiency. 3D neural signal propagation observation for human cerebral cortex layers is achieved by practical implantation in excised brain tissue after resection surgery in this study, which achieves the mapping and observation of the neural signal network among the target brain structure. Chapter 5 illustrates the integrated electronics toward microsystem. Miniaturized spiral coils as a wireless power module with low-dropout regulator circuit is developed to convert RF signal into DC voltage for batteryless implantation. 16-channel analog-front-end neural amplifier is also introduced, offering technical merits of sufficient low power and reasonable low noise performance. An integrated microsystem using the fabricated neural amplifier associated with commercial micro control unit and wireless transceiver module are described as well. Chapter 6 draws the conclusions in this work and provides possible future directions for further research.
Chapter 2
Skin Surface-Mounted MEMS Dry Electrode
2.1 Biopotential Electrode for Electroencephalography Recording
EEG signals consist of the differences in electrical potentials caused by summed postsynaptic graded potentials from pyramidal cells that create electrical dipoles between the soma (body of neuron) and apical dendrites (neural branches) [15]. The EEG is typically described in terms of rhythmic activity, which is divided into bands by frequency. For example, these frequency bands are a matter of nomenclature i.e. rhythmic activity between 8–12 Hz is described as alpha wave. Also, rhythmic activity within a certain frequency range was noted to have a certain distribution over the scalp or a certain biological significance [15]. Frequency bands are usually extracted using spectral methods as implemented by EEG software. Biopotential electrodes for EEG recording transfer signals from skin tissue to the amplifier circuit. When the electrodes placed onto the skin, say surface-mounted electrode, actually act as a voltage divider with the amplifier input resistance for signal transportation. Therefore, the most important characteristic of a biopotential electrode is low electrode-skin interface impedance so that signals can be propagated without attenuation or production of noise [16].
In this chapter, various types of MEMS-based dry electrodes (MDE) are presented for different purpose. Silicon-based MDE fabricated via micromachining technology is proposed for high-fidelity EEG sensor with low electrode-skin interface impedance. Diamond-shaped MDE (DS-MDE) provides extra self-stability onto skin during measurement. Finally, a transparent MDE fabricated by advanced hot-embossing process is illustrated for photodynamic therapy application in this chapter as well.
2.2 MEMS Dry Electrode
When electrodes are placed on the skin of the forehead, an electrode-skin interface is constructed. The anatomy of the skin consists of three different layers: the epidermis, the dermis, and the subcutaneous layer. The epidermis contains two further layers: the stratum corneum (SC) and the stratum germinativum (SG). The SC consists of dead cells and thus has electrical isolation characteristics. The SG is composed of living cells and is therefore
electrically conductive. Blood vessels and nerves are located in the dermis [17].
To overcome the electrical isolation properties of the SC, standard wet electrodes always require that the skin is prepared (abrasion of the SC) and an electrolytic gel is used. Improper skin preparation may cause skin irritation, pain, or even infection. Using electrolytic gel is uncomfortable and inconvenient; it can cause an itchy feeling, and sometimes makes skin red and swollen when EEG measurements are made over a long period of time. Furthermore, the conductivity of gel gradually decreases because it hardens, resulting in degradation in the quality of data acquisition.
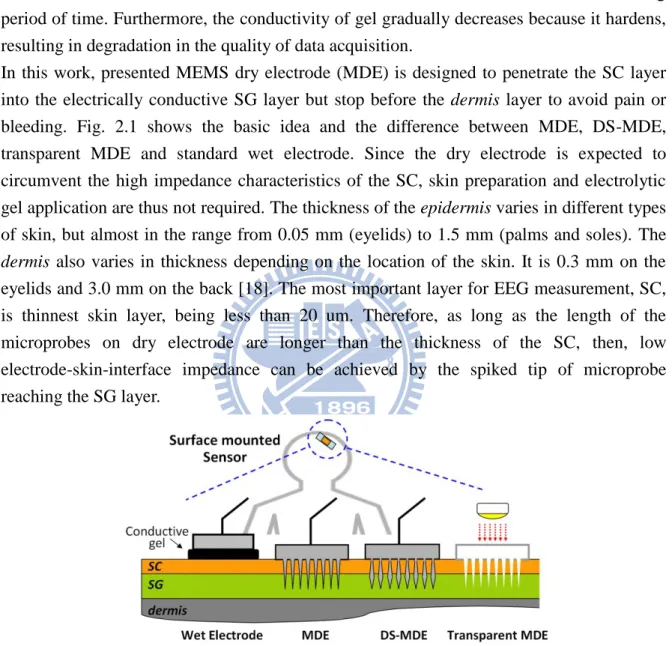
In this work, presented MEMS dry electrode (MDE) is designed to penetrate the SC layer into the electrically conductive SG layer but stop before the dermis layer to avoid pain or bleeding. Fig. 2.1 shows the basic idea and the difference between MDE, DS-MDE, transparent MDE and standard wet electrode. Since the dry electrode is expected to circumvent the high impedance characteristics of the SC, skin preparation and electrolytic gel application are thus not required. The thickness of the epidermis varies in different types of skin, but almost in the range from 0.05 mm (eyelids) to 1.5 mm (palms and soles). The dermis also varies in thickness depending on the location of the skin. It is 0.3 mm on the eyelids and 3.0 mm on the back [18]. The most important layer for EEG measurement, SC, is thinnest skin layer, being less than 20 um. Therefore, as long as the length of the microprobes on dry electrode are longer than the thickness of the SC, then, low electrode-skin-interface impedance can be achieved by the spiked tip of microprobe reaching the SG layer.
Fig. 2.1 Implementation diagram of applying standard wet electrode, MDE and DS-MDE onto skin surface
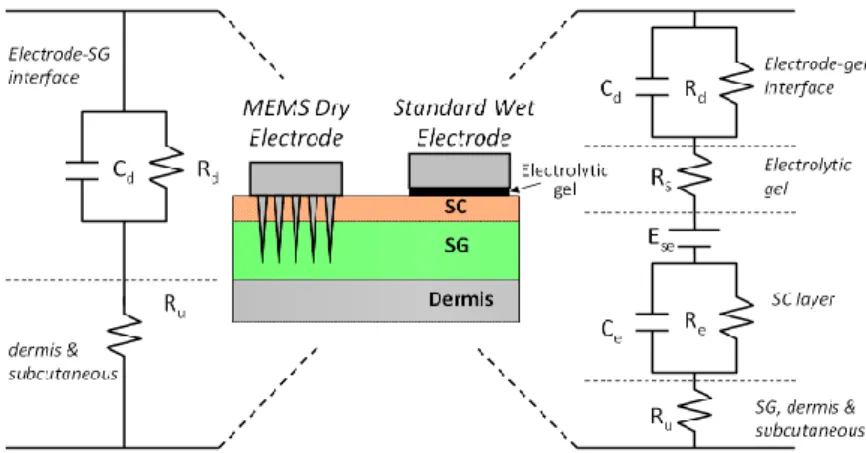
The relating electrode-skin interface cross section sketch and the related electrode-skin-interface equivalent circuit are illustrated in Fig. 2.2. The model for the standard electrode includes a capacitance Cd and a resistor Rd at the electrochemical
electrode–electrolyte interface of the standard electrode and the electrolytic gel. The resistor RS reflects the electrical resistivity of the electrolytic gel. The SC can be considered to be a
membrane (e.g., the ion concentration of the electrolytic gel and the ion concentration of the SG do not match perfectly), there is a potential difference Ese. Furthermore, the electrolytic
gel soaked SC shows distinctive resistive and capacitive behavior, represented by Ce and Re.
Finally, Ru is the resistivity of the SG and underlying tissue. The model of the dry spiked
electrode is less complex. The conductive metal coating of the spikes is in direct contact with the SG, hence, an electrode–electrolyte interface, Cd and Rd, is created. Rm is the
resistivity of the SG and underlying tissue [19].
Fig. 2.2 Electrode-skin interface comparison between spiked dry and electrode standard wet electrode.
2.3 Diamond-Shaped MDE
The MDE designs [20] use electrically conductive microprobe to penetrate the high electrically resistive outer skin layer to obtain better electrical conductivity than wet electrodes. However, the conical shape microprobe array lacks the position stabilization capability. This limitation is due to the force created by the compressed skin tissue that continually counteracts the conical shape microprobes into outward direction and degrades the bio-signal recording quality directly. To overcome this drawback, a self-stabilized, DS-MDE is developed. The proposed diamond-like design has a wider neck and a narrower bottom than previous conical shape dry electrodes. This configuration provides an external force to stabilize the probe that can remain in the skin when the tissue counteracts the probe continually. In contrast with a related work [21] which also demonstrates the mechanical attachment capability of a body surface electrode, the proposed DS-MDE without sharp barded edges does not damage the skin tissue after removing the electrodes from skin. The DS-MDE can thus provide satisfying self-stability capability and superior electric conductivity when attached onto skin without additional tissue injury.
Fig. 2.3 (A) illustrates the forces applied on the probe after the DS-MDE was placed onto skin tissue. Fb and Fp, caused by the compressed tissue, are the normal force applied on the
face of tip and the face of shaft. Fr is the resultant force of |Fb + Fp| with direction towards
minimal force that required for dragging out the probe from skin tissue. Clearly, the minimal Fs for dragging out the probe is
c v
r
s F F F
F (2-1) Since that Fc and Fv are small, difficult to estimate and always help the probe to stay in the
tissue when the probes are dragging out of the tissue, they are ignored in the simulation. To quantitatively determine the improved self-stability of the presented DS-MDE comparing with MDE, stability factor (SF) is simply defined as the Fr, the resultant force of |Fb + Fp|. It
is clear that if Fr can provide an inward force into the tissue, the stability of the probe can be
improved.
The force Fb and Fp are positively proportional to the compressed tissue volume, which can
be calculated from the dimension of probe (a, b, c and d) illustrated in the force diagram. Thus, the resultant force Fr is calculated from the angle relationship in the force diagram.
For the general MDE, its vertical shaft wall (a = b) and conical tip result in a Fr with
outward direction from the tissue which can not help the probe stay in the skin. Comparing with the MDE, DS-MDE with an invert-triangle shaft wall makes the resultant of Fb with
the direction towards into the tissue, which helps the probe stay in the skin.
The calculated result indicates that the narrower the bottom width a, the higher stability can be achieved. Simulation result is shown in Fig. 2.3 (B).Note that with tip length and neck diameter are 50μm, SF reaches the maximum value if the bottom diameter is less than 30μm and shaft length is longer than 150μm. As a result, a stable probe configuration with 250μm probe length has been designed to reach the SG layer.
Fig. 2.3 Stability modeling
2.3 Fabrication and Characterization
The fabrication process of MDE and DS-MDE is illustrated as Fig. 2.4. The microfabrication process consisting of ion-etching with inductive coupled plasma (RIE-ICP) etching process and sputtering metallization technology was developed. In this process, a 6μm thick photoresist film was patterned as circular hard-mask for the isotropic etching process to produce the probe tip. Next, we proceeded with the anisotropic etching process to
form the probe shaft with high aspect ratio. According to the etching parameter control, different style of shafts including cylindrically shaped and inverted-triangle shaped are fabricated for MDE and DS-MDE, respectively. Then, the hard mask at the probe tip was released by sulfuric acid wet-etching. Finally, the probes were subsequently coated with titanium and platinum using sputtering technique to achieve electrical conductivity and bio-compatibility.
Fig. 2.4 Fabrication process flow
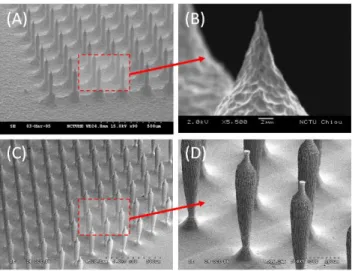
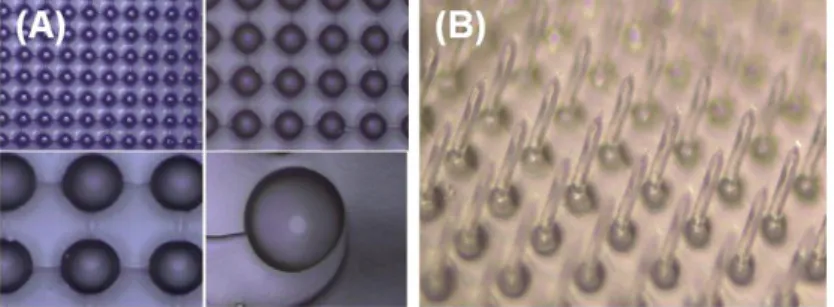
Fig. 2.5 shows the microphotograph of the fabricated results: (a) microprobe array of MDE, (b) tip of the microprobe, (c) inverted-triangle shaped microprobe array of DS-MDE, (d) close view of the DS-MDE. The fabricated MDE and DS-MDE are 20×20 array in 4×4 cm2 with 250μm in probe height. The MDE is 30μm probe width, while the DS-MDE is 50μm and 17μm in neck and bottom width, respectively. Notably, the peak of the probes on the DS-MDE are not perfectly sharp (< 10 μm) but tiny enough to penetrate the outer skin layer.
Fig. 2.5 Fabrication results
To characterize the electrode-skin interface impedance effect, two electrodes were lined up on the forehead with a distance of 4 cm apart to perform an electrode-skin-electrode interface (ESEI) experiments. The ESEI acts as two electrode-skin interface in series. Therefore, lower ESEI performance implies lower electrode-skin impedance. A circuit [19]
was used to determine the ESEI impedance and reduce the risk of harming the test person during biopotential recordings [22]. A total of 19 tests were performed, involving 5 subjects to evaluate the performance of different types of electrode. According to Fig. 2.6, in the interest frequency range for EEG (0.5~100 Hz), MDE shows much smaller impedance performance then standard wet electrodes under condition without skin preparation (use of gel, abrasion of the SC). Experiment results demonstrate that the impedance of presented MDE was superior to that of the wet electrodes.
Fig. 2.6 Electrode-skin interface impedance characterization
A recording example of the MDE and standard wet electrode is shown in Fig. 2.7. The recorded EEG signal (α rhythm, 8-12Hz, seen in normal relaxed adults) with the peak-to-peak magnitude of approximate 0.5V and 0.95V for MDE and wet electrode. Note that both wet electrode and MDE are placed at the neighboring location with identical amplifier circuit. The relationship of electrode/skin interface impedance and the signal intensity proved the advantage of the MDE design.
Fig. 2.7 Recording example of alpha rhythm by MDE and standard wet electrode
To compare the EEG signals acquired by MDE and standard wet electrodes, five MDE/wet electrode pairs are placed at the frontal of head. The MDE/wet electrode pair 1 and 5 is placed at Fp1 and Fp2 according to the international 10-20 electrode placement system [1].
Three more electrode pairs are also evenly placed between pair 1 and 5 labeled as MDE/wet electrode pair 2, 3, and 4, respectively. The distance between MDE and wet electrode in the MDE/wet electrode pair is about 1 cm. We used the average EEG signals at A1 and A2 as the reference. EEG signals at MDE and wet electrodes were then simultaneously recorded by the Scan NuAmps Express system (Compumedics Ltd., VIC, Australia). Before data acquisition, the contact impedance between each dry and wet electrode was calibrated to be less than 5 kΩ. The EEG data were recorded with a 16-bit quantization level at a sampling rate of 500 Hz and then re-sampled down to 250 Hz to simplify data processing. Each amplifier circuit channel had a differential-input instrumentation amplifier as the first amplifier stage, followed by a 0.5–100 Hz band pass filter and a 60 Hz notch filter.
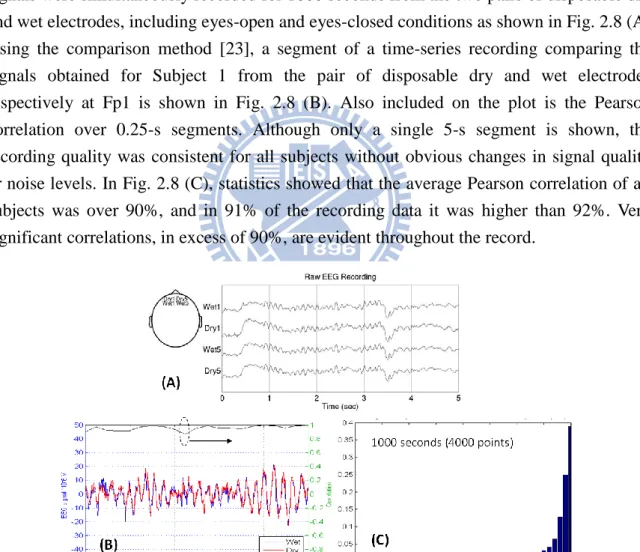
We recruited three volunteers to take part in the experiment. In each experiment, the EEG signals were simultaneously recorded for 1000 seconds from the two pairs of disposable dry and wet electrodes, including eyes-open and eyes-closed conditions as shown in Fig. 2.8 (A). Using the comparison method [23], a segment of a time-series recording comparing the signals obtained for Subject 1 from the pair of disposable dry and wet electrodes respectively at Fp1 is shown in Fig. 2.8 (B). Also included on the plot is the Pearson correlation over 0.25-s segments. Although only a single 5-s segment is shown, the recording quality was consistent for all subjects without obvious changes in signal quality or noise levels. In Fig. 2.8 (C), statistics showed that the average Pearson correlation of all subjects was over 90%, and in 91% of the recording data it was higher than 92%. Very significant correlations, in excess of 90%, are evident throughout the record.
Fig. 2.8 (A) Simultaneously EEG recording from MDE and wet electrode (B) 5-s segment comparison of EEG signals. Upper line shows the Pearson correlation data calculated using
0.25-s segments. (C) Statistics analysis of the average correlation for all subjects.
(MTS Corp., USA). MDE and DS-MDE with same area (4x4 mm2), each consists of 20x20 micro probe array, are gluing to a PMMA holder for the pulling force test. A pig skin fixed on another PMMA plate was used for the test tissue. The DS-MDE was pressed into the pig skin tissue under testing by the holder beam of the force testing system. The force with which the DS-MDE was pressed into the tissue was not measured. After ensuring the micro probes penetrated the test tissue, the micro force testing system started to pull off the DS-MDE. During testing, the applied force and displacement were recorded. Fig. 2.9 shows the testing results. The average required pulling force for the general MDE and DS-MDE were 1.705N and 3.160N, respectively. Notably, both MDE and DS-MDE had the same chip area, number of probes and probe length.
In contrast with prior art, proposed DS-MDE without sharp barded edges does not damage the tissue after removing from skin. The DS-MDE can thus provide satisfying self-stability capability and superior electric conductivity without additional tissue injury.
Fig. 2.9 Pulling test result. The average required force for the general MDE and DS-MDE were 1.705N and 3.160N, respectively.
2.4 Drowsiness Monitoring with MDE
In order to demonstrate the potential applications of the MDE sensors during long and routine recording in operational environments, the drowsiness monitoring was investigated according to the EEG signals recorded by proposed MDE placed at Fp1 and Fp2 in an attention-demanding driving experiment. Preventing accidents caused by drowsiness is greatly desirable but requires techniques of continuously monitoring drivers’ drowsiness levels and delivering effective feedback to avoid dangerous situations at the wheel [24]. An EEG-based drowsiness estimation system that continuously estimates drivers’ drowsiness levels in a virtual-reality (VR) based driving simulator is used here [25]. The VR based highway-driving environment provides the study of drivers’ cognitive change during a long-term driving. Also, a lane-keeping driving error experiment is defined as the drowsiness level used to verify the estimated drowsiness level produced by the EEG power
spectrum analysis. The power spectrum level of theta wave and alpha wave defined the drowsiness index as shown in Fig. 2.10. During the period of increasing drowsiness but when subjects are still responding, delta and theta power increased, whereas alpha decreased [26]. Therefore, the drowsiness monitoring by MDE can be achieved by combining the EEG spectrum analysis and VR based driving error.
Fig. 2.10 Drowsiness level detection by EEG power spectrum observation
The EEG signals recorded by five MDE sensors are fed into an EEG-based drowsiness estimation system to indirectly estimate the driving drowsiness levels. The recorded driving performance time series were smoothed using a causal 90-s square moving-averaged filter [27] advancing at 2-s steps to eliminate variance at cycle lengths shorter than 1–2 min, since the fluctuations in drowsiness levels had a cycle length over 4 min [28]. The EEG data recorded by five MDE are first preprocessed using a simple low-pass filter with a cut-off frequency of 50 Hz to remove the line noise and other high-frequency noise. After moving-average power spectral analysis, we obtained EEG log power spectrum in time-series from the EEG sensors, with a frequency range from 1 to 40 Hz [29]. Then, Karhunen-Loeve Principal Component Analysis (PCA) is applied to the resultant EEG log spectrum to extract the directions of the largest variance for each session. Projections (PCA components) of the EEG log spectral data on the subspace formed by the eigenvectors corresponding to the largest 50 eigenvalues are used as inputs to a multiple linear regression model [30] to estimate the time course of driving errors for each subject. Each model is trained only using the features extracted from the training session and tested on a separate testing session.
Fig. 2.11 shows the performance comparison of drowsiness estimation either using MDE sensors or standard wet electrodes. As illustrated in the figure, the blue line and red line represent the driving errors acquired by VR system and estimated by EEG, respectively. Fig. 2.11(A) shows the estimated driving error correlation of Subject 1 in Session 2 by using EEG recorded from the wet electrodes, where the estimators are trained from Session 1. Conversely, Fig. 2.11 (B) shows the estimated driving error of Subject 1 using EEG data
from wet electrodes, where Session 2 acts as training dataset and Session acts as testing session. Also, Fig. 2.11 (C) and (D) show the estimated and actual errors made by Subject 2. Similarly, Fig. 2.11 (E), (F), (G) and (H) display the estimated driving error correlation made by MDE sensors with varied training session and testing session.
Fig. 2.11 EEG estimated (red line) and actual VR driving error (blue). (A)-(D): Estimated by standard wet electrodes (E)-(H) Estimated by MDE sensors
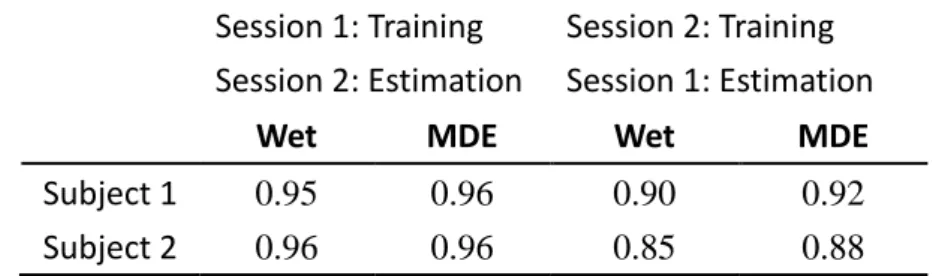
Table 1 shows the comparison of the correlation coefficients between the actual and estimated driving error time series using MDE and wet electrodes. As shown in Fig. 2.11 and Table 1, the estimated driving errors result using only Fp1 and Fp2 consistent with previous report s that using whole-head 32-channel EEG [31] and show its capability for driving tasks examination. The results demonstrate the feasibility of estimating subject drowsiness levels in an accurate manner based on EEG signals collected from the frontal hairless sites. Furthermore, the estimation accuracy based on the EEG collected by MDE is comparable to that based on the signals collected by conventional wet electrodes, indicating the feasibility of using MDE to acquire EEG signals without the need for skin preparation in operational environments.
Table 2.1 Correlation performance comparison between MDE and wet electrodes Session 1: Training
Session 2: Estimation
Session 2: Training Session 1: Estimation
Wet MDE Wet MDE
Subject 1 0.95 0.96 0.90 0.92 Subject 2 0.96 0.96 0.85 0.88
2.5 Transparent MDE for Photodynamic Therapy Application
Photodynamic therapy (PDT) is administered to treat malignant tumors [32], various skin disorders [33], wound infections [34], and other diseases, as well as for cosmetic purposes in skin rejuvenation [33]. Treatment involves a photosensitizing agent, in which a visible light is irradiated to either terminate cancerous cells or cure precancerous cells instead of surgery [35]. Efficacy of PDT heavily relies on the photosensitizing agent, light, and oxygen. Physicians medicate patients and apply the photosensitizing agent on the affect part of the patient body and, then, illuminate the affected parts of a patients’ body with various wavelengths of light, depending on the disease. When the photosensitizing agent is treated by light with a special wavelength, a reactive oxygen species is produced, subsequently damaging bio molecules and terminating cells [36]. Although this noninvasive and painless therapy distinguishes itself from traditional surgery, the non-uniform spatial distribution of the photochemical dose is a major limitation [37]. Tissues of the human body vary in light absorption, subsequently incurring a non-uniform light dose when irradiating the treated spot upon the affected part of skin. Additionally, the layers of skin located close to a light source receive too high of a photochemical dose, negatively affecting the human body [37]. MEMS-based dry electrode (MDE) with micro-needle array has received consideration in biomedical applications recently, especially in drug delivery [38] and physiological signal sensing. In micro drug delivery system, drug is injected through hollow needle structure into patient’s tissue. The microstructure design allows the needle array pricked onto patient’s skin without uncomfortable feeling. In physiological signal sensing system, micro needle array provides lower impedance and enhance the sensing system performance [20] [39]. In this work, an alternative application in optical biomedical engineering is presented by using transparent MDE. Additionally, MDE is manufactured with deep reactive ion beam etching, thick-film lithography and electroforming techniques for the shafts and tips; all-silicon fabrication process is prohibitively expensive.
This work describes a relatively low cost, easy fabrication method, which combined two-phase process for disposable transparent MDE manufacture. Therefore, the expensive ICP process was used only one time for the first MDE mold. Then, hot-embossing technique was applied to duplicate the silicon MDE into transparent micro-needle arrays. The material of duplicated micro-needle array can be polyimide (PI) or polymethylmethacrylate (PMMA), which has better light propagation capability than glass and relative low cost comparing with silicon. Furthermore, the duplication process could be repeated at least 120 times with guaranteed hot-embossing result. Carefully designed transparent MDE can avoid pain and bleeding but achieves superior light transmission efficiency. For photodynamic therapy applications, this design can significantly reduce the required irradiation power and therefore avoid additional damage to surrounding skin tissue. Practical in-vivo light
transmission experiment with two different density transparent MDE designs demonstrates the improved power transmission efficiency (PTE) of the two types of arrays is 1.41 and 1.71 times better than the condition without using transparent MDE.
Human skin structure is a layered composition, as described in section 2.2. The scattering coefficient of the epidermis is approximately half that of the dermis [40]. When treatment involves light irradiating with wavelength, such as a low power laser on the human skin, the skin reflects, scatters and absorbs the light simultaneously. Each layer of skin layer differs from light absorption. The propagation result of the incident light depends on the absorption of the skin. Also, when a specified intensity of received light power is required in PDT applications, high scattering and reflection could result in not only high power consumption but also extra damage to the other tissue surrounding the curing target. The Lambert–Beer law offers a simplified model of light propagation in the human skin, as shown in Fig. 2.12. When an incident light with interrogating energy I0 illuminates into the human skin, the
relationship between incident light power I0 and the attenuated light power I can be
expressed as [41]:
aLC
I
L
I
(
)
010
(2-2)Fig. 2.12 Light propagation in skin: direct illumination or through transparent MDE
Where L represents the penetrating depth of light in the human skin, a denotes the equivalent absorption coefficient of all skin, and C denotes the concentration of the absorbing substance. When the transparent MDE is placed onto skin and penetrated though the SC layer into SG layer, as shown in Fig. 2.12, most of the incident light can be transferred into SG layer through the needle shaft, thus, the reflection and absorption of SC and SG layer could be reduced. Also, the penetrating depth of light is reduced from L to L’. Therefore, by using the proposed transparent MDE, the required target depth with required light power intensity could be achieved by lower interrogating energy.
The fabrication flow can be separated into two phase. The first phase is the fabrication of silicon MDE mold, which has been illustrated in previous sections. The second phase is the
repeated-and-repeated duplication process using hot-embossing technique. Fig. 2.13 illustrates the second phase fabrication process. First, polydimethylsiloxane (PDMS) was selected and spun onto Si substrate as the molding layer with curing at 90ºC. Then, the silicon mold fabricated in the first fabrication phase was pressed into PDMS to form the second mold with hole-array. After well-controlled temperature recipe, the silicon array mold was removed from the PDMS mold. Notably, base on the well-controlled stated parameters including curing time and temperature, the released process is relatively easy without using any additional execution such as O2 plasma treatment which is used in previous works. And then, polymer material PMMA was injected into the PDMS mold to form the transparent needle array. Finally, the successfully performed transparent MDE was released from the PDMS mold and diced for further experiments. Fig. 2.14 shows the optical microscope photograph of transparent MDE.
Fig. 2.13 The hot embossing process to manufacture transparent polymer based MDE
Fig. 2.14 The optical microscope photograph of transparent MDE. (A) Imprinted PDMS holes (B) PI based MDE
Fig. 2.15 (A) shows the light transmission experiment setup, which demonstrates the enhanced light transmission efficiency when using transparent MDE as light transmitting media. In this experiment, light source includes a 660nm-wavelength laser diode and
focusing lens was mounted onto finger with 3cm distance between finger and lens. The emitter power is adjusted by a current controller. Below the finger, a light receiver that can receive and measure the transmitted light power was well fitted to the backside of the finger. All experiments are performed in a dark room to eliminate the influence of excess light. To confirm the relationship between the array density and light transmission rate, two types of transparent MDE with the same area (4mm × 4mm) and different array density (needle number : 20 × 20 and 13 × 13) are prepared for test. Each array was tested under the parameter of input laser power from 2mW to 10mW with an interval of 2mW.
Fig. 2.15 (B) summarized the measurement results, where the black, blue and red lines indicate the received light power via skin, skin with rare-density array and skin with dense-density array, respectively. The results reveals that under the same LED power, the transparent micro-needle array can significantly enhance the propagation efficiency.
Fig. 2.15 (A) Light transmission experiment setup (B) Experiment results of input and received light intensity versus via transparent MDE with different array density
According to the experimental result, the improved PTE of dense density needle array and rare needle array are 1.41 and 1.71 times better than the condition without using transparent MDE. Note that the laser spot size on the array is about 3.5mm in diameter. In the same spotted area, the difference of received power between rare and dense density arrays comes from the different area ratio of needle part. Consider the PTE result of the rare-density array in Fig. 2.15, the area proportion of the needle part and non-needle part in the spotted area, the calculated PTE of needle part is 25 times larger than the flat part of array. By applied this result back into the calculation of the PTE of dense-density array, the calculated PTE of dense-density array is about 1.89 times better than the condition without using transparent MDE, which is very close to our measured result (1.71).
2.6 Summary
experiments demonstrate its superior low electrode-skin interface impedance property without using any skin preparation. Next, a DS-MDE is also developed for better self-stabilized capability when being applied onto skin tissue. Practical application of drowsiness level monitoring in driving tasks shows reliable feasibility and competitiveness in driving error estimation examination comparing with standard wet electrodes. An alternative approach, transparent MDE, in photodynamic therapy application is realized by utilizing advanced hot-embossing method. The duplicated polymer-based micro-needle array can significantly reduce the required irradiation power and therefore avoid additional damage to surrounding skin tissue.
Chapter 3
Flexible Brain Surface Grid Electrode Array
3.1 Electrocorticography in Brain
Many neuroscience techniques have been used to study the functional relationships in the brain. In addition to the brain imaging techniques such as fMRI and PET, electrical recording techniques play an important role in brain mapping as well. ECoG recorded with non-penetrating grid electrodes are now one of a clinically applied methods to record the electrical activity in the brain. Comparing with the penetrating electrode probes, grid electrode arrays placed on the cortical surface can be used as a less invasive method in some clinical cases, e.g. in epilepsy surgery [42].
ECoG signals are composed of synchronized postsynaptic potentials (local field potentials), recorded directly from the exposed surface of the cortex. The potentials occur primarily in cortical pyramidal cells, and thus must be conducted through several layers of the cerebral cortex, cerebrospinal fluid (CSF), pia mater, and arachnoid mater before reaching subdural recording electrodes placed just below or on the dura mater (outer cranial membrane). However, to reach the scalp electrodes of EEG, electrical signals must also be conducted through the skull, where potentials rapidly attenuate due to the low conductivity of bone. For this reason, the signal magnitude of ECoG is much higher than EEG [43].
Because of the short distance between electrode and electrical source, neural activities on-set zone localization can be achieved with subdural electrodes, which is a critical imaging advantage for pre-surgical planning. ECoG offers a temporal resolution of approximately 5 ms and a spatial resolution of 1 cm [44]. It has been claimed that the spatial resolution of the present macro-size subdural electrodes usually used in clinic surgery could be substantially improved by using modern micro fabrication techniques [42].
Results in this chapter were co-worked with Yung-Feng Wang in Microsystem Control Laboratory, National Chiao-Tung University.
3.2 Design Criterion
To date, many types of grid electrode arrays have been reported for ECoG recording [45]-[49]. The materials used for electrode array structure include Polyimide, SU-8 and
Silicone, while the contact materials for sensing electrical activity usually are Gold, Platinum and Titanium Nitrite. According to the previous works, existing problems include: (1) Different level of height of the passivation layer and sensing electrode due to the thin-film process, which can affect the recording efficiency. Post processing for electrode may need. (2) Low spatial resolution due to the large electrode size/distance between electrodes. (3) Un-predictable structure distortion due to that the thickness of Polyimide varies after required high curing temperature (200-400ºC).
Additionally, ECoG recording is an invasive process. Damage occurs while implantation, which consists of (1) Mechanical Damage, abrasion between sensor structure and cell tissue in setup. (2) Micromotion between skull and cortex surface, which cause abrasion in long-term implantation. (3) Immunity response cause by the implanted device [50]. Each of the damage described above can activate the glial scar in the neural tissue. The hyperplasias of the glial scar will then cover around the implanted device, provide attenuation property to the electrode and disable the functionality of the electrode eventually.
To overcome the disadvantage of the prior art, design key-point should includes
(a) Great flexibility and softness to reduce the damage while implantation and fit to brain curvature.
(b) Biocompatibility to reduce the immunity response.
(c) Reasonable electrode size and density to enhance spatial resolution (d) Low gap of height between passivation layer and sensing electrode
In this chapter, a flexible grid electrode array is designed and fabricated by parylene-C as substrate with platinum as sensing electrode material. A three-layered array structure is presented, which formed by 10um thick parylene-C, 60nm/350nm Titanium/Platinum and 1um thick parylene-C as substrate, electrode and passivation layer. Small micro-structure thickness allows minimal implantation damage [48]. Benefit to the thin and flexible property, the grid electrode array is expected to perfectly fit the brain surface curvature for electrical activities collection.
Poly-para-xylylene (Parylene) is a macromolecule polymer. Today, over 20 types of Parylene has been developed, but for numerous reasons, only 3 were deemed commercially viable: they are Parylene-C, Parylene-N and Parylene-D. The advantages of the use of parylene as the bulk-material compared with technologies based on the use of other materials such as polyimide [51] and silicon (developed for other purposes) [52] include parylene’s pinhole-free conformality, its low water permeability when compared with polyimide [53], its proven intraocular [54] and United States Pharmacopoeia (USP) Class VI biocompatibility, biostability, low cytotoxicity, its transparency, and its flexibility and mechanical strength (Young’s modulus ~4 GPa) [55].
3.3 Fabrication and Characterization
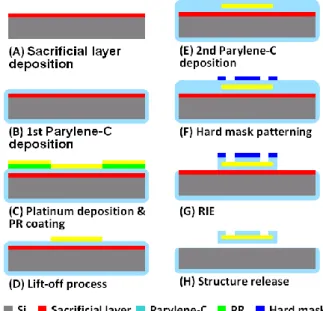
Fig. 3.1 illustrates the proposed fabrication process flow: (A) Sacrificial layer deposition on the substrate. (B) Parylene-C deposition using CVD technique. (C)-(D) Platinum electrode and interconnection wire definition using lift-off technique. (E) 2nd parylene-C deposition. (F) Hard mask patterning for grid electrode array shape define. (G) Dry etching Parylene-C (H) Release structure by washing the sacrificial layer material.
Fig. 3.1 Fabrication process flow of the presented implantable grid electrode array
Fig. 3.2 shows the photographs of the fabricated grid electrode array. (A) Top view. Right hand side denotes the recording area while left hand side of the structure is the bond pad area. (B) Packaged grid electrode array with a one cent coin. (C) Close-view of the recording electrode array. Parylene-C shows its transparent property. (D) The grid electrode array is packaged on a pre-designed PCB with connector (white) to be link to a cable wire for signal transmission. The grid array is 31.2mm in length, 4.3mm in width, and approximately 12um in thickness. Total 16 Platinum electrodes are fabricated with 500um in diameter, 750um in pitch. The width of routing wire is 100um.
To evaluate the impedance performance, the fabricated grid electrode array was characterized in physiologic saline solution (0.9% NaCl) under room temperature. The use of physiologic saline solution is because its electrolytic property is closed to implantation condition. As shown in Fig. 3.3, resulted impedance ranges between 12.6kΩ, -61.4° and 785.36kΩ, -12.32° when the testing input is set as 500mV in amplitude with scanning frequency from 40 Hz to 100 kHz. At 1kHz, test result shows that the impedance is about 1.64k Ohm and phase is -34.95°. Low impedance property induces less signal attenuation during recording therefore suit for the biopotential monitoring [56].
Fig. 3.2 Fabricated grid electrode array Fig. 3.3 Impedance characterization of single electrode
3.4 In-vivo Recording of Auditory Response in Rat
To demonstrate the functionality of fabricated gird electrode array, in-vivo experiment on auditory stimulation response recording is induced. When an authorized rat receives specialized frequency/magnitude sound stimulation, electrical response can be observed on a localized auditory area of cortex. It can be seen as neural activity happens due to the ears receive the sound and transfer into neural signals into brain and appear in auditory sensory brain area. By using the flexible grid electrode array, the interested area of brain is covered and recorded. Therefore, localized electrical response spot could be detected and characterized for functional mapping and event evaluation.
Sprague Dawley rats, aged 10–12 week old and weighting 280–350 g body weight, were used in the experiments. The animals were kept in a room under a 12:12-hr light-dark cycle with food and water provided ad libitum. All surgical and experimental procedures were reviewed and approved by the Animal Ethics Committee of the National Chiao-Tung University. The rats were anesthetized with urethane 2.0 g/kg body-weight (b.w.) intraperitoneal (i.p.). Subsequently, it was placed in a standard stereotaxic apparatus. Proposed grid electrode array are implanted over the area of auditory cortex. Fig. 3.4 (A) shows the implanted location on the rat brain [57], and the practical implantation optical photograph is presented in Fig. 3.4 (B), which shows that the presented grid electrode displayed a flexible property therefore greatly fit to the exposed brain cortex. Fig. 3.4 (C) indicates the close view of the electrode array contact area. Note that only the electrode covered area is exposed to dura layer, the rest area is skull. Fig. 3.4 (D) illustrates the channel number with respect to the location in electrode array, where ch-14, ch-15, ch-16 acts as ground and ch-1 is used as the reference channel.
The audio stimulator use signal generator, amplifier, audio amplifier and programmable attenuator (TDT-RZ5, TDT-PA5, TDT-RP2.1, TDT-SA1). The stimulate signals are 1kHz, 2kHz, 4kHz and 9kHz in frequency (in the auditory range of rat, 250-60kHz) with 25ms
Fig. 3.4 Electrode implantation location, rat brain anatomy is adopted from reference [58]
duration, 2.5ms linear rise/fall time and 75dB sound pressure level (SPL). Every test sound is repeated for 100 times with 1 second period. Additionally, the speaker output is calibrated by a precise microphone (B&K 4149) before experiment.
Fig. 3.5 shows an example of recorded 16 channel signal in 1 second time frame. The upper green line in the figure illustrates the stimulate signal. The auditory response is then recorded and averaged to explicate the even-related evidence by software.
Fig. 3.5 16-channel recoding in 1 second time frame
Fig. 3.6 shows the time-magnitude plot of the averaged result of the 16 channel auditory ECoG response: (A) 1 kHz 75 dB SPL (B) 2 kHz 75 dB SPL (C) 4 kHz 75 dB SPL (D) 9 kHz 75 dB SPL. The 4 by 4 matrix boxes indicates the related electrode location on the brain. Vertical line in each box denotes the stimulation trigger marker. Four electrodes maker G (ground) and R (reference) are used as ground electrodes and reference electrodes. Fig. 3.7 presents the time-Frequency plot: (A) 1 kHz 75 dB SPL (B) 2 kHz 75 dB SPL (C) 4 kHz 75 dB SPL (D) 9 kHz 75 dB SPL. Related frequency distribution versus different electrode location can be observed in the results.
Fig. 3.6 Time-magnitude plot of the averaged 16 channel auditory ECoG response (A) 1 kHz 75 dB SPL (B) 2 kHz 75 dB SPL (C) 4 kHz 75 dB SPL (D) 9 kHz 75 dB SPL.
Fig. 3.7 Time-frequency plot of the averaged 16 channel auditory ECoG response (A) 1 kHz 75 dB SPL (B) 2 kHz 75 dB SPL (C) 4 kHz 75 dB SPL (D) 9 kHz 75 dB SPL.
By comparing the recorded ECoG intensity, 4 kHz stimulation shows strongest response, while 2 kHz shows less response and 1 kHz, 9 kHz have weakest response signal. Measured results shows that localized neurons discharge phenomenon (gamma activities, 30 – 200Hz) are recorded by the presented grid electrode array. According to Fig. 3.6 and Fig. 3.7, three different auditory areas are covered by the grid electrode due to the different pattern observation. Group 1 includes 13, 11, 5, 3, Group 2 includes 8, 6, 10, 12, 2, 4, and 9, 7
belongs to the other group. Experiment results shows that recorded evoked potential on auditory cortex is about ±70uV, and the minimal effective sound stimulation magnitude is 20 dB SPL.
3.5 Summary
In this chapter, the implementation and characterization of a MEMS-based flexible grid electrode array utilizing parylene-C as substrate was presented for ECoG measurement applications. An un-symmetric sandwich-type structure consists of two Parylene layer (10um substrate and 1um isolation layer) and one Platinum layer was successfully fabricated. Comparing to previous works that using symmetric sandwich-type with thick isolation structure (polyimide, >20um), proposed method enhanced the adhesion property on brain cortex surface with great flexibility. Additionally, previous works suffer from the level difference between sensing electrode and passivation surface may need another electroplating post process high curing temperature (200-400ºC). In this work, simplified process under room temperature and superior properties were achieved without complex and high-temperature processes.
In-vivo experiments demonstrate the recording capability of the proposed grid electrode array. Recorded auditory evoked potentials (AEPs) is ±70μV with 20dB SPL minimum sound level under general anesthesia, as well as the localized neurons discharge phenomenon (GAMA Activity, 30Hz~500Hz). The measurement result shows that the presented electrode array can cover the most of brain auditory cortex surface area, and distinguish specific signal characteristics between different electrode sites. Proposed grid array is looking forward to be used in awake animals in future works, which helps the studies on neurons degeneration, the mechanism of brain disease, and the development of the ECoG controlled BCI interface as well.
![Fig. 1.1 Waveforms of the biopotentials: (a) ECG (b) EEG (c) EMG (d) EOG [1]](https://thumb-ap.123doks.com/thumbv2/9libinfo/8695407.198720/10.892.139.539.111.447/fig-waveforms-biopotentials-ecg-b-eeg-emg-eog.webp)
![Fig. 3.4 Electrode implantation location, rat brain anatomy is adopted from reference [58]](https://thumb-ap.123doks.com/thumbv2/9libinfo/8695407.198720/34.892.144.642.116.388/fig-electrode-implantation-location-brain-anatomy-adopted-reference.webp)
