Controlling ownership and
firm performance in
Taiwan: The role of external competition and
internal governance
☆
Anlin Chen
a, Lanfeng Kao
b,⁎
, Cheng-Shou Lu
ca70 Lien Hai RD, Department of Business Management, National Sun Yat-sen University, Kaohsiung 80424, Taiwan b700 University RD Department of Finance, National University of Kaohsiung, Kaohsiung 81148, Taiwan c
415 Chien Kung RD, Department of Wealth and Taxation Management, National Kaohsiung University of Applied Sciences, Kaohsiung 80778, Taiwan
a r t i c l e i n f o
a b s t r a c t
Article history:
Received 5 December 2013 Accepted 28 April 2014 Available online 5 May 2014
This study examines the relationship between controlling ownership and firm performance in Taiwan. We focus on whether external competition and internal governance alleviate the adverse impact of controlling ownership on firm performance and whether external governance dominates internal governance. Wefind that the relationship between controlling ownership andfirm performance is inverted U-shaped. Firm performance increases with controlling ownership at a low ownership level but decreases with controlling ownership at a high ownership level. The negative effect of controlling ownership onfirm performance at a high level of controlling ownership exists when external competition or internal governance is weak but disappears when external competition or internal governance is strong. Moreover, external competition is more effective and subsumes internal governance in mitigating the negative effect of controlling ownership onfirm performance.
© 2014 Elsevier B.V. All rights reserved.
JEL classification: G34 G35 Keywords: Corporate governance Entrenchment External governance Internal governance Product market competition
1. Introduction
Corporate governance consists of external and internal governance. Product market competition is considered as an effective external governance factor in monitoring management and reducing agency
conflicts. This paper examines how external product market competition and internal governance
☆ We appreciate the helpful comments from an anonymous referee and the participants at the 2013 Global Business & International Management Conference. We also thank the National Science Council of the Republic of China, Taiwan forfinancially supporting this research under Contract No. NSC100-2410-H-110-020-MY2. All the remaining errors are ours.
⁎ Corresponding author. Tel.: +886 7 5919502; fax: +886 7 5919329.
E-mail addresses:anlin@mail.nsysu.edu.tw(A. Chen),lanfeng@nuk.edu.tw(L. Kao),cslu@cc.kuas.edu.tw(C.-S. Lu).
http://dx.doi.org/10.1016/j.pacfin.2014.04.007 0927-538X/© 2014 Elsevier B.V. All rights reserved.
Contents lists available atScienceDirect
Paci
fic-Basin Finance Journal
influence the relationship between top management ownership and firm performance in a weak investor
protection economy from an agency conflict perspective.
The relationship between top management ownership and firm performance is controversial. The
convergence of interest hypothesis indicates that as management ownership rises, managers are more likely to
focus on value-maximization activities.Jensen and Meckling (1976)andJensen (1993)argue thatfirm value
increases with managerial ownership.Jensen (1993)and Chen et al. (2007)find evidence of a positive
relationship betweenfirm value and management ownership.
Contrary to the convergence of interest hypothesis, the entrenchment hypothesis implies that managers
pursue their own interests to expropriate shareholders.Jensen and Ruback (1983)propose the entrenchment
hypothesis, indicating that greater management ownership increases the possibility of managers' pursuing their own interests.Israel (1992)shows thatfirm value decreases when insider ownership is sufficiently high
to expropriate minority shareholders.Bozec and Laurin (2008)alsofind that firm value decreases when
controlling families have incentives and opportunities to expropriate minority shareholders. The
entrench-ment hypothesis implies a negative relationship between manageentrench-ment ownership andfirm performance at a
high management ownership level.
Morck et al. (1988)combine the convergence of interest hypothesis and entrenchment hypothesis,
arguing that the relationship between management ownership andfirm value (measured by Tobin's Q)
should be non-linear.Kim and Lu (2011)use quadratic regression specifications and report an inverted
U-shaped relationship between managerial ownership andfirm performance using U.S. data.
Internal and external governance can improve firm performance. For internal corporate governance
mechanisms, previous studies have typically focused on the structure of the board of directors, such as CEO duality, board size, and board independence. When a CEO also serves as the chairperson of the board (COB), known as CEO duality, the management is not appropriately monitored, leading to more severe agency conflicts. Chen et al. (2005)andTang et al. (2013)show that stockholder-manager agency conflicts are alleviated when CEO and COB positions arefilled separately.Yermack (1996)indicates that a smaller board of directors is more effective, leading to a negative relationship between board size andfirm value.Klein (2002)andXie et al. (2003) argue that board independence improves corporate governance.
Stigler (1958)argues that intense competition can push inefficient firms out of the market.Schmidt (1997)indicates that intense competition raises the default and liquidation risks offirms, leading to
reduced managerial agency conflicts. Shleifer and Vishny (1997) show that competition prohibits
manager investment in negative NPV projects to reduce the agency costs of free cashflow.Bertrand and
Mullainathan (2003)also demonstrate that competition eliminates the“quiet life” to reduce costs.Allen and Gale (2000)document product market competition as either a monitoring mechanism or a corporate
governance mechanism to reduce agency conflicts.
In this paper, we examine the relationship between controlling ownership andfirm performance and
whether product market competition serves as an effective external governance mechanism in Taiwan. We examine the Taiwan market primarily because Taiwan is an emerging civil law country with concentration of
ownership and with weak takeover threats.La Porta et al. (2000)document that civil law countries do not
provide strong investor protection.Choy et al. (2011)characterize Taiwan as a country with high investor
expropriation risk. Taiwanesefirms are also likely affiliated with pyramidal or cross-holding structures with controlling families or groups, resulting in a highly concentrated ownership structure.Claessens et al. (2000) find that in East Asian countries including Taiwan, ownership is highly concentrated, deterring takeover threats. Previous studies have shown that the inverted U-shaped relationship between management ownership and firm performance exists and that takeover threats play an important role in governance. It is worth examining if competition improves governance in a country such as Taiwan where takeover is not popular. This paper
contributes to the literature by filling this gap. We examine whether external competition or internal
governance mechanisms reduce the negative impacts of management ownership onfirm performance at high
levels of management ownership. How the internal governance or external competition alleviates the entrenchment effect in Taiwan is the key issue of this paper.
Our results are summarized as follows: Wefind that the relationship between controlling shareholder
ownership and Tobin's Q in Taiwan is inverted U-shaped, which only exists when firms have weak
external competition or weak internal governance. With strong external competition or strong internal
governance,firm performance is positively related to controlling ownership. Strong external competition
at high levels of controlling ownership. Moreover, external competition is more effective and dominates
internal governance in reducing the negative impact of controlling ownership onfirm performance.
The remainder of this paper is organized as follows:Section 2presents a description of the data source and
variable definitions. We examine the relationship between controlling shareholder ownership and firm
performance inSection 3.Section 4presents a discussion of the relationship betweenfirm performance and
external competition or internal corporate governance.Section 5examines whether external competition or
internal governance is more effective in influencing the relationship between controlling ownership and firm
performance. Robustness tests regarding the effect of governance on the relationship between controlling shareholder ownership andfirm performance are reported inSection 6. Finally,Section 7offers a conclusion.
2. Data source and variable definitions
2.1. Data source
Our data comprise all the listedfirms in Taiwan during the 1996–2011 period. The sample period
begins in 1996 because the Taiwan Economic Journal (TEJ) established a corporate governance dataset for
Taiwanesefirms in that year. All study variables, including market equity, book assets, book debt, book
equity, R&D expenses, net sales, advertising expenses, weekly stock returns, cash equivalents,fixed assets,
firm age, controlling shareholder ownership, CEO tenure,1
and board structure variables are obtained from the TEJ database. Observations with missing values for the required variables are discarded from the
sample, leaving 7028firm–year observations in our sample.
2.2. Variable definitions
Our variables consist offirm performance, top management ownership, external competition, internal
corporate governance, and control variables.
We followMorck et al. (1988),Kim and Lu (2011)and most previous studies, using Tobin's Q as afirm
performance measure. Tobin's Q (Q) is defined as market equity plus book debt, divided by book assets.
Management ownership measures the strength of management influence on decision-making.Morck et al.
(1988)use managerial ownership;Himmelberg et al. (1999)use insider ownership; andKim and Lu (2011)use
CEO ownership. However,Claessens et al. (2000)show that in most East Asian countries, including Taiwan,
controlling families or controlling groups exist through pyramids or cross-holding. A CEO or manager of a
Taiwanesefirm is likely to be a family member nominally representing the controlling family. CEO ownership
or managerial ownership underestimates the strength of the management influence of Taiwanese firms.
Therefore, we adopt controlling shareholder ownership as the top management ownership (OWN).2
Published studies have typically used the Herfindahl–Hirschman index (HHI) to measure industry
concentration. High HHI implies high industry concentration and low industry product market
competition. HHI is the sum of the squares of individualfirm market shares in a particular industry. Our
measure of product market competition (ONE_HHI) is defined as one minus the HHI index as follows:
ONE HHIjt¼ 1− Xnj i¼1 salesijt Xnj i¼1salesijt !2 : ð1Þ
Salesijtis total sales offirm i in industry j in year t, and njis the number offirms in industry j.3We define
COMPETITION = 1 if an industry firm with product market competition (ONE_HHI) higher than the
1
In addition to the TEJ dataset, we also collect CEO tenure data from the annual reports of listedfirms available on the website of Market Observation Post Systems of Taiwan Stock Exchange.
2We followLa Porta et al. (1999)to define the ultimate controlling shareholders. The controlling ownership consists of direct and
indirect voting rights of the ultimate controlling shareholders. Since stock option plan is not popular in Taiwan, repeating the analyses including stock options in the controlling ownership produces similar results.
3
We follow the definition of the Taiwan Stock Exchange in defining industry in this study. These industries are oil, gas and utilities; glass and ceramic; cement; automobile; paper and pulp; trading and consumer goods; plastic; electrical and cable; shipping and transportation; tourism; rubber; iron and steel; electronics; food; chemical, biotechnology, and medical care; textile; electric machinery; and building materials and construction.
median of the competition measure is defined as a high-competition industry; otherwise COMPETITION = 0 forfirms in a low-competition industry.4SEG is defined as 1, 2, 3, and 4 for observations in the 1st, 2nd,
3rd, and 4th quartiles of ONE_HHI, respectively.
We use CEO duality, board size, and board independence as measures of internal corporate governance. Non-DUALITY = 1 if the CEO does not serve as the COB; Non-DUALITY = 0 otherwise. Board size (BOARD) is the number of directors on the board. Small_BOARD = 1 if a board contains 7 or fewer directors; otherwise, Small_BOARD = 0. The percentage of independent directors on the board (Ind_DIRECTOR) is the measure of board independence. Ind_BOARD = 1 if a board contains at least one independent director;
otherwise Ind_BOARD = 0. Non-DUALITY, Small_BOARD, and Ind_BOARD are documented to be efficient
internal governance mechanisms in monitoring management.5
To examine the relationship between top management ownership andfirm performance, we follow
Demsetz and Lehn (1985), Himmelberg et al. (1999), and Kim and Lu (2011) to control for R&D
expenditures,firm idiosyncratic risk, advertising expenditure, operating performance, cash position, fixed
assets, capital structure,firm age, and firm size.
R&D expenditure (RD) is the ratio of R&D expenses to lagged total assets. We measure idiosyncratic risk (RMSE) by the standard error of the residuals from the market model based on the weekly stock returns and weekly stock index returns during the year. Advertising expenditure (ADV) is the ratio of
advertising expenses to lagged assets. We use return of assets (ROA) as a measure for firm operating
performance. Cash position (CASH) is the ratio of cash and cash equivalents to total assets at the end of the
year. We scalefixed assets by total assets at the end of the year as a proxy for investment policy (FA). We
employ a year-end debt-to-asset ratio (DA) to capture capital structure. Firm age (AGE) is the number of
years from the establishment of thefirm. We use the logarithm of lagged total assets (logASSET) as a proxy
forfirm size.6CEO tenure (TENURE) is one plus the number of years of a CEO on the position.
Table 1summarizes the variable definitions. 2.3. Descriptive statistics
Table 2reports the descriptive statistics of our variables and shows that Tobin's Q has an average of
1.288 with a median of 1.068.7On average, the controlling shareholders own 0.305 of the ownership with
a median of 0.284. The R&D expenditure is approximately 1.630% of the lagged total assets, whereas the advertising expenditure is approximately 5.787% of the lagged total assets. The average ROA is 2.856%. On average, cash,fixed assets, and debt are 10.420%, 36.751%, and 40.126% of the total assets, respectively. The mean competition measure (ONE_HHI) is 0.878 with a median of 0.926.
InTable 3, we further split the entire sample into subsamples using external competition and internal corporate governance measures. Panel A ofTable 3reports the descriptive statistics by external competition
and indicates thatfirms with high competition experience lower Q, higher controlling shareholder ownership,
lowerfixed assets, and longer CEO tenure and are younger and smaller. Competition tends to reduce firm
profitability, leading to lower Q. Minority shareholders might be less interested in firms faced with intense competition, leading to higher ownership for controlling shareholders. Fixed asset investment is a barrier to entry. Largefixed asset investment deters competitors, leading to lower industry competition. Firms in intense competition markets are typically younger and smaller. CEOs stay on their position longer to face more competitive markets.
Panel B ofTable 3presents the descriptive statistics by CEO duality and shows thatfirms with CEO duality experience a higher Tobin's Q, greater R&D, advertising expenditures, cash positions, and CEO tenure, but
lowerfixed assets and debt ratios, and tend to be younger and smaller. Panel C ofTable 3presents the
4We also try industry net profit margin and industry sales expenses-to-revenue as measures of industry competition and reach
similar results.
5
Most of thefirms do not have any independent directors. In our 7028 observations, 5088 do not have independent directors; the remaining 1940 have at least one independent director on board. Therefore, we use an indicator of at least one independent director on board as the proxy for internal governance.
6
Market capitalization is typically used as a proxy forfirm size. However, since Tobin's Q is used to measure firm performance, we measurefirm size by total assets instead of market capitalization. We appreciate this suggestion from an anonymous referee.
7
The maximum Q = 12.87 implies the existence of extreme value. We thus winsorize extreme Q to 1st or 99th percentiles and reach qualitatively similar results.
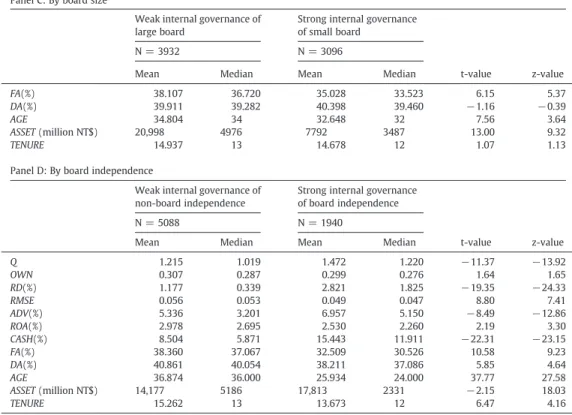
descriptive statistics according to board size and indicates thatfirms with large boards experience a lower Tobin's Q, controlling shareholder ownership, and idiosyncratic risk, but higher advertising expenditures,fixed
assets, and tend to be older and larger. Panel D shows thatfirms without independent directors on the board
experience lower Tobin's Q, R&D, advertising expenditure, cash position; but higher idiosyncratic risk, ROA, fixed assets, debt ratio, and CEO tenure and tend to be older. The descriptive statistics inTable 3show the univariate analyses and do not reach a consistent conclusion regarding the effects of external competition and
internal corporate governance onfirm performance. We use multivariate analyses to avoid short-model bias in
the univariate analyses. Table 1
Variable definition.
Variable Definition
Q Tobin's Q measured by (market equity + book debt) / (book assets).
OWN Controlling shareholder's voting rights.
RD R&D expenditure measured by the ratio of R&D expenses to lagged total assets.
RMSE Idiosyncratic risk measured by the standard error of residual of market model using weekly returns in a calendar year.
ADV Advertising expenditure measured by the ratio of advertising expenses to lagged total assets. ROA Return on assets measured by the ratio of net income to lagged total assets.
CASH Cash position to total assets.
FA Asset investment measured by the ratio offixed assets to total assets. DA Leverage measured by the ratio of total debt to total assets.
AGE Firm age from establishment.
ASSET Firm size measured by year-end total assets in million NT dollars. One U.S. dollar is approximately 30 NT dollars.
logASSET Logarithm of ASSET.
ONE_HHI Competition measure defined as 1 minus the HHI index based on the market shares of total sales. COMPETITION Dummy variable for external product market competition.
SEG A score of 1, 2, 3, and 4 for observations in the 1st, 2nd, 3rd, and 4th quartiles of ONE_HHI, respectively. Non-DUALITY Dummy variable for Non-CEO duality.
BOARD Board size defined as the number of directors on the board. Small-BOARD Dummy variable for small board size.
Ind_DIRECTOR Percentage of independent directors on board. Ind-BOARD Dummy variable for board independence.
TENURE One plus the number of years a CEO on the CEO position.
Table 2
Descriptive statistics.
Descriptive statistics of Tobin's Q, controlling ownership, R&D expenditure, idiosyncratic risk, advertising expenditure, ROA, cash position,fixed assets, debt ratio, firm age, and total assets, competition intensity, CEO duality, board size, percentage of independent directors on board, and CEO tenure for a sample of 7028firm–year observations in Taiwan in 1996–2011. All observations with missing variable values are excluded.
Mean Std Minimum Median Maximum
Q 1.288 0.784 0.279 1.068 12.873 OWN 0.305 0.171 0.0004 0.284 0.971 RD(%) 1.630 2.606 0.000 0.691 35.739 RMSE 0.054 0.031 0.000 0.052 0.725 ADV(%) 5.787 7.377 0.000 3.776 81.295 ROA(%) 2.856 8.713 −85.400 2.590 83.490 CASH(%) 10.420 10.243 0.009 7.367 83.417 FA(%) 36.751 20.882 0.000 35.160 99.894 DA(%) 40.126 17.464 1.269 39.345 99.539 AGE 33.857 12.188 7.000 33.000 67.000 ASSET (million NT$) 15,181 47,269 90 4222 1,181,868 ONE_HHI 0.878 0.123 0.001 0.926 0.980 DUALITY 0.312 0.463 0 0 1 BOARD 7.010 2.669 1 7 26 Ind_DIRECTOR(%) 8.156 14.036 0 0 75 TENURE 14.823 10.056 1 13 51
Table 3
Descriptive statistics by external competition and internal governance.
Descriptive statistics of Tobin's Q, controlling ownership, R&D expenditure, idiosyncratic risk, advertising expenditure, ROA, cash position,fixed assets, debt ratio, firm age, total assets by competition intensity, CEO duality, board size, board independence, and CEO tenure for a sample of 7028firm–year observations in Taiwan in 1996–2011. An industry firm with a competition measure (ONE_HHI) lower than the median of the competition measure is defined as a low-competition industry; otherwise, it is defined as a high-competition industry. CEO serves as COB is defined as CEO duality; otherwise, it is non-CEO duality. A board with at least 7 directors is defined as a large board; otherwise, it is a small board. A board with independent directors is defined with board independence; otherwise, it is with non-board independence. All observations with missing variable values are excluded.
Panel A: By external competition
Weak internal governance of large board
Strong internal governance of small board
N = 3932 N = 3096
Mean Median Mean Median t-value z-value
Q 1.327 1.090 1.252 1.051 4.04 3.35 OWN 0.298 0.278 0.311 0.290 −3.09 −2.37 RD(%) 1.604 0.454 1.654 0.900 −0.82 −8.25 RMSE 0.054 0.052 0.055 0.052 −1.41 −0.94 ADV(%) 5.950 3.797 5.638 3.768 1.77 0.20 ROA(%) 3.003 2.645 2.725 2.510 1.33 1.14 CASH(%) 10.356 7.453 10.480 7.293 −0.51 0.72 FA(%) 40.186 37.919 33.695 32.696 13.10 7.84 DA(%) 39.306 38.220 40.854 40.412 −3.72 −3.95 AGE 35.057 35.000 32.788 32.000 7.76 8.16 ASSET (million NT$) 23,405 6091 7867 3094 13.22 18.59 TENURE 14.610 12 15.013 13 −1.68 −2.90
Panel B: By CEO duality
Weak internal governance of CEO Duality
Strong internal governance of Non-CEO Duality
N = 4837 N = 2191
Mean Median Mean Median t-value z-value
Q 1.326 1.105 1.269 1.051 2.77 −4.23 OWN 0.302 0.276 0.306 0.289 −0.90 −2.77 RD(%) 2.017 1.019 1.455 0.532 7.81 8.86 RMSE 0.056 0.053 0.053 0.051 2.92 2.84 ADV(%) 6.093 4.067 5.645 3.679 2.39 2.32 ROA(%) 3.030 2.560 2.777 2.610 1.15 −0.41 CASH(%) 11.345 8.348 10.002 6.958 5.10 4.95 FA(%) 34.511 32.615 37.764 36.503 −6.24 −5.96 DA(%) 39.051 38.421 40.612 39.655 −3.47 −2.41 AGE 31.724 30 34.822 34 −10.25 −11.75 ASSET (million NT$) 11,423 3286 16,883 4926 −4.43 −9.60 TENURE 17.432 16 13.641 11 14.49 13.64
Panel C: By board size
Weak internal governance of large board
Strong internal governance of small board
N = 3932 N = 3096
Mean Median Mean Median t-value z-value
Q 1.269 1.059 1.311 1.080 −2.30 −1.93 OWN 0.291 0.267 0.323 0.304 −7.82 −6.45 RD(%) 1.537 0.760 1.750 0.570 −3.32 2.82 RMSE 0.052 0.050 0.057 0.055 −6.99 −5.96 ADV(%) 6.011 3.949 5.499 3.584 2.94 2.44 ROA(%) 2.781 2.510 2.951 2.650 −0.81 −1.03 CASH(%) 10.476 7.525 10.351 7.187 0.51 1.38
3. Multivariate specification
We use the following model specification to examine how controlling ownership influences firm
performance.
Qit¼ β0þ β1OWNitþ β2OWN 2
itþ β3RDitþ β4ADVitþ β5ROAit
þβ6CASHitþ β7FAitþ β8AGEitþ β9DAitþ β10RMSEit
þβ11logASSETitþ firm fixed effects þ year fixed effects þ εit
ð2Þ
In Eq.(2), the quadratic form of OWN captures the non-linear effect of controlling ownership onfirm
performance. Since the ownership is endogenous, we follow Kim and Lu (2011) to employ 2SLS
regressions using TENUREt, and TENURE∗ SEGtas instrument variables and RDt, ADVt, ROAt, CASHt, DAt, FAt,
AGEt, RMSEt, and logASSETtas control variables.8Firmfixed effects and year fixed effects are included to
address the issues of omitted variables.
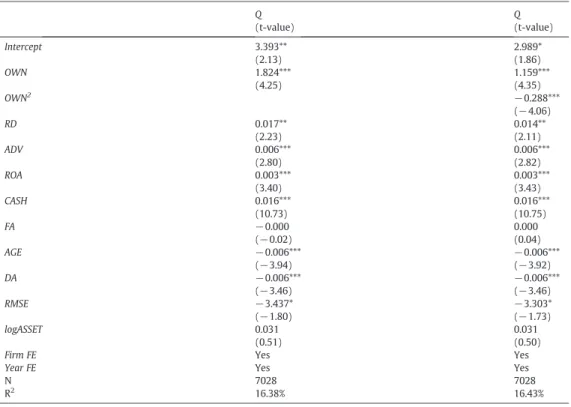
Table 4reports the multivariate regression results and indicates that OWN is positively related to Q,
whereas OWN2is negatively related to Q, implying an inverted U-shaped relationship between Q and
OWN. The inverted U-shaped relationship demonstrates thatfirm performance increases with controlling
shareholder ownership at a low level of controlling shareholder ownership, but decreases with controlling ownership at a high level of ownership. The positive relation between Q and OWN is consistent with the convergence of interests hypothesis, whereas the negative relation between Q and OWN supports the entrenchment hypothesis.
8
Kim and Lu (2011)also use CEO state and federal income tax rate as an instrument variable to solve the endogeneity issues of ownership. Kim and Lu argue that the state income tax rate is useful because the state tax rate varies across states. Because there is only one income tax rate statutory in Taiwan, we do not use income tax rate as an instrument variable.
Table 3 (continued)
Panel A: By external competition
Weak internal governance of large board
Strong internal governance of small board
N = 3932 N = 3096
Mean Median Mean Median t-value z-value
FA(%) 38.107 36.720 35.028 33.523 6.15 5.37
DA(%) 39.911 39.282 40.398 39.460 −1.16 −0.39
AGE 34.804 34 32.648 32 7.56 3.64
ASSET (million NT$) 20,998 4976 7792 3487 13.00 9.32
TENURE 14.937 13 14.678 12 1.07 1.13
Panel D: By board independence
Weak internal governance of non-board independence
Strong internal governance of board independence
N = 5088 N = 1940
Mean Median Mean Median t-value z-value
Q 1.215 1.019 1.472 1.220 −11.37 −13.92 OWN 0.307 0.287 0.299 0.276 1.64 1.65 RD(%) 1.177 0.339 2.821 1.825 −19.35 −24.33 RMSE 0.056 0.053 0.049 0.047 8.80 7.41 ADV(%) 5.336 3.201 6.957 5.150 −8.49 −12.86 ROA(%) 2.978 2.695 2.530 2.260 2.19 3.30 CASH(%) 8.504 5.871 15.443 11.911 −22.31 −23.15 FA(%) 38.360 37.067 32.509 30.526 10.58 9.23 DA(%) 40.861 40.054 38.211 37.086 5.85 4.64 AGE 36.874 36.000 25.934 24.000 37.77 27.58 ASSET (million NT$) 14,177 5186 17,813 2331 −2.15 18.03 TENURE 15.262 13 13.673 12 6.47 4.16
For the control variables,Table 4shows that Q is positively related to R&D expenditure, advertising
expenditure, ROA, and cash position; but negatively related tofirm age, debt ratio, and idiosyncratic risk.
4. External competition and internal governance
Effective corporate governance improves firm performance by reducing potential agency conflicts
between controlling shareholders and minority shareholders. The takeover market mechanism is generally documented as an effective external governance mechanism and reinforces competition. However, the takeover market is unpopular in East Asian countries, including Taiwan, leading to its
governance inefficiency. We examine whether product market competition serves as an effective external
governance mechanism in Taiwan. In addition to external competition, we also examine the effect of internal governance on the relationship between Q and OWN. We use CEO duality, board size, and board independence as internal governance mechanisms.
Table 5examines the effects of OWN on Q by the intensity of external competition. Column 1 ofTable 5
indicates that OWN is positively related to Q with t-value = 2.22 but OWN2is negatively related to Q with
t-value =−2.95. The results for the low-competition subsample in Column 1 ofTable 5resemble those
for the entire sample in Column 2 ofTable 4. However, for the high-competition subsample, Column 2 of
Table 5reports that OWN is positively related to Q with t-value = 4.32 but OWN2is insignificantly related
to Q with t-value =−0.98, indicating that the relationship between controlling ownership and firm
performance is positive instead of inverted U-shaped. Table 4
Relationship between Tobin's Q and controlling ownership.
The second stage results of instrument variable regression analyses of Tobin's Q on controlling ownership and controlling ownership on Q with a sample of 7028firm–year observations in Taiwan in 1996–2011. Endogenous variables are OWN and OWN2. The
instrument variables are TENURE and TENURE∗ SEG. All observations with missing variable values are excluded. ***, ** and * represent the significance levels at 1%, 5% and 10%, respectively.
Q (t-value) Q (t-value) Intercept 3.393** (2.13) 2.989* (1.86) OWN 1.824*** (4.25) 1.159*** (4.35) OWN2 −0.288*** (−4.06) RD 0.017** (2.23) 0.014** (2.11) ADV 0.006*** (2.80) 0.006*** (2.82) ROA 0.003*** (3.40) 0.003*** (3.43) CASH 0.016*** (10.73) 0.016*** (10.75) FA −0.000 (−0.02) 0.000 (0.04) AGE −0.006*** (−3.94) −0.006*** (−3.92) DA −0.006*** (−3.46) −0.006*** (−3.46) RMSE −3.437* (−1.80) −3.303* (−1.73) logASSET 0.031 (0.51) 0.031 (0.50)
Firm FE Yes Yes
Year FE Yes Yes
N 7028 7028
Panels A and B ofTable 6report the effect of OWN on Q by weak internal governance and strong internal
governance, respectively. Firms with CEO duality, large boards, or non-board independence are defined as
firms with weak internal governance; firms with non-CEO duality, small boards, or board independence are
those with strong internal governance. Panel A ofTable 6indicates that OWN is significantly positive and
OWN2is significantly negative for firms with weak internal governance (t-value = −2.54 for firms with CEO
duality; t-value =−2.44 for firms with large boards; t-value = −2.40 for firms with non-board
independence), confirming the inverted U-shaped relationship between controlling ownership and firm
performance. However, Panel B ofTable 6shows that forfirms with strong internal governance, OWN2is not
significantly negative (t-value = −1.55 for firms with non-CEO duality; t-value = −1.06 for firms with
small boards; t-value =−1.20 for firms with board independence) implying the disappearance of the
negative relationship between controlling ownership andfirm performance at high levels of controlling
ownership.
Tables 5 and 6show that forfirms with low external competition or weak internal governance of CEO duality, large boards, or non-board independence, the relationship between OWN and Q is inverted U-shaped, indicating that Q increases as OWN increases at low levels of OWN and Q decreases as OWN
increases at high levels of OWN. However, forfirms with high external competition or strong internal
governance of non-duality, small boards, or board independence, the negative effect of OWN on Q at high
levels of OWN disappears.Tables 5 and 6show that strong external governance through intense external
Table 5
Relationship between Tobin's Q and controlling ownership by external competition.
The second stage results of instrument variable regression analyses of Tobin's Q on controlling ownership and controlling ownership on Q with a sample of 7028firm–year observations in Taiwan in 1996–2011 by competition. Endogenous variables are OWN and OWN2
. The instrument variables are TENURE and TENURE∗ SEG. An industry firm with a competition measure (ONE_HHI) lower than the median of the competition measure is defined as a low-competition industry; otherwise, it is defined as a high-competition industry. All observations with missing variable values are excluded. ***, ** and * represent the significance levels at 1%, 5% and 10%, respectively.
Low competition High competition
Q (t-value) Q (t-value) Intercept 2.567 (1.17) 4.674* (1.93) OWN 1.063** (2.22) 2.366*** (4.32) OWN2 −0.622*** (−2.95) −0.409(−0.98) RD 0.018** (2.19) 0.019** (2.38) ADV 0.009*** (3.22) 0.001** (2.00) ROA 0.003* (1.71) 0.004*** (2.86) CASH 0.010*** (4.60) 0.019*** (9.49) FA −0.001 (−0.75) 0.001 (1.00) AGE −0.009*** (−3.89) −0.004* (−1.81) DA −0.007*** (−2.95) −0.006** (−2.29) RMSE −3.078 (−1.18) −5.232* (−1.82) logASSET 0.023 (0.28) 0.095 (1.01)
Firm FE Yes Yes
Year FE Yes Yes
N 3308 3720
R2
competition is more effective and subsumes internal governance to reduce the negative effect of controlling
ownership onfirm performance at high levels of controlling ownership.
7. Conclusion
Investors in East Asian countries are under weak protection, partly due to the concentration of ownership and the absence of takeover threats. The existence of controlling groups or families through pyramids or cross-holding ownerships deters the development of a takeover market leading to a weak investor protection economy. Taiwan is an example of an East Asian economy with weak investor protection. Consequently, investors in Taiwan more urgently require corporate governance than do those in strong investor protection economies.
We examine the relationship between controlling ownership andfirm performance in Taiwan. The
relationship has an inverted U shape because of the mixed effects from convergence of interests and entrenchment, leading to a positive relationship at low levels of controlling ownership and a negative
relationship at high levels of controlling ownership. Wefind that the inverted U-shaped relationship only
exists whenfirms experience weak corporate governance. Strong external competition or strong internal
governance reduces the entrenchment effect from controlling shareholders, leading to the disappearance of the negative relationship between controlling ownership and Tobin's Q at high levels of controlling
ownership. More importantly, wefind that external competition is more effective and dominates internal
governance in reducing the entrenchment effect. The order of power to alleviate the entrenchment effect from controlling ownership is“strong external competition and strong internal governance”, “strong external
competition and weak internal governance”, “weak external competition and strong internal governance”,
and“weak external competition and weak internal governance”. We confirm the effectiveness of external
product market competition. In Taiwan, the external competition can protect minority shareholders from controlling shareholder expropriation better than the internal governance mechanisms.
References
Allen, F., Gale, D., 2000.Corporate governance and competition. In: Vives, X. (Ed.), Corporate Governance: Theoretical and Empirical Perspectives. Cambridge University Press, New York, pp. 23–94.
Bertrand, M., Mullainathan, S., 2003.Enjoying the quiet life? Corporate governance and managerial preferences. J. Polit. Econ. 111, 1043–1075.
Bozec, Y., Laurin, C., 2008.Large shareholder entrenchment and performance: empirical evidence from Canada. J. Bus. Financ. Account. 35, 25–49.
Chen, A., Kao, L., Tsao, M., Wu, C., 2007.Building a corporate governance index from the perspectives of ownership and leadership for firms in Taiwan. Corp. Gov. Int. Rev. 15, 251–261.
Chen, Z., Cheung, Y.-L., Stouraitis, A., Wong, A.W.S., 2005.Ownership concentration,firm performance, and dividend policy in Hong Kong. Pac. Basin Financ. J. 13, 431–449.
Choy, H., Gul, F.A., Yao, J., 2011.Does political economy reduce agency costs? Some evidence from dividend policies around the world. J. Empir. Financ. 18, 16–35.
Claessens, S., Djankov, S., Lang, L.H.P., 2000.The separation of ownership and control in East Asian corporations. J. Financ. Econ. 58, 81–112. Demsetz, H., Lehn, K., 1985.The structure of corporate ownership: causes and consequences. J. Polit. Econ. 93, 1155–1177. Himmelberg, C.P., Hubbard, R.G., Palia, D., 1999.Understanding the determinants of managerial ownership and the link between
ownership and performance. J. Financ. Econ. 53, 353–384.
Israel, R., 1992.Capital and ownership structures, and the market for corporate control. Rev. Financ. Stud. 5, 181–198. Jensen, M.C., 1993.The modern industrial revolution, exit, and the failure of internal control systems. J. Financ. 48, 831–880. Jensen, M.C., Meckling, W.H., 1976.Theory of thefirm: managerial behavior, agency costs and ownership structure. J. Financ. Econ. 3, 305–360. Jensen, M.C., Ruback, R.S., 1983.The market for corporate control: the scientific evidence. J. Financ. Econ. 11, 5–50.
Kim, E.H., Lu, Y., 2011.Ceo ownership, external governance, and risk-taking. J. Financ. Econ. 102, 272–292.
Klein, A., 2002.Audit committee, board of director characteristics, and earnings management. J. Account. Econ. 33, 375–400. La Porta, R., Lopez-de-Silanes, F., Shleifer, A., 1999.Corporate ownership around the world. Journal of Finance 54 (2), 471–517. La Porta, R., Lopez-de-Silanes, F., Shleifer, A., Vishny, R., 2000.Investor protection and corporate governance. J. Financ. Econ. 58, 3–27. Morck, R., Shleifer, A., Vishny, R.W., 1988.Management ownership and market valuation: An empirical analysis. J. Financ. Econ. 20,
293–315.
Schmidt, K.M., 1997.Managerial incentives and product market competition. Rev. Econ. Stud. 64, 191–213. Shleifer, A., Vishny, R.W., 1997.A survey of corporate governance. J. Financ. 52, 737–783.
Stigler, G., 1958.The economics of scale. J. Law Econ. 1, 54–71.
Tang, H.-w., Chen, A., Chang, C.-C., 2013.Insider trading, accrual abuse, and corporate governance in emerging markets - evidence from Taiwan. Pac. Basin Financ. J. 24, 132–155.
Xie, B., Davidson Iii, W.N., DaDalt, P.J., 2003.Earnings management and corporate governance: The role of the board and the audit committee. J. Corp. Financ. 9, 295–316.