期末報告
財務餘裕資源、公司策略與績效之研究—新興經濟體之實
證
計 畫 類 別 : 個別型計畫 計 畫 編 號 : MOST 103-2410-H-004-191- 執 行 期 間 : 103 年 08 月 01 日至 104 年 07 月 31 日 執 行 單 位 : 國立政治大學企業管理學系 計 畫 主 持 人 : 于卓民 計畫參與人員: 博士班研究生-兼任助理人員:龔天鈞 博士班研究生-兼任助理人員:邱慧昀 處 理 方 式 : 1.公開資訊:本計畫涉及專利或其他智慧財產權,2 年後可公開查詢 2.「本研究」是否已有嚴重損及公共利益之發現:否 3.「本報告」是否建議提供政府單位施政參考:否中 華 民 國 104 年 07 月 30 日
中 文 摘 要 : 廠商的定位策略與績效的關係,一直是策略管理領域的研究 重點之一,Deephouse (1999) 的經典文章,整合策略觀點與 機構理論觀點,提出策略平衡理論,認為廠商與競爭者維持 中等程度的策略相似性時,最有益於廠商績效。在研究上, 此類研究有三大缺口:一、後續實證研究不多且結果並不一 致,卻有許多學者引用其平衡機構壓力與競爭壓力之觀點, 可能致使學界吸收錯誤的知識;二、研究多為單一產業之研 究,或多產業研究,但未納入產業變數,因此無法得知策略 相似性與績效的關係是否是受到機構壓力與競爭壓力之影 響;三、實證情境多在歐、美等先進國家,策略平衡理論是 否適用於中國大陸等新興國家仍有所疑慮。因此,本研究透 過複製與延伸 Deephouse 之經典文章,有助於補足此派研究 的三大缺口。此外,本研究亦顯示了複製與延伸研究的必要 性與重要性,透過系統性的複製與延伸研究,將可穩固策略 管理與國際企業領域研究之知識基礎,有助於知識的累積與 發展。 中文關鍵詞: 策略相似性、複製與延伸、策略平衡理論、競爭、正當性 英 文 摘 要 : Deephouse raises an important question for firms
being different from being the same ? He suggests moderate degree of similarity is best for
performance, while few recent studies provide
inconsistent results. Empirical evidences also imply that variant relative strength of competitive and institutional pressures may moderate strategic similarity – performance relationship. In order to test the generalizability of strategic balance
perspective and investigate how the relative strength of two contextual forces influences the strength and patterns of the relationship, we conduct a
replication and extension study of Deephouse's seminal work. Our results support strategic balance perspective in substance, but moderating effect indicates the ultimate relationship of strategic similarity and performance depends on the relative strength of two contextual forces. The implications are discussed.
英文關鍵詞: strategic similarity, replication and extension, strategic balance perspective, competition, legitimation
Strategic similarity and firm performance: A replication and
extension of Deephouse (1999)
INTRODUCTION
It is an important question for firms that should they be different from or be the same with others, and such question is related to many strategic management and organizational theories. For instance, institutional theory suggested that higher strategic similarity of firms is beneficial for them to obtain legitimacy and then is easier to acquire resources and enhance their performance (DiMaggio & Powell, 1983). In contrast, strategic views, such as resource-based view, competitive analysis, and dynamic capability, thought that higher strategic similarity would make it difficult for firms to develop their unique resources and capability to enter a niche market and thus hurt their performance (Baum & Mezias, 1992; Baum & Singh, 1994; Carroll, 1985). Integrating the two sets of perspectives, Deephouse (1999) suggested that firms face two kinds of pressures coming from social norms and competition simultaneously and that they can balance these pressures and create high performance by maintaining moderate degree of strategic similarity. That is, Deehouse thought the relationship between firms’ strategic similarity and their performance is inversely U-shaped. After Deephouse’s study, many researchers recognized the balance perspective as the best way to deal with the pressures from social norms and competition and enhance firms’ performance (e.g., Lamertz, Heugens, and Calmet, 2005; Tan, Shao, and Li, 2013; Boon, Paauwe, Boselie, and Hartog, 2009).
Although researchers have agreed the balance perspective suggested by Deephouse (1999), there is a lack of empirical studies to examine the relationship between strategic similarity and performance, and few studies focusing on the relationship even found inconsistency results. Among these studies, some supported Deephouse’s perspective. For
instance, Oerlemans and Meeus (2005) focused on 5,500 manufacturing and services firms and found an inversely U-shaped relationship between the deviation of firms’ innovation strategies and their performance. Robinson and McDougall (2001) studied 115 public firms in the U.S. between 1980 and 1987 and also found that firms with moderate rather than high or low degree of product differentiation have higher profitability. Conversely, some studies found the balance between the two pressures do not necessarily create better performance. Focusing on firms in American construction industry, Kale and Arditi (2003), for instance, separated strategic similarity into confirmatory and differentiation strategies and found only differentiation strategies have positive effects on firm performance. Moreover, Cennamo and Santalo (2013) found a U-shaped relationship between distinctive positioning of firms and their performance in video game industry in the U.S. As the inconsistent results reported in past empirical studies, it is worth to further examine the generalizability of Deephouse’s balance perspective.
Responding to the issue above, few studies have suggested that the relationship between strategic similarity and firm performance may vary depending on the research contexts. Norman, Artz, and Martinez (2007) focused on airline industry and indicated that institutional contexts may be the factors influencing the strategic similarity - firm performance relationship. In this study, they found that the relationship between non-conforming competitive actions and firm performance fits the inversely U-shaped curve during regulated period but becomes a positive linear after deregulation. In addition, Cennamo and Santalo (2013) suggested that the U-shaped result found in their study may occur due to the intense platform competition in video game industry. Following these rationales, we found the sample of Deephouse’s (1999) study, commercial banks, is a context with both high institutional and competitive pressures. As Deephouse suggested, there may be an inversely U-shaped relationship between strategic similarity and performance when both institutional
and competitive pressures are high. However, it still remains unclear whether the balance perspective can be applied in different context (e.g., in contexts with low institutional and competitive pressures) and how these two pressures would influence the strategic similarity – performance relationship systematically.
Cumulative evidence of the relationship between strategic similarity and firm performance have indubitably revealed the importance of this issue, but the inconsistent results of these studies have also raised the concern that the knowledge bases in this research stream rest on shaky ground (Hubbard, Vetter, and Little, 1998). Moreover, there may be two limitations in past studies, which make it difficult for researchers to integrate the results into a systematic knowledge. First, these studies used variant measures for strategic similarity and performance, so there may be a concern of construct equivalence and even some questions about the equivalence of the conceptual model they actually tested (Tsang and Kwan, 1999). That is, it is hard to compare the results of past studies directly to Deephouse’s results if these studies did not use the same measures. Second, most of the studies conducted in single industry, and few studies focusing on multiple industries did not test the influence of industrial characteristics such as institutional and competitive pressures on the relationship between strategic similarity and performance. It is difficult to clarify why such relationship may be different cross studies (Tsang and Kwan, 1999).
Since replication is an importance step to systematically accumulate knowledge in strategy research (Singh, Ang, and Leong, 2003), the present study aims to replicate and extend the study of Deephouse (1999). Specifically, the purposes of our study are twofold. First, we replicate the seminal study of Deephouse (1999) using cross-sectional time series data for 57,644 firms in China to test the generalizability of his findings to multiple industries. Second, we extend Deephouse’s (1999) study by developing and testing hypothesis that seeks to explain whether and, if so, how competitive pressures and institutional pressures jointly
influence the relationship between strategic similarity and firm performance.
STRATEGIC SIMILARITY AND FIRM PERFORMANCE
Deephouse (1999) propose whether a firm choosing to be similar or to be different to competitors would face great challenges eroding a firm’s performance and moderate degree of similarity increases performance. On the one hand, firms conforming to similar competitors’ strategies would face intense competition for resources and then experience diminished performance and increased possibility of failure (Baum & Mezias, 1992; Baum & Singh, 1994; Carroll, 1985). Adopting differentiating strategies allows them to enhance their competitive position (D’Aveni, 1994) and can become a source of competitive advantage (Miller and Eden, 2006; Grimm and Smith, 1997). On the other hand, firms behave departing form a range of normal strategies would face legitimacy challenges which hinder firms from acquiring resources and hurt their performance (DiMaggio & Powell, 1983). Relatively, adopting conforming strategies would reduce uncertainty of the linkage between specific action and its possible consequences (DiMaggio and Powell, 1983) and ensure firms’ access to resources necessary for survival and prosperity (Meyer and Rowan, 1977).
In addition, Deephouse (1999) used two thought experiments to demonstrate why moderate degree of strategic similarity increase performance under both strong competitive and institutional forces (See detail in Deephouse, 1999; p.153–155). The results of these thought experiments revealed that moderate strategic similarity led firms not only to avoid legitimacy challenges but also to reduce competition. Thus, firms can achieve maximum performance when gains from reduced competition are equal to the costs of legitimacy challenges. Conversely, higher or lower degree of strategic similarity will erode performance. In sum, the strategic balance proposition we wish to replicate is presented as following:
Replication proposition: Moderate degree of strategic similarity will increase performance.
THE INFLUENCE OF RELATIVE STRENGTH OF COMPETITIVE
AND INSTITUTIONAL FORCES
Deephouse (1999, p. 153) has mentioned that ‘the ultimate relationship between strategic similarity and performance then depends on the relative strength of the differentiation and conformity propositions over the range of strategic similarity.’ He also indicates that the relative strength of competitive forces to institutional forces will vary the relationship between strategic similarity and performance. However, he only investigated, conceptually and empirically, the strategic balance proposition in the context with high competitive and institutional pressures. Our knowledge of how the relative strength of two forces will affect the relationship between strategic similarity and performance is limited. Thus, the present study attempts to extend strategic balance perspective suggested by Deephouse (1999) and investigate the impact of relative strength of two forces (competitive forces and institutional forces) on the strength and patterns of the relationship between strategic similarity and performance.
Due to the conflict of avoiding legitimacy challenges and reducing competition in nature, a firm faces a trade-off between conforming and differentiating (Deephouse, 1999). As competitive pressures and institutional pressures vary on different contexts, the balance point or ’competitive cusp’ between conformity and differentiation changes as well (Porac et al., 1989). Higher institutional pressures trigger higher costs of legitimacy challenges and make necessary resources more unavailable for firms behaving non-conformity (Norman et al., 2007). In contexts with higher competitive pressures, firms differentiating themselves spend less time and costs for scarce resources and obtain superior competitive position and better profitability (Cottrell and Nault, 2004; Tirole, 1988). Combining the impact of two forces, we know that the increase in the benefits of differentiation and the decline in the costs of non-conformity may alleviate diminishing marginal benefits of differentiation when the
competitive pressures are greatly stronger than institutional pressures. On the contrary, the stronger the institutional pressures comparing to competitive pressures, the lower the benefits of differentiation and the more serious the hurt caused by non-conform. In this situation, the diminishing marginal benefits of differentiation deteriorate
Although no research has presented evidence regarding how relative strength of the two forces affect the relationship between strategic similarity and performance, few studies implied the moderating effect of competitive and institutional pressures on such relationship. For instance, Norman et al. (2007) investigated the effect of regulation on the relationship between competitive non-conformity and performance. They separated regulated and deregulated period by deregulated event of 1978 in American airline industry. During highly regulated period (comparing to deregulated period), firms faces higher institutional pressures due to potent coercive pressures from government and lower competitive pressures because regulation reduce the level of rivalry. As a result, they found competitive non-conformity and performance present inversely U-shaped relationship during regulated period and positively linear relationship after deregulated event. In addition, Cennamo and Santalo (2013) focused on the platform competition among firms in American video game industry. They found that the relationship between distinctive positioning and market share is U-shaped in a winner-take-all context triggered by network externality. In this context, not only do the diminishing marginal benefits be alleviated, but the increasing marginal benefits present. In sum, these studies correspond to our reasoning about how the relative strength of the two forces may influence the relationship between strategic similarity and performance.
In the present study, we focused on the relative strength, that is combined effects, rather than separate moderating effects of competitive and institutional pressures (on the relationship between strategic similarity and performance) based on the following reasons. First, the decision on strategic similarity is a trade-off for firms. Firms deciding to adopt
conforming strategies to avoid potential legitimacy challenges may suffer more from competitive pressure than firms do not adopt these strategies. As suggested by Deephouse, considering relative strength of the two forces is more meaningful to investigate the relationship between strategic similarity and performance. Second, these two forces are not independent. On the one hand, institutional pressures force firms to become more similar to each other and then cause higher competitive pressures (Fernandez-Alles and Valle-Cabrera, 2006). On the other hand, institutional pressure such as regulation may also become entry barriers and constrain the extent of competition (Geiger and Hoffman, 1998). As influences of the two forces are dependent, focusing on the moderating effect of relative strength of them could avoid potential bias. Thus, we extend the Deephouse’s perspective and propose as following:
Extension proposition: The relative strength of competitive pressures to institutional pressures will aggravate the diminishing marginal benefits from strategic dissimilarity.
METHODS
Data and sampleIn this study, we try to replicate as well as extend Deephouse’s (1999) study. For these purposes in mind, we followed the core procedures (e.g., the measures of main variables and model specification) of the original study in order to compare our results with those of Deephouse’s study in detail (Tsang and Kwan, 1999). Also, our study was conducted in totally different contexts from the original study in order to contribute to generalizability of the finding of Deephouse (1999). That is, we examined external validity of the relationship between strategic similarity and firm performance by being different or independent from the original study (Rosenthal, 1991). In addition, we further extend the original study and by investigating the moderating role of the relative strength of competitive and institutional pressures on strategic similarity –performance relationship in order to explain the inconsistent
results in past studies.
Accordingly, we extracted a panel dataset based on Annual Industrial Survey Database (2003–2007) of the Chinese National Bureau of Statistics (CNBS), which is different from dataset of the original study in various aspects such as country, industry, and time frame. Manufacturing firms with sales above five million RMB are regulated to submit their basic information and financial reports to CNBS annually, and firms included in CNBS contribute almost 90% industrial sales in China. This database has the most comprehensive information of manufacturing firms in China (Tian, 2007) and is representative of the population. It is also recognized as a highly reliable secondary database (Gao et al., 2009; Ju & Zhao, 2009; Tan & Peng, 2003) and has been used by many studies in strategy management and international business field. Thus, the final panel dataset including samples across thirty industries (identified by two-digit SIC code) and 155 subsectors (identified by three-digit SIC code) allows us to test the external validity across almost all manufacturing industries and to investigate how relative strength of competitive and institutional pressures affect strategic similarity –performance relationship.
We selected firms who operated in the same subsector during 2003 – 2007 as our sample. Based on the criteria, our original sample included total 107,900 firms from 32 industries and covered 31 provinces or province-equivalent municipal cities in China. We set 2003 as our start point because CNBS adjusted the Standard Industrial Classification (SIC) coding system in 2002 and data across the year may cause potential mistakes in identifying whether firms were in the same subsectors. Also, we included data by 2007 because most firms facing financial crisis in 2008 chose to reduce costs against decreasing demand. That is, few firms would adopt differentiating strategies, which means that the relationship between strategic deviation and firm performance may be distorted during this time period.
(2009) procedures and delete the following observations from the original dataset: (1) firms whose any key indicators such as profits, total assets, numbers of employees, sales were missing; (2) firms with less than eight employees (because these firms lacked reliable accounting systems) ; (3) firms for which one of the following was true: (a) total sales were smaller than sales of main business, (b) total assets were smaller than net fixed assets, (c) accumulated depreciation was smaller than current depreciation, (d) net fixed assets were smaller than or equal to zero, or (e) total costs were smaller than sales and general administrative expenses (SGA expenses); (4) firms with extreme variable values (the values of key variables are either larger than the 99.9 percentile or smaller than the 0.1 percentile). Finally, we excluded state-owned enterprises (SOEs) from our sample because SOEs’ strategies and goals were different from firms in the private sector. After the aforementioned procedure, we obtained a four-year panel data of 226,946 observations containing 57,644 firms.
Measures
For ease of presentation, we describe the measures of variables for replication and extension together. We adhered to the original model specification in Deephouse (1999) and included and controlled some potential common factors in order to test the robustness of hypothesized relationship. In addition, we added a composite industrial variable to test the moderating effect in extension.
Dependent variables
Following the measures used by Deephouse (1999), we adopted relative return on assets (ROA) as a performance indicator. Relative ROA indicated how well a firm perfoms relative to its competitors. In Deephouse’s study, he computed relative ROA for each year by mean centering a bank’s ROA in a given year. In the present study, we further standardized ROA in order to compare results cross different industries. In the following comparisons between our
and Deephouse’s results, we adjusted the relative ROA used in Deephouse (1999) to be divided by the standard deviation of ROA in the industry.
Strategic Deviation
We followed Deephouse (1999) to measure strategic similarity by strategic deviation. Strategic deviation was the degree of a firm’s strategy deviating from average strategic profile of its competitors in the same industry. Due to different resource allocation strategies of firms cross industries, we used six strategic indicators for manufacturing industries (Finkelstein and Hambrick, 1990) rather than eleven strategic indicators for bank industry to create a composite measure of strategic deviation. Six strategic indicators included (1) advertising intensity (advertising/sales), (2) research and development intensity (R&D/sales), (3) capital intensity (fixed assets/total sales), (4) nonproduction overhead (SGA expenses/sales), (5) inventory levels (inventories/sales), and (6) financial leverage (debt/total assets). The following equation illustrated the calculation of the strategic deviation for firm j in industry i.
Strategic Deviation
where Vaij is the value of strategic dimension a for firm j in industry i, ABS is the absolute
value function, M(Vai) is the mean of strategic dimension a in industry i, and SD(Pai) is its
standard deviation.
R&D expense was not included in NBS database before 2005, so summing all six indicators to create strategic deviation reduced one-year data (2004). We created strategic deviation 1 (SD1) by summing six indicators and strategic deviation 2 by summing five indicators (excluding R&D intensity). The correlation coefficient of SD1 and SD2 was extremely high (r=0.92). We used SD1 as well as SD2 to conduct analysis and the results were qualitatively similar, so we reported results based on SD2.
Relative rivalry pressure
Relative rivalry pressure was the focal construct in the extension of Deephouse and referred to the relative strength of competitive pressure to institutional pressure in a given industries and in a given year. It was a composite of competitive intensity and institutional pressure. High relative rivalry pressure reflected both high competitive intensity and low institutional pressure and vice versa. Competitive intensity was reverse Herfindahl index and measured as the sum of the squared market shares of firms in a subsector subtracted by one (Ju and Zhao, 2009). Higher value of the reverse Herfindahl index reflects the more competitive in an industry (Dess and Beard, 1984). We computed industry geographical diversification by entropy measure as a proxy of institutional pressure. Geographical diversification reflects both the extent and the consequence of institutional pressures. Institutional theorists argue that institutions in environments would develop a set of cognitive consensus and a range of normal strategies through repeated isomorphism processes (Scott, 1995). Geographical proximity or cluster allows firms to interact with each other more frequently such as sharing information and experience, establishing industrial or professional associations, and against environmental uncertainty and leads to more frequent isomorphism processes (DiMaggio & Powell, 1983). Therefore, geographical diversification is negatively associated with mimetic and normative pressures. In addition, past studies found that institutional pressures drive firms to invest in the same location (e.g., Haveman, 199) and lead lower geographical diversification. The entropy measure of geographical diversification is defined as
Geographical diversification ln 1/
Where Pi is the proportion of firms in area i and ln(1/Pi) is the weight given to each area. The
higher the geographical diversification is, the weaker the institutional pressure is. It was worth to mention that we used all firms in CNBS to compute both competitive intensity and low institutional pressure instead of cleaned sample because it provided more accurate
measures. The composite measure of relative rivalry pressure was operationalized as standardized reverse Herfindahl index multiplied by standardized entropy measure of geographical diversification.
Control variables.
Followed Deephouse (1999), we adopted lagged dependent variable, market share, total expense ratio, and market growth as control variables. The lagged dependent variable was included to control for omitted variables. Market share computed by a firm’s sales to total sales in a subsector reflected the competitive position and operating efficiency. Total expense ratio referred to the cost reduction and was measured by the ratio of total expense to total sales. Market growth operationalized by annual percent change in total sales in a subsector reflected changes in the resource environment which may affect competition and performance.
Recent studies suggested that age, size, organizational slack should be controlled when investigating the relationship between firms’ conduct and performance (Miller et al., 2007, Villalonga and Amit, 2006, Miller and Chen, 1996). Size was measured as natural logarithm of employees. Financial slack was a specific class of organizational slack that might flexibly redirect a firm’s strategic decisions (Natividad, 2013). The measure of financial slack was working capital, that is, the difference between current assets and current liabilities.
Hypotheses
Given these measures of strategic similarity, relative rivalry pressure, and performance, the following hypotheses will be used to test replication and extension propositions
Hypothesis 1 (replication): The relationship between strategic deviation and relative ROA is inversely U-shaped.
Hypothesis 2 (extension): The inversely U-shaped relationship between strategic deviation and relative ROA is positively moderated by relative rivalry pressure.
Analysis
To estimate the regression coefficients in our study, we followed the same estimation procedure by Deephouse (1999) and adopt weighted least-squares (WLS) estimation to test to test Hypothesis 1 by industries. Based on his analysis, we knew that there may be a concern about autocorrelation and heteroscedasticity when we used lagged dependent variables and panel data. weighted least-squares (WLS) estimation, He conducted Durbin’s h-statistics to test for autocorrelation (and found it was not a problem) and chose WLS in the case of heteroscedasticity. We conducted Wooldridge test to test first-order autocorrelation (Wooldridge , 2002), and the result revealed that there was an autocorrelation problem in the model (F = 6899, p<0.001) . Also, we used Modified Wald test and Sargan test to test heteroskedasticity, and the results shown that there was a heteroskedasticity issue in our panel data.
In addition, cross-sectional or spatial dependence ignored by Deephouse (1999) may lead to invalid statistical inference (Hoechle, 2007). Because social norms and psychological behavior patterns such as social learning and herd behavior typically enter panel regressions as unobservable common factors, complex forms of spatial and temporal dependence may arise even under randomly sampled conditions (Hoechle, 2007). We conducted Pesaran CD test and found significant cross-sectional dependence. In the presence of autocorrelation, heteroscedasticity, and cross-sectional dependence, the estimation of feasible generalized least squares (FGLS) and Driscoll-Kraay estimation were both reliable, but we chose Driscoll-Kraay estimation for two reasons. First, we performed Hausman test, and the result (p<.001) suggested the model should be estimated by fixed effects (within) regression. Second, FGLS was typically inappropriate for use with large-scale microeconometric panels (Hoechle, 2007). To test extension hypothesis (H2), we also used Driscoll-Kraay estimation for analysis and added relative rivalry pressure and its interaction term with both first-order
and second-order strategic deviation. Before creating the interaction term of relative rivalry pressure and squared strategic deviation, we standardized the two variables to mitigate the concern of collinearity (Aiken, West, & Reno, 1991). We used STATA statistical software for all analysis.
RESULTS
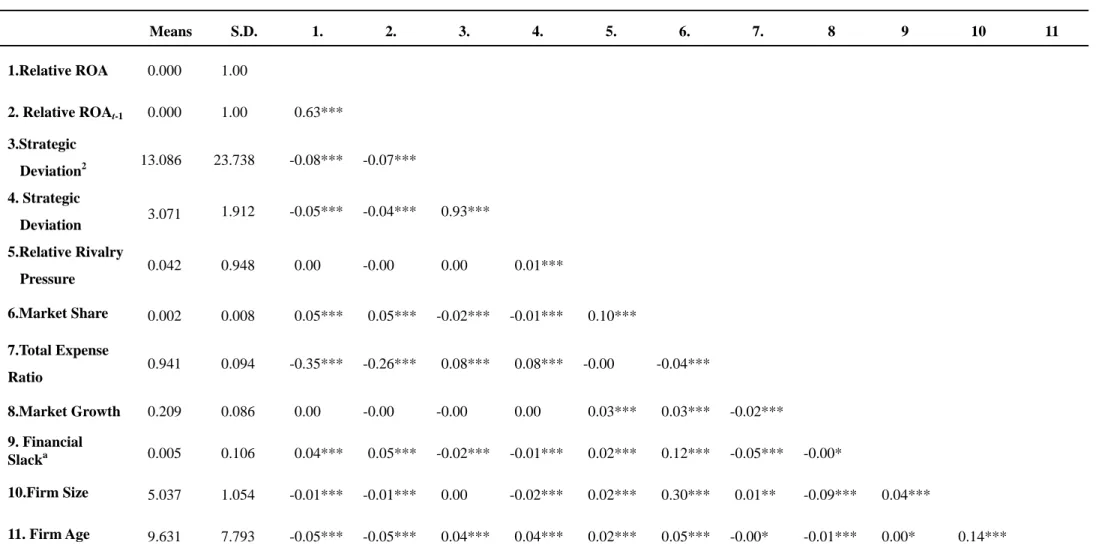
ReplicationTable 1 reports the means, standard deviations and correlations among variables. The correlation between strategic deviation and its squared term is high (r= 0.93), which implies that conllinearity is a concern. Table2 presents the results from our replication including weighted least-squares and Driscoll-Kraay estimates for aggregated sample and for thirty industries alongside the original results reported in Deephouse (1999).
To make our results comparable with Deephouse, we conducted some procedures to calibrate his regression coefficients. Firstly, the regression coefficients from Deephouse’s results were divided by 100 because he had multiplied relative ROA by 100 to simplify presentation (p.157). Then, the regression coefficients were further divided by standard deviation of relative ROA (0.007) due to the difference between our measure of relative ROA and his.
--- Insert Table 1 about here --- ---
Insert Table 2 about here ---
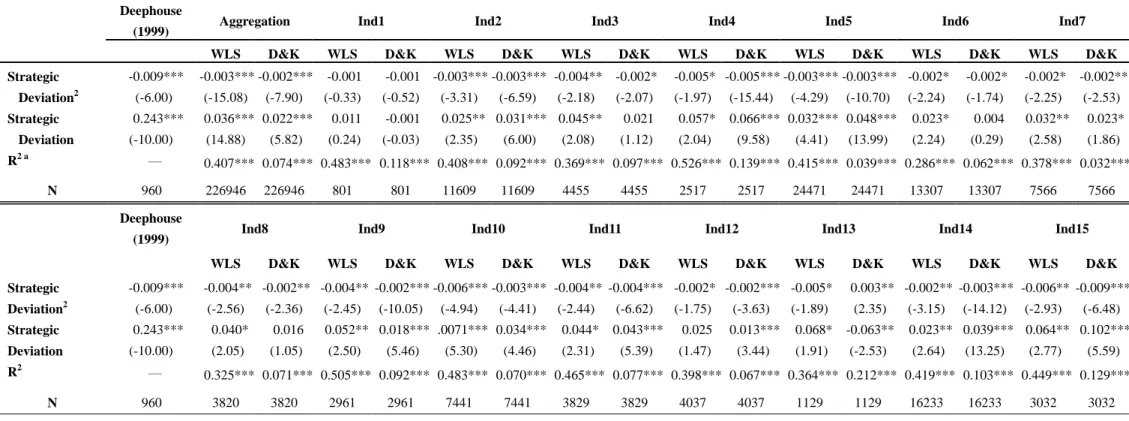
To test generalizability of strategic balance perspective across industries, we conducted analysis industry by industry except for two industries containing less than thirty firms. In
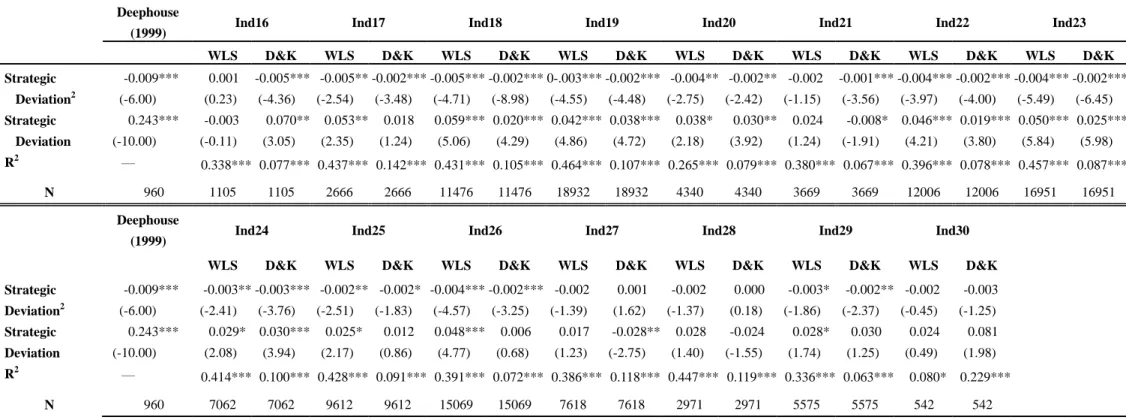
aggregated sample and most industries, the curvilinear relationship between strategic similarity and firm performance is negatively significant no matter the coefficients are estimated by WLS or Driscoll-Kraay estimation. Specifically, in twenty four of thirty and twenty five of thirty industries, the results are consistent with strategic balance propositions and supported Hypothesis 1. Even though such relationships in some industries are not significant, most of them (seven of eleven) tailor to the hypothesized direction. Overall, our results of replication tend to support Hypothesis 1 as well as Deephouse’s perspective.
According to the correlation analysis, collinearity may be a methodological concern. We further tested for collinearity and found that the main effects of collinear comes from total expense ratio and constant term although condition numbers is slightly higher than 30 (37.17). The results were broadly similar when we ruled out total expense ratio from our model, which implies that our results are not biased significantly by collinearity issue. For the purpose of comparison between our study and Deephouse’s, we still include total expense ratio in the presented models.
Comparing with results of WLS and Driscoll-Kraay estimation, the effect of squared strategic deviation are significantly contrary in only one industry. There are contrary effect in another three industry, but not significant. The results are similar in the other industries. The differences between two estimates mainly attribute to unobserved individual effect due to significant hausman test. The fixed effect model is more appropriate for analysis. But the results of these two estimates both tend to support Deephouse’s perspective. Although our results tend to support Deephouse’s perspective, the negative impact of squared strategic deviation in aggregation sample and all industries are lower than that in Deephouse’s study. The coefficients reaching significant level in our study are between -0.001 and -0.009 while it is -0.009 in Deephouse’s study.
We conducted two robustness tests to examine the sensitivity of our results. First, we used alternative measure of the dependent variable, return on sales, as a proxy for performance. The results are qualitatively similar to our core analysis. Second, we incorporated three potential common factors, that is age, size, and financial slack, as additional control variables. When using three additional controls, our results did not change. These tests show our results are robust. However, we found that age, size, and financial slack are significantly related to both strategic deviation and performance. It reveals the necessity to take them into control, so we control them in the extension analysis.
Extension
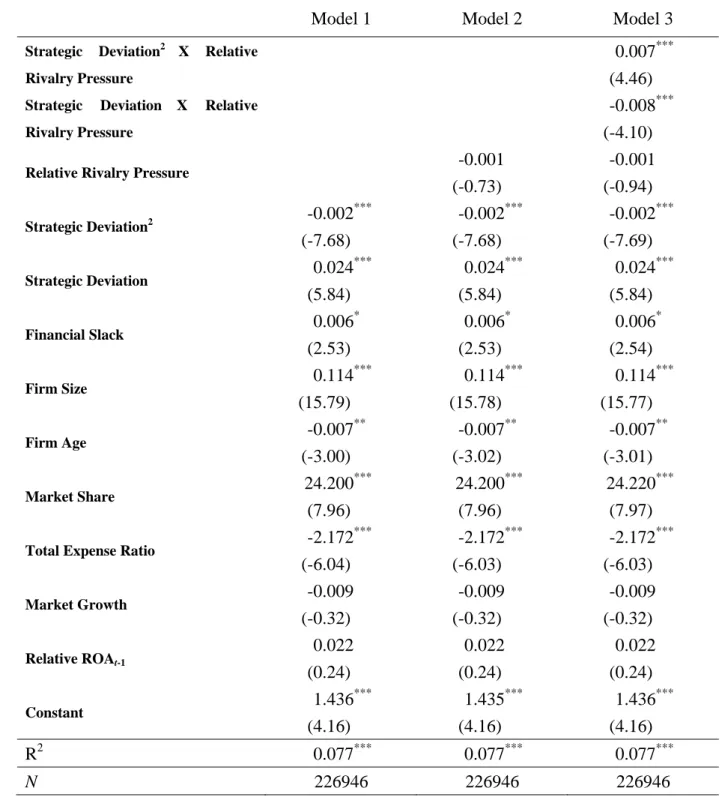
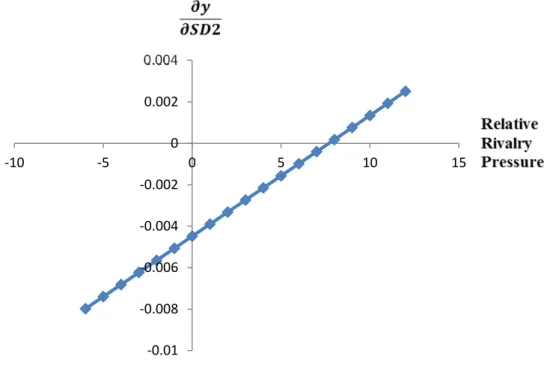
To extend the boundary of strategic balance perspective and examine industrial variance among strategic similarity – performance relationship, we introduce relative rivalry pressure as a moderator. In Table 3, Model 1 is the baseline model. In model 2 we add relative rivalry pressure, while in model 3 we introduce its interaction term with first-order and second-order strategic deviation to test Hypothesis 2. As model shows, the main effect of relative rivalry pressure on performance is not significant. However, as Model 3 indicates, the first-order interaction term (-0.008, p<0.001) has a negatively effect on performance and the second-order interaction term (0.007, p<0.001) has a postively effect on performance. In Figure 1, we graphically represent the effect of the relative rivalry pressure on change of marginal benefits of differentiation. The results not only show support to Hypothesis 2, but indicate that the inversely U-shaped strategic similarity – performance relationship does not hold, even become U-shaped relationship under very high relative rivalry pressure condition.
--- Insert Table 3 about here --- ---
Insert Figure 1 about here ---
As shown in Figure 1, when relative rivalry pressure is lower (i.e. relative lower competitive pressures to higher institutional pressures), the relationship between squared strategic deviation and performance is more negative (i.e. inversely U-shaped). As the relative rivalry pressure enhances, the negative relationship is weaken, even transforming into positive relationship. The findings not only support extension hypothesis (H2), but in line with our results in replication study. That is, inversely U-shaped relationship is present in twenty five of thirty industries, no significantly curvilinear relationship in four industries, and U-shaped relationship in only one industry. Integrating these results, it indicates that the strategic similarity – performance relationship is not always inversely U-shaped and depends on the relative strength of competitive and institutional pressures. The implications are discussed next.
DISCUSSION
In this study, we replicated and extended Deephouse’s (1999) study by examining the relationship between strategic similarity and performance across 30 industries in China and the moderating effects of relative rivalry pressure on such relationship. The major findings of the present study are summarized as following: (1) For firms in twenty five of the thirty industries, the relationship between strategic similarity and performance was inversely U-shaped; (2) The effect sizes of the squared terms of strategic deviation were all smaller than the effect sizes found in Deephouse’ study whenever we analyzed on firms in individual industry and aggregated sample and whenever we used WLS and Driscoll-Kraay estimation to estimate the value; (3) the relationship between strategic similarity and performance was not necessarily inversely U-shaped. As relative rivalry pressures increase, the diminishing marginal benefits of differentiation will be alleviated and even the increasing marginal
benefits will present.
First, our findings provided at least partial support for the strategic balance perspective. Although there may be a little difference between the values estimated by improved and original way, the results were quite similar between the two. Moreover, the relationship between strategic similarity and performance did not change even when we included more control variables to avoid possible bias caused by common factors, which implied that the strategic balance perspective developed by experience in western developed countries can be generalized to most manufacturing industries in China.
Second, the effect sizes found in our study were lower than those found by Deephouse even when we adopt the same estimation way used by Deephouse. The results revealed that the diminishing marginal benefits obtained from differentiation are alleviated more for Chinese manufacturing industry than American commercial banking industry. This difference may be caused by two reasons: (1) Deephouse identified commercial banks as firms’ competitors, whereas we identified competitors by two-digit SIC code. Based on broader rather than narrower range of definition, we may include competitors with lower interactions and consensus on strategies. The influence of institutional pressures may be weaker in our study comparing to that in Deephouse’s (1999). In addition, larger differences among firms also decrease the benefits of differentiation, which makes the effect sizes lower than those in Deephouse (1999). (2) There may be some unobserved contextual factors (e.g., national and industrial characteristics and time frame of studies) that would influence the results across studies (Mayer and Whittington, 2003). Comparing our study to Deephouse’s study, we found the variation between us may come from different countries and industries. Regarding to differences between industries, we thought the characteristics of an industry may cause relatively higher or lower competitive and institutional pressures. For instance, banking industry in the U.S. is highly regulated (Deephouse, 1999) and contains many associations.
Firms in this industry are influenced by similar social groups such as financial press, and thus face higher institutional forces including coercive, mimetic, and normative pressures than firms in manufacturing industry. Regarding to the differences between countries, past studies indicated that one of the characteristics of transition economies such as China is dramatically intensified market competition (Peng, 2003). Because privately held firms in transition economies have shorter life-spans and operate under tight budgets in increasingly competitive markets (Perkins, 1994), firms’ capabilities to choose strategies may be constrained. This may affect their performance and the relationship between strategic similarity and performance. Even if we conducted our study with a broader definition of competitors and in a transition economy, our results still support the finding in Deephouse (1999), revealing the robustness of the strategic balance perspective suggested by Deephouse (1999).
Third, we extend strategic balance perspective and found the relative strength of competitive forces to institutional forces influences on the strength and patterns of strategic similarity – performance relationship. Although moderate degree of strategic similarity increases performance in most contexts in line with Deephouse’s perspective, the benefits from differentiating increase and the costs of non-conformity decrease as relative rivalry pressure enhances. It provides rational from firms to differentiate themselves more when competitive pressures are greatly stronger than institutional pressures. Our findings not only extend our knowledge of strategic similarity – performance relationship, but are complement to strategic change literature. The relationship between strategic change and performance depends on the dynamic fitting processes between organizations and their environments (Zajac, Kraatz, and Bresser, 2000). Our findings imply that the balance point or competitive cusp between conformity and differentiation in a given context (and in a given time) reflects organizational strategies fit external environments. For example, when environment changes such deregulated event in American airline industry, firms should adjust their strategies to be
more different from competitors in order to fit the context with decreasing institutional pressure and increasing competition again. Our findings provide practical contribution on how to detect environment, to detect what kinds of environment (that is institutional pressures and competitive pressures), and how to adjust firms strategies to obtain better performance. The impact of relative strength of competitive forces to institutional forces on strategic similarity – performance relationship remains an interesting empirical question. On the one hand, firms can not only take strategies as a whole and be compromise between conformity and differentiation, but also conform in some core attributes which are the source of legitimacy and differentiate in some new attributes (e.g. Porac et al., 1989). The validity of this kind of ‘two step’ solutions to balancing on the competitive cusp (Porac et al., 1989) may also depends on the relative strength of two forces. On the other hand, institutional pressures and competitive pressures both are complex concepts. For example, institutional pressures include coercive, normative, and mimetic pressures (DiMaggio and Powell, 1983), while competitive intensity is one of the sources of competition. Technology race and network externality are suggested as triggers of competition and lead firms to take aggressive strategies (Shapiro and Varian, 1999). What is the relationship between different kinds of institutional pressures and competitive pressures? How they affect the relationship between strategic similarity and performance? We still lack of understanding of these questions.
Limitations
The present study generalizes the strategic balance perspective to all manufacturing industries in China. There are several limitations that reveal the need for more replications. First, we used broader definition to identify competitors than Deephouse (1999). Although we demonstrated strategic balance theory could generalize to all manufacturing industries in China, the broader definition of competitors may lead to underestimate the diminishing marginal benefits from differentiation, as we mentioned in discussion. It raises the hazards of
type II error, but our results still support the testing hypothesis. Second, our dataset only contains manufacturing firms in China, so we are not able to compare our results with commercial banks in China and manufacturing firms in U.S. to detect the variances from the differences across industries and countries. These two limitations show the necessity to conduct replication studies systematically (Hubbard et al., 1998) to further test the internal validity and external validity of the relationship between relative rivalry pressures, strategic similarity, and performance.
Conclusion
Investigating the generalizability of strategic balance perspective and the moderator role of relative strength of competitive pressures to institutional pressures generates several new insights. First, after analyzing data across 30 industries in China and after conducting a number of robust tests, the strategic balance proposition on the relationship between strategic similarity and performance is at least partial supported. Second, the relative strength of competitive pressures to institutional pressures mitigates the diminishing marginal benefits from differentiation. When the relative rivalry pressures are higher enough, the patterns of inversely U-shaped relationship between strategic similarity and performance will be transformed into linear or U-shaped relationship. Our study also show the need for further systematically replications.
REFERENCES
Aiken, LS. West, SG. Reno, RR. 1991. Multiple regression: Testing and interpreting interactions. Newbury Park, CA: Sage.
Baum, JAC. Mezias, SJ. 1992. Localized competition and organizational failure in the Manhattan hotel industry, 1898–1990. Administrative Science Quarterly, 37: 580–604.
Baum, JAC. Oliver, C. 1992. Institutional embeddedness and the dynamics of organizational populations. American Sociological Review 57: 540–559.
Boon, C. Paauwe, J. Boselie, P. Hartog, DD. 2009. Institutional pressures and HRM: developing institutional fit. Personnel Review 38(5): 492-508
Cai, H. Liu, Q. 2009. Competition and corporate tax avoidance: Evidence from Chinese industrial firms. The Economic Journal, 119: 764-795.
Carroll, GR. 1985. Concentration and specialization: Dynamic of niche width in populations of organizations. American Journal of Sociology, 90: 1262–1283.
Cennamo, C. Santalo, J. 2013. Platform competition: Strategic trade-offs in platform markets. Strategic Management Journal 34: 1331-1350.
Cottrel T, Nault BR. 2004. Product variety and firm survival in the microcomputer software industry. Strategic Management Journal 25(10): 1005–1025.
D’Aveni, RA. 1994. Hypercompetition. Free Press, New York.
Deephouse, DL. 1999. To be different, or to be the same? It's a question (and theory) of strategic balance. Strategic Management Journal, 20: 147–166.
Dess, GG. Beard, DW. 1984. Dimensions of organizational task environments. Administrative Science Quarterly, 29(1): 52–63.
DiMaggio, PJ. Powell, WW. 1983. The iron cage revisited: Institutional isomorphism and collective rationality in organizational fields. American Sociological Review, 48: 147–160.
Ferna´ndez-Alles, M. Valle-Cabrera, R. 2006. Reconciling institutional theory with organizational theories: How neoinstitutionalism resolves five paradoxes. Journal of Organizational Change 19(4): 503–517
Geiger SW. Hoffman JJ. 1988. The impact of the regulatory environment and corporate level diversification on firm performance. Journal of Managerial Issues 10(4):439–53.
Grimm, CM. Smith, KG. 1997. Strategy as action: Industry rivalry and coordination. Cincinnati, OH: South-Western College Publishing.
Gao, GY. Murray, JY. Kotabe, M. Lu, J. 2010. A “strategy tripod” perspective on export behaviors: Evidence from domestic and foreign firms based in an emerging economy. Journal of International Business Studies 41:
Haveman, H. A. 1993. Follow the leader: Mimetic isomorphism and entry into new markets. Administrative Science Quarterly, 38: 593-627.
Hoechle, D. 2007. Robust standard errors for panel regressions with cross-sectional dependence. Stata Journal 7: 281.-298.
Hubbard, R. Vetter, DE. Little, EL. 1998. Replication in strategic management: Scientific testing for validity, generalizability, and usefulness. Strategic Management Journal, 19(3): 243–254
Ju, M. Zhao, H. 2009. Behind organizational slack and firm performance in China: The moderating roles of ownership and competitive intensity. Asia Pacific Journal of Management, 26: 701-717.
Kale, S. Arditi, D. 2003. Differentiation, conformity, and construction firm performance. Journal of Management in Engineering 19(2): 52–59.
Lamertz, K. Heugens, PPMAR. Calmet, L. 2005. The configuration of organizational images among firms in the Canadian beer brewing industry. Journal of Management Studies 42(4): 817–843
Meyer JW, Rowan B. 1977. Institutionalized organizations: Formal structure as myth and ceremony. American Journal of Sociology 83(2): 340–363.
Mayer, M. Whittington, R. 2003. Diversification in context: A cross-national and cross-temporal extension. Strategic Management Journal 24(8): 773-781.
Miller, D. Chen. M-J. 1996. Nonconformity in competitive repertoires: A sociological view of markets. Social Forces 74(4): 1209–1234.
Miller, D. Le Breton-Miller, I. Lester, RH. Cannella. AA. 2007. Are family firms really superior performers? Journal Corporate Finance 13(5): 829–858.
Miller SR, Eden L. 2006. Local density and foreign subsidiary performance. Academy Manage Journal 49(2): 341–55.
Natividad, G. 2013. Financial slack, strategy, and competition in movie distribution. Organization Science, 24(3): 846-864.
Norman, PM. Artz, KW. Martinez, RJ. 2007. Does it pay to be different? Competitive non-conformity under different regulatory regimes. Journal of Business Research 60: 1135–1143.
Oerlemans, LAG. Meeus, MTH. 2005. Do organizational and spatial proximity impact on firm performance? Regional Studies 39(1):89–104.
Peng, MW. 2003. Institutional transitions and strategic choices. Academy of Management Review, 28(2): 275– 296.
Perkins, D. 1994. Completing China's move to the market. Journal of Economic Perspectives 8(2): 23–46. Porac, JF. Thomas, H. Baden-Fuller, C. 1989. Competitive groups as cognitive communities: The case of Scottish knitwear manufacturers. Journal of Management Studies, 26: 397–416.
Robinson, KC. McDougall, PP. 2001. Entry barriers and new venture performance: A comparison of universal and contingency approaches. Strategic Management Journal, Special Issue 22: 659–685.
Rosenthal, R. 1979. The "file drawer problem" and tolerance for null results. Psychological Bulletin, 86: 638-641.
Scott, WR. 1995. Institutions and Organizations, Thousand Oaks, CA: Sage.
Shapiro, C. Varian, HR. 1999. The art of standards wars. California Management Review 41(2): 8–32. Singh, K. Ang, SH. Leong, SM. 2003. Increasing replication for knowledge accumulation in strategy research. Journal of Management, 29(4): 533–549.
Tan, J. Peng, MW. 2003. Organizational slack and firm performance during economic transitions: Two studies from an emerging economy. Strategic Management Journal, 24: 1249-1263.
Tan, J. Shao, Y. Li, W. 2013. To be different, or to be the same? An exploratory study of isomorphism in the cluster. Journal of Business Venturing 28: 83–97.
Tian X. 2007. Accounting for sources of FDI technology spillovers: Evidence from China. Journal of International Business Studies 38: 147–159
Tirole J. 1988. The Theory of Industrial Organization. MIT Press: Cambridge, MA.
Tsang, E. Kwan, K. 1999. Replication and theory development in organizational science: A critical realist perspective. Academy of Management Review, 24(4): 759–780.
Villalonga, B. Amit, R. 2006. How do family ownership, management, and control affect firm value? Journal of Financial Economy 80(2) 385–417.
Wooldridge, J. 2002. Econometric analysis of cross-sec tion and panel data. Cambridge, MA: MIT Press. Zajac, EJ. Kraatz, MS. Bresser, RF. 2000, Modeling the dynamics of strategic fit: A normative approach to strategic change. Strategic Management Journal, 21, 429–455.
Table 1 Descriptive Statistics and Correlations
Means S.D. 1. 2. 3. 4. 5. 6. 7. 8 9 10 11 1.Relative ROA 0.000 1.00 2. Relative ROAt-1 0.000 1.00 0.63*** 3.Strategic Deviation2 13.086 23.738 -0.08*** -0.07*** 4. Strategic Deviation 3.071 1.912 -0.05*** -0.04*** 0.93*** 5.Relative Rivalry Pressure 0.042 0.948 0.00 -0.00 0.00 0.01*** 6.Market Share 0.002 0.008 0.05*** 0.05*** -0.02*** -0.01*** 0.10*** 7.Total Expense Ratio 0.941 0.094 -0.35*** -0.26*** 0.08*** 0.08*** -0.00 -0.04*** 8.Market Growth 0.209 0.086 0.00 -0.00 -0.00 0.00 0.03*** 0.03*** -0.02*** 9. Financial Slacka 0.005 0.106 0.04*** 0.05*** -0.02*** -0.01*** 0.02*** 0.12*** -0.05*** -0.00* 10.Firm Size 5.037 1.054 -0.01*** -0.01*** 0.00 -0.02*** 0.02*** 0.30*** 0.01** -0.09*** 0.04*** 11. Firm Age 9.631 7.793 -0.05*** -0.05*** 0.04*** 0.04*** 0.02*** 0.05*** -0.00* -0.01*** 0.00* 0.14*** n = 226,946 * p < 0.05, ** p < 0.01, *** p < 0.001
Table 2 Results of Replicative Regression Analysis
Deephouse
(1999) Aggregation Ind1 Ind2 Ind3 Ind4 Ind5 Ind6 Ind7
WLS D&K WLS D&K WLS D&K WLS D&K WLS D&K WLS D&K WLS D&K WLS D&K
Strategic Deviation2 -0.009*** (-6.00) -0.003*** (-15.08) -0.002*** (-7.90) -0.001 (-0.33) -0.001 (-0.52) -0.003*** (-3.31) -0.003*** (-6.59) -0.004** (-2.18) -0.002* (-2.07) -0.005* (-1.97) -0.005*** (-15.44) -0.003*** (-4.29) -0.003*** (-10.70) -0.002* (-2.24) -0.002* (-1.74) -0.002* (-2.25) -0.002** (-2.53) Strategic Deviation 0.243*** (-10.00) 0.036*** (14.88) 0.022*** (5.82) 0.011 (0.24) -0.001 (-0.03) 0.025** (2.35) 0.031*** (6.00) 0.045** (2.08) 0.021 (1.12) 0.057* (2.04) 0.066*** (9.58) 0.032*** (4.41) 0.048*** (13.99) 0.023* (2.24) 0.004 (0.29) 0.032** (2.58) 0.023* (1.86) R2 a ─ 0.407*** 0.074*** 0.483*** 0.118*** 0.408*** 0.092*** 0.369*** 0.097*** 0.526*** 0.139*** 0.415*** 0.039*** 0.286*** 0.062*** 0.378*** 0.032*** N 960 226946 226946 801 801 11609 11609 4455 4455 2517 2517 24471 24471 13307 13307 7566 7566 Deephouse
(1999) Ind8 Ind9 Ind10 Ind11 Ind12 Ind13 Ind14 Ind15
WLS D&K WLS D&K WLS D&K WLS D&K WLS D&K WLS D&K WLS D&K WLS D&K
Strategic Deviation2 -0.009*** (-6.00) -0.004** (-2.56) -0.002** (-2.36) -0.004** (-2.45) -0.002*** (-10.05) -0.006*** (-4.94) -0.003*** (-4.41) -0.004** (-2.44) -0.004*** (-6.62) -0.002* (-1.75) -0.002*** (-3.63) -0.005* (-1.89) 0.003** (2.35) -0.002** (-3.15) -0.003*** (-14.12) -0.006** (-2.93) -0.009*** (-6.48) Strategic Deviation 0.243*** (-10.00) 0.040* (2.05) 0.016 (1.05) 0.052** (2.50) 0.018*** (5.46) .0071*** (5.30) 0.034*** (4.46) 0.044* (2.31) 0.043*** (5.39) 0.025 (1.47) 0.013*** (3.44) 0.068* (1.91) -0.063** (-2.53) 0.023** (2.64) 0.039*** (13.25) 0.064** (2.77) 0.102*** (5.59) R2 ─ 0.325*** 0.071*** 0.505*** 0.092*** 0.483*** 0.070*** 0.465*** 0.077*** 0.398*** 0.067*** 0.364*** 0.212*** 0.419*** 0.103*** 0.449*** 0.129*** N 960 3820 3820 2961 2961 7441 7441 3829 3829 4037 4037 1129 1129 16233 16233 3032 3032
t statistics in parentheses * p < 0.05, ** p < 0.01, *** p < 0.001 One-tailed test.
Table 2 continue Results of Replicative Regression Analysis
Deephouse
(1999) Ind16 Ind17 Ind18 Ind19 Ind20 Ind21 Ind22 Ind23
WLS D&K WLS D&K WLS D&K WLS D&K WLS D&K WLS D&K WLS D&K WLS D&K
Strategic Deviation2 -0.009*** (-6.00) 0.001 (0.23) -0.005*** (-4.36) -0.005** (-2.54) -0.002*** (-3.48) -0.005*** (-4.71) -0.002*** (-8.98) 0-.003*** (-4.55) -0.002*** (-4.48) -0.004** (-2.75) -0.002** (-2.42) -0.002 (-1.15) -0.001*** (-3.56) -0.004*** (-3.97) -0.002*** (-4.00) -0.004*** (-5.49) -0.002*** (-6.45) Strategic Deviation 0.243*** (-10.00) -0.003 (-0.11) 0.070** (3.05) 0.053** (2.35) 0.018 (1.24) 0.059*** (5.06) 0.020*** (4.29) 0.042*** (4.86) 0.038*** (4.72) 0.038* (2.18) 0.030** (3.92) 0.024 (1.24) -0.008* (-1.91) 0.046*** (4.21) 0.019*** (3.80) 0.050*** (5.84) 0.025*** (5.98) R2 ─ 0.338*** 0.077*** 0.437*** 0.142*** 0.431*** 0.105*** 0.464*** 0.107*** 0.265*** 0.079*** 0.380*** 0.067*** 0.396*** 0.078*** 0.457*** 0.087*** N 960 1105 1105 2666 2666 11476 11476 18932 18932 4340 4340 3669 3669 12006 12006 16951 16951 Deephouse
(1999) Ind24 Ind25 Ind26 Ind27 Ind28 Ind29 Ind30
WLS D&K WLS D&K WLS D&K WLS D&K WLS D&K WLS D&K WLS D&K
Strategic Deviation2 -0.009*** (-6.00) -0.003** (-2.41) -0.003*** (-3.76) -0.002** (-2.51) -0.002* (-1.83) -0.004*** (-4.57) -0.002*** (-3.25) -0.002 (-1.39) 0.001 (1.62) -0.002 (-1.37) 0.000 (0.18) -0.003* (-1.86) -0.002** (-2.37) -0.002 (-0.45) -0.003 (-1.25) Strategic Deviation 0.243*** (-10.00) 0.029* (2.08) 0.030*** (3.94) 0.025* (2.17) 0.012 (0.86) 0.048*** (4.77) 0.006 (0.68) 0.017 (1.23) -0.028** (-2.75) 0.028 (1.40) -0.024 (-1.55) 0.028* (1.74) 0.030 (1.25) 0.024 (0.49) 0.081 (1.98) R2 ─ 0.414*** 0.100*** 0.428*** 0.091*** 0.391*** 0.072*** 0.386*** 0.118*** 0.447*** 0.119*** 0.336*** 0.063*** 0.080* 0.229*** N 960 7062 7062 9612 9612 15069 15069 7618 7618 2971 2971 5575 5575 542 542
t statistics in parentheses * p < 0.05, ** p < 0.01, *** p < 0.001 One-tailed test.
Table 3 Results of Extensive Regression Analysis
Model 1 Model 2 Model 3
Strategic Deviation2 X Relative Rivalry Pressure
0.007***
(4.46)
Strategic Deviation X Relative
Rivalry Pressure
-0.008***
(-4.10)
Relative Rivalry Pressure -0.001 -0.001
(-0.73) (-0.94) Strategic Deviation2 -0.002 *** -0.002*** -0.002*** (-7.68) (-7.68) (-7.69) Strategic Deviation 0.024 *** 0.024*** 0.024*** (5.84) (5.84) (5.84) Financial Slack 0.006 * 0.006* 0.006* (2.53) (2.53) (2.54) Firm Size 0.114 *** 0.114*** 0.114*** (15.79) (15.78) (15.77) Firm Age -0.007 ** -0.007** -0.007** (-3.00) (-3.02) (-3.01) Market Share 24.200 *** 24.200*** 24.220*** (7.96) (7.96) (7.97)
Total Expense Ratio -2.172
*** -2.172*** -2.172*** (-6.04) (-6.03) (-6.03) Market Growth -0.009 -0.009 -0.009 (-0.32) (-0.32) (-0.32) Relative ROAt-1 0.022 0.022 0.022 (0.24) (0.24) (0.24) Constant 1.436 *** 1.435*** 1.436*** (4.16) (4.16) (4.16) R2 0.077*** 0.077*** 0.077*** N 226946 226946 226946 t statistics in parentheses * p < 0.05, ** p < 0.01, *** p < 0.001 One-tailed test for hypothesis; two-tailed for controls.
Figure 1 The relationship between relative rivalry pressure and marginal effect of squared strategic deviation on firm performance
‐0.01 ‐0.008 ‐0.006 ‐0.004 ‐0.002 0 0.002 0.004 ‐10 ‐5 0 5 10 15
科技部補助計畫衍生研發成果推廣資料表
日期:2015/07/30科技部補助計畫
計畫名稱: 財務餘裕資源、公司策略與績效之研究—新興經濟體之實證 計畫主持人: 于卓民 計畫編號: 103-2410-H-004-191- 學門領域: 國際企業無研發成果推廣資料
計畫主持人:于卓民 計畫編號: 103-2410-H-004-191-計畫名稱:財務餘裕資源、公司策略與績效之研究—新興經濟體之實證 量化 成果項目 實際已達成 數(被接受 或已發表) 預期總達成 數(含實際已 達成數) 本計畫實 際貢獻百 分比 單位 備 註 ( 質 化 說 明:如 數 個 計 畫 共 同 成 果、成 果 列 為 該 期 刊 之 封 面 故 事 ... 等) 期刊論文 0 0 100% 研究報告/技術報告 0 0 100% 研討會論文 0 0 100% 篇 論文著作 專書 0 0 100% 申請中件數 0 0 100% 專利 已獲得件數 0 0 100% 件 件數 0 0 100% 件 技術移轉 權利金 0 0 100% 千元 碩士生 0 0 100% 博士生 2 2 100% 博士後研究員 0 0 100% 國內 參與計畫人力 (本國籍) 專任助理 0 0 100% 人次 期刊論文 0 0 100% 研究報告/技術報告 0 0 100% 研討會論文 0 0 100% 篇 論文著作 專書 0 0 100% 章/本 申請中件數 0 0 100% 專利 已獲得件數 0 0 100% 件 件數 0 0 100% 件 技術移轉 權利金 0 0 100% 千元 碩士生 0 0 100% 博士生 0 0 100% 博士後研究員 0 0 100% 國外 參與計畫人力 (外國籍) 專任助理 0 0 100% 人次
其他成果