國立政治大學
企業管理研究所(
MBA 學位學程)
碩士論文
運用文字探勘技術分析金融科技之發展與趨勢
Applying Text Mining Techniques to the Development and
Trends of Fintech’s Patent
指導教授:洪為璽 教授
研究生:郝紹君
摘要
現今科技日新月異,不斷突破創新,產業環境變動的步調也越來越快,新竄出 之金融科技(Finance Technology)的應用,使得許多企業越加注重技術方面的研發 創新,尤其,善加運用專利資訊能有效節省研發經費與時間。因此如何有效運用 專利是企業維持競爭優勢不可或缺的一環。 有鑑於此,本研究搜集近年各國專利資料庫之專利資料,將資料分為三個時期, 並區分申請中與已申請之專利資料,透過文字探勘技術與機會探索分析出金融科 技 之 發 展 與 趨 勢 , 了 解 各 時 期 詞 彙 間 之 關 聯 性 與 差 異 , 再 搭 配 視 覺 化 工 具 KeyGraph,以描繪出金融科技領域之相關詞彙關聯趨勢圖,挖掘未來潛在趨勢。 本研究之結果了解金融科技在各時期的趨勢發展變化與尋求脈絡,以及過去 各時期之專利佈局,因而從結果中發現金融科技之發展方向主體為支付領域,許 多支付科技接連出現在三個時期中。然而近幾年,其他金融領域如投資、融資、 保險、資料分析等也漸漸浮出,從本研究之第三個時期的高頻字詞高達34 個可看 出,可見金融科技之專利發展佈局已快速從支付領域拓展至其他金融領域。本研 究所挖掘出之潛在趨勢顯示了未來金融科技領域中將會有五大重點發展領域,分 別為服務整合領域之雲端科技、支付領域之生物辨識與穿戴支付與加密貨幣、資 料分析領域之機器學習與人工智慧、信息收集與處理領域之遠程信息處理科技、 以及理財投資領域之理財機器人。 期望本研究結果能幫助企業,在面臨新科技不斷衝擊產業,而產業不斷尋求 創新發展之下,能夠快速檢閱目前市場趨勢,藉此釐清並改善自身之發展策略, 以因應外部環境之變動,提供企業作為金融科技發展之策略參考,也能有助於企 業釐清與制定金融科技之投資方向,以擁有持續的競爭優勢。 關鍵字: 文字探勘、金融科技、專利趨勢分析、機會探索、關鍵圖
Abstract
Nowadays, with the rapid advancement of information technologies, the changes of business environment and the way to deal with the changes are becoming faster and faster. The development and adoption of new financial technologies has made many enterprises pay more attention to the research and development (R&D) initiatives. Besides, making good use of patent information can effectively save the budget and time of R&D, so how to effectively use patent information is an indispensable part for enterprises to maintain their competitive advantages.
This study collected the patent data from the national patent database, and divided the data into three periods, and distinguished the data between the applying and the applied patents. Through the text mining techniques and chance discovery, this study explored the development and trends of financial technology and also aimed to understand the relevance and differences between the major terms in each period. Then, with the visual tool, KeyGraph, this study illustrated the associations between related terms, and proposed the potential future trends based on the graphs.
The results of this study help monitor the changes of the trends and financial technology’s development in the three periods, and understand the patent portfolios in each period. This study has found that the main direction of financial technology’s development is the payment field. Many technologies related to payment have successively appeared in the three periods. However, in recent years, other financial areas such as investment, financing, insurance, data analysis and other areas are gradually emerging, since we found 34 high-frequency terms in the third period. This also shows that the development of financial technology’s patent portfolios has expanded from payment to other financial areas. The potential trends of financial technology’s development in this study are five areas, namely, technologies of cloud, biometric and wearable payment and cryptocurrency, machine learning and artificial intelligence, telematics technology, and robo-advisors.
It is expected that this study can serve as a reference for the development of financial technology, and help enterprises be able to quickly review their current market trends, clarify and improve their own R&D strategies to respond to the changes in the external environment. Also, it is hoped that the results can help enterprises clarify and develop their own investment directions to maintain competitive advantages.
致謝
首先,感謝指導教授洪為璽老師於論文、平時處事等各方的關照並給予學生 指導,且於學生不懂之處耐心的與學生進行討論,才能有今天的成果。感謝口試 委員們撥空參與,給予學生精闢見解及寶貴建議,使得學生的論文更加完善。 碩士生涯的兩年中,家人的支持與陪伴,帶給我相當大的力量,在我徬徨無 助時,家人是我最堅強的後盾,默默的付出與關懷我。這兩年來時常一同闖關的 104 戰友們,與你們互相打氣及祝福,使得在每一關卡上都能過關,感謝你們於平 時、論文、課業或是在各類研究中的幫忙,有你們的陪伴與大力相助,一同奮戰, 撐過了各式各樣不同的關卡,才能有今日這美好的成果,真的很感謝各位。 最後,感謝曾經幫助過我的人,有你/妳們的協助與包容,才能讓我走到現在, 完成論文、完成學業,有你/妳們真好,很高興能認識各位並得到各位無私的協助, 謝謝你們。 郝紹君 謹識於 國立政治大學 企業管理研究所(MBA 學位學程) 中華民國 一○六年七月List of Tables
摘 要 ... 2 ABSTRACT ... 2 致 謝 ... 3 LIST OF FIGURE ... 7 LIST OF TABLE ... 8 CHAPTER 1 INTRODUCTION ... 91.1 BACKGROUND INFORMATION AND RESEARCH MOTIVATION ... 9
1.2 PURPOSES AND QUESTIONS ... 13
1.3 THESIS OUTLINE ... 14
CHAPTER 2 LITERATURE REVIEW ... 16
2.1 OVERVIEW OF FINTECH ... 16
2.1.1 Definition _______________________________________________________ 16 2.1.2 Fintech Trend Analysis _____________________________________________ 21 2.2 PATENT ANALYSIS FOR TRENDS ... 23
2.2.1 Value of Patent Information and Analysis ______________________________ 23 2.2.2 Patent Trend Analysis ______________________________________________ 27 2.3 TEXT MINING ... 28
2.3.1 Definition and Related Research Areas ________________________________ 29 2.3.2 Text-Mining-Based Patent Trend Analysis ______________________________ 31 2.4 CHANCE DISCOVERY ... 32
2.4.1 Definition ______________________________________________________ 32 2.4.2 Related Works of Chance Discovery _________________________________ 33 CHAPTER 3 RESEARCH METHODOLOGY ... 35
3.1RESEARCH METHOD ... 35
3.1.1 Overview ________________________________________________________ 35 3.1.2 N-gram _________________________________________________________ 35 3.1.3 KeyGraph _______________________________________________________ 36 3.2RESEARCH PROCESS ... 43
CHAPTER 4 RESULTS AND DISCUSSIONS ... 47
4.1STATUS OF FINAL DATA SET ... 47
4.1.1 Data Collection and Data Cleansing __________________________________ 47 4.1.2 Data Integration and Clustering _____________________________________ 49 4.2DATA ANALYSIS ... 50 4.2.1 Step One: Word Preprocess _________________________________________ 50
4.2.2 High-frequent Terms Extraction ______________________________________ 51
4.2.3 Links Extraction __________________________________________________ 53
4.2.4 Key Terms Extraction ______________________________________________ 53
4.2.5 Key Links Extraction _______________________________________________ 55
4.2.6 Key terms Extraction ______________________________________________ 55
4.3KEYGRAPH OF THE PERIODS ... 56
4.3.1 1998 to 2004 Terms’ Association Graph _______________________________ 56 4.3.2 2005 to 2010 Terms’ Association Graph _______________________________ 63 4.3.3 2011 to 2017 Terms’ Association Graph _______________________________ 70 4.4CROSS COMPARISON AND DISCUSSIONS ... 79
CHAPTER 5 CONCLUSION AND SUGGESTIONS ... 84
5.1CONCLUSION ... 84
5.2RESEARCH CONTRIBUTIONS AND LIMITATIONS ... 88
5.3FUTURE RESEARCH ... 91 REFERENCES ... 93
List of Figure
Figure 1: Quarterly Global Investment and Financing Trends to VC-Backed Fintech Companies _____ 11 Figure 2: Research Strategy Flow Chart of this study ______________________________________ 15 Figure 3: KeyGraph Illustration _______________________________________________________ 38 Figure 4: KeyGraph Calculation Process ________________________________________________ 38 Figure 5: Double-Helical Model _______________________________________________________ 42 Figure 6: Research Framework and Process _____________________________________________ 43 Figure 7: Data Cleansing Rules _______________________________________________________ 48 Figure 8: Six Steps of KeyGraph _______________________________________________________ 50 Figure 9: Terms’ Association Graph of Issued Patents in the First Period _______________________ 57 Figure 10: Terms’ Association Graph of Applied Patents in the First Period _____________________ 59 Figure 11: Terms’ Association Graph of Issued Patents in the Second Period ____________________ 64 Figure 12: Terms’ Association Graph of Applied Patents in the Second Period __________________ 67 Figure 13: Terms’ Association Graph of Issued Patents in the Third Period _____________________ 71 Figure 14: Terms’ Association Graph of Applied Patents in the Third Period ____________________ 75 Figure 15: Cross Comparison between Three Periods ______________________________________ 83List of Table
Table 1: The Summary of the Definition of Fintech by Scholars ... 18 Table 2: The Summary of Recent Researches about Fintech Trend Analysis ... 22 Table 3: The Practical Application Field of Patent Trend Analysis ... 25 Table 4: The Summarized Literature Applications of Patent Trend Analysis ... 28 Table 5: The Summarized Method of Text-Mining-Based Patent Trend Analysis ... 31 Table 6: The Summarized Literature Applications of Chance Discovery ... 34 Table 7: The Summary of Data Cleansing and the Amount of the Remaining Data ... 48 Table 8: The Summary of Data Clustering ... 49 Table 9: The Demonstration of Numbers of Key terms in Each Period ... 51 Table 10: Lists of High-frequent Terms (Example of issued patent from1998 to 2004) ... 52 Table 11: Lists of Final Thresholds of All Data ... 52 Table 12: Lists of Low-frequent Terms (Example of issued patent from1998 to 2004) ... 54 Table 13: Lists of the Weight of Low-frequent Terms (Example of issued patent from1998 to 2004) ... 54 Table 14: Lists of Sorted Terms with Weight and Total Numbers of Co-occurrences ... 57 Table 15: Relationship between High-weighted Terms and Key Terms in Issued Data of the First Period ... 58 Table 16: Lists of Sorted Terms with Weight and Total Numbers of Co-occurrences ... 59 Table 17: Relationship between High-weighted Terms and Key Terms in Applied Data of the First Period ... 60 Table 18: Lists of Sorted Terms with Weight and Total Numbers of Co-occurrences ... 64 Table 19: Relationship between High-weighted Terms and Key Terms in Issued Data of the Second Period ... 65 Table 20: Lists of Sorted Terms with Weight and Total Numbers of Co-occurrences ... 67 Table 21: Relationship between High-weighted Terms and Key Terms in Applied Data of the Second Period ... 68 Table 22: Lists of Sorted Terms with Weight and Total Numbers of Co-occurrences ... 71 Table 23: Relationship between High-weighted Terms and Key Terms in Issued Data of the Third Period ... 73 Table 24: Lists of Sorted Terms with Weight and Total Numbers of Co-occurrences ... 75 Table 25: Relationship between High-weighted Terms and Key Terms in Applied Data of the Third Period ... 76Chapter 1 Introduction
This chapter is divided into three parts. First part is about the background and motivation of this research. As the current technology has changed rapidly, the new technology, Financial Technology, has spread and disrupted many industries’ industrial structure. It is important for the companies to find out a way to deal with this disruptive technology. This study has found that there are less academic research about the development and the future trends of Financial Technology, and the patents that can protect companies’ innovative techniques is becoming more and more important to the companies, so this study uses patent data to explore Fintech’s current development and future trends. Second part talks about this research’s purpose and research questions, and the last part is the brief outline of this research.
1.1 Background Information and Research Motivation
Nowadays, the industrial environment has changed rapidly, and so has the development of modern technology. Many new kinds of technologies has been applied to the companies to disrupt the industrial structure, just like the new rise of Fintech, which changes the structure and gives a new shape of the finance industry.
Financial technology, also known as Fintech, is an industry composed of many companies, including both startups and established companies, utilizing new technology and innovation in order to compete in the marketplace of traditional
financial institutions and intermediaries in the delivery of financial services (Lin, 2o16). There is no consensus on the definition of "FinTech"; a review of definitions published in 2016 synthesized the various scholarly definitions published over more than the past forty years as "a new financial industry that applies technology to improve financial activities” (Schueffel, 2017).
Field of financial technology has already become one of the main targets of the investment around the world. According to Accenture’s 2014 report, global investment
in fintech has skyrocketed from under $930 million in 2008 to over $2.9 billion by the
beginning of 2015(Conway & Masood & Skan, 2017).
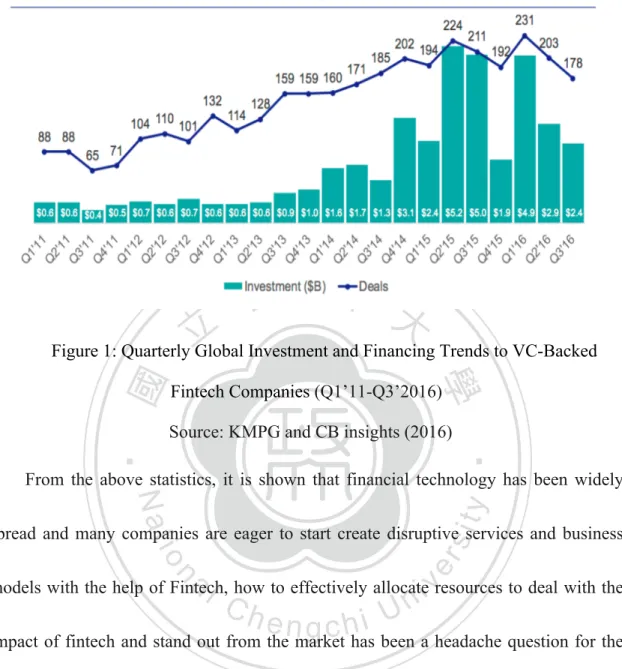
From the capital funding’s point of view, Figure 1 below shows that many VC-backed Fintech companies got many financial supports from many investors, such as angel investors, angel groups, private equity firms, mutual funds, hedge funds, venture capital, etc. What’s more, the statistics reached the highest peak during 2015 and the first quarter of 2016 in the investment and the deals. Although in the second and third quarter of 2016, the statistics start to drop down due to investors’ concerns about market uncertainty. This trend suggests that despite the drop in VC funding, Fintech still remains a strong focus for the broader investment community (Fortnum & Hughes & Pollari & Speier & Mead, 2016).
Figure 1: Quarterly Global Investment and Financing Trends to VC-Backed Fintech Companies (Q1’11-Q3’2016)
Source: KMPG and CB insights (2016)
From the above statistics, it is shown that financial technology has been widely spread and many companies are eager to start create disruptive services and business models with the help of Fintech, how to effectively allocate resources to deal with the impact of fintech and stand out from the market has been a headache question for the companies.
Since the rise of financial technology has gotten many companies’ attention, many companies start to continuously come up with new innovative services or even research and develop new techniques in order to increase their own competitive advantages, because the field of financial technology is a highly competitive industry that companies compete with innovative techniques. Only through the continuous
innovation and expansion of techniques or technologies can the companies continue to grow in the market.
However, it is hard for the companies to accurately assess what technologies will be the future trend of financial technology. Besides, it will be a difficulty for the companies to establish innovative R&D projects or complete investment strategies without fully understanding the trends of the financial technology. Therefore, it is essential to understand financial technology’s developments and trends before the companies start to set their feet on the Fintech soil.
Now that understanding the development and trend of financial technology is quite of importance, how do the companies get a picture of Fintech’s trends? Except for getting from the latest information from the news, magazines, and the books, the companies can even obtain the developments and trends of Fintech from the patent information and analysis. According to Word Intellectual Property Organization (WIPO) in 1988, if R&D personnel can make good use of patent information, they can research and development more effectively by reducing 60% of the R&D time, and 40% of the R&D budget, showing how important patent information is. What’s more, patent analysis can provide useful information of industries and technologies for companies to evaluate whether to invest, cooperate with others or research and develop by themselves. Thus, patent analysis is a useful tool to analyze technological trends and
developments for the companies to make investment or R&D decisions.
From the previous research papers or academic research, there had many researches about forecasting technological trends. Some papers combined patent analysis and technology life cycle analysis, and some other papers used text mining techniques to analyze technological trends. However, over the past research about financial technology, there have a little research for the overall development and emerging trends of financial technology. Hence, this study hopes that from the technical viewpoint, through patent analysis and text mining techniques to analyze Fintech’s current and future trends and serve as a basis for a study of Fintech.
1.2 Purposes and Questions
Many companies know Fintech is important, but they don’t know how to start with it. If they have a clue of main trends and even the future trends of Fintech, it is much easier for them to make decisions. As a result, the main focus of this study is about technological trend analysis, making companies a lot easier to set up a strategy.
Nowadays about 80% of the information around the globe is stored in terms (Breakthrough Analysis, 2008), and since 1980, the development of text mining is benefit from this. The main purpose of text mining is to explore implicit knowledge from the unstructured data. Since the patent data contains a lot of unstructured information that might imply the potential technological trends, this study analyzes
Fintech’s patent data by using text mining and Chance Discovery techniques.
This study focuses on finding the relevance of vocabularies and these vocabularies’ implied future trends, and Chance Discovery can discover the potential future characteristics or phenomena. Chance Discovery’s visualized tool KeyGraph, which is not only the most frequently used algorithm, but can visualize the relevance between the terms to get the insight about current and future development.
Therefore, the main purpose of this research is based on Fintech’s patent data, using qualitative theory and combing text mining and Chance Discovery techniques to explore the relation and analyze the meanings of the terms, so as to understand the trend of each time and the future development of potential financial technology planning opportunities. Here below are the main issue and question to be discussed:
1. Main issue: From patent texts to discover current technological trends and potential opportunities of Fintech’s future development.
2. Main question: What are current trends and potential opportunities of Fintech?
1.3 Thesis Outline
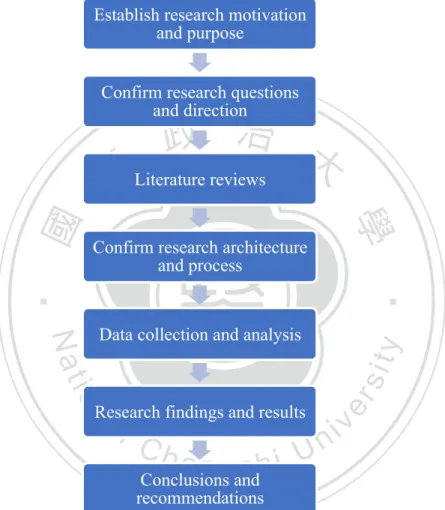
This paper uses the key terms that are related to Financial Technology, or Fintech, to search for the relevant patent data from the integrated patent database as the research scope of this study. The research strategy can be divided into seven steps: first, establish the research motivation and purpose; second, confirm the research questions
and direction; third, literature reviews; fourth, confirmation of research architecture and process; fifth, relevant data collection and analysis; sixth, use Chance Discovery and visual tool KeyGraph to propose results; seventh, conclusions and recommendations. The research strategy flow chart is shown in Figure 2.
Figure 2: Research Strategy Flow Chart of this study Source: Drawn by this study
Establish research motivation and purpose
Confirm research questions and direction
Literature reviews
Confirm research architecture and process
Data collection and analysis
Research findings and results
Conclusions and recommendations
Chapter 2 Literature Review
This chapter is divided into four sections. First section is about the definition and the concept of Fintech, and describes the academic research regarding to the application of text mining in analyzing Fintech or trend of Fintech. Second section is the literature review of patent analysis, which talks about the usage of patent information and the different ways of combining patent analysis and technological trend analysis. Third section is about the academic review of text mining, and the last part shows the definition of Chance Discovery and its application in many fields.
2.1 Overview of Fintech
This part introduces two points. One is about what is Fintech and summarize the academic definition of Fintech in recent years. Due to modern technologies are fast-changing, many new innovative technologies emerge on after another, including Fintech, it is important to get the insight of trend in advance, and there are more and more academic researches about field of Fintech. Thus, the second part’s literature review is centered on the research analysis of Fintech’s trend, which is the main research object of this study.
2.1.1 Definition
since. Customers had gradually lost faith in financial institutions, such as banks. Traditional financial institutions’ development and services changed so slowly that they couldn’t meet the changing needs of customers. What’s more, the inefficiency, poor services, and the imperfection of personal privacy protection of the traditional financial institutions all caused the startups or other technological companies to have a chance to come up with a new model of financial services and technology to stand out from the market, and all the reasons above have become the nutrition for Fintech‘s seed to start to sprout.
The term Fintech had already be used in the research of Bettinger in 1972, the vice president of Manufacturers Hanover Trust, and he provided the following definition “Fintech is an acronym which stands for financial technology, combing bank expertise with modern management science techniques and the computer” (Prabook, 2016). Another early adoption can be dated back to the early 1990s, a project named ‘Financial Services Technology Consortium’, initiated by Citigroup to facilitate technological cooperation (Arner et al., 2015). However, the definition of Fintech wasn’t until the recent years that it became clearer in academic researches.
Since 2013, there comes a lot clearer and more detailed definitions of Fintech, which are summarized in Table 1 below. Some definitions are broader, such as Fintech being a different way to conduct financial activities (Xie & Zou, 2013), or making
financial systems and financial services more efficient by means of technology (Wharton Fintech, 2014; Krabec, & Venegas, 2016). Other definitions focus on Fintech’s significant impact on the business, financial markets, and daily lives, like disrupting traditional business models in business and bringing about new risk on the market (Loncarski, 2016), facilitating payments for goods and services through daily lives, and providing the important infrastructure to the operation of the world’s financial institutions (Langley, 2014). Still others mentioned the sectors that Fintech contains, including payments, financial data and analysis, financial software, digitized process, and wider public payment platforms (Barberis, 2014).
From the definition of Fintech, there covers a lot of different field of financial services, like payment, financial data analysis, public platform, …etc. Many relevant literatures have been proposed and extensively discussed. Some literatures discussed about crowdfunding (Groshoff, David and Urien, Kurtis, and Nguyen, Alex, 2014), another literatures talked about new technology like blockchain (Walch, 2015), and still other literatures researches about Fintech platforms (Dhar & Stein, 2016), …etc.
Table 1: The Summary of the Definition of Fintech by Scholars
Scholars Definition
Bettinger (1972)
“Fintech is an acronym, which stands for financial technology, combing bank expertise with modern management science techniques and the computer.”
Xie & Zou (2013)
“Beside indirect financing via commercial banks and direct financing through security markets, a third way to conduct financial activities will emerge, which we call ‘internet finance’.”
Barberis (2014)
“Fintech refers to the application of technology within the financial industry. The sector covers a wide range of activities from payments (e.g. Contactless) to financial data and analysis (e.g. Credit scoring), financial software (e.g. risk management), digitized processes (e.g. authentication) and, perhaps most well-known to the wider public, payment platforms (e.g. P2P lending).”
Wharton Fintech (2014)
“Fin Tech noun: an economic industry composed of companies that use technology to make financial systems more efficient.”
Langley (2014)
“Technology applied to financial services (Fintech) has a significant impact on our daily lives, from facilitating payments for goods and services to providing the infrastructure essential to the operation of the world’s financial institutions. ”
Micu & Micu (2016)
“Financial Technology, also known as FinTech, is a new sector in the finance industry that incorporates the whole plethora of technology that is used in finance to facilitate trades, corporate business or interaction and services provided to the retail consumer.”
Shim & Shin (2016)
“Fintech is an emerging financial services sector that includes third-party payment, MMF, insurance, products, risk management, authentication, and peer-to-peer (P2P) lending.”
Maier (2016)
“Driven by technological advances, new service models have developed in the financial industry which offer additional opportunities to customers. Under the common denominator ‘fintech’, these new businesses aim to
challenge existing financial institutions by using technology to deliver value to the customer in an alternative way.”
Krabec, & Venegas (2016)
“Fintech is an economic industry composed of companies that use technology to make financial services more efficient.”
Loncarski (2016)
“In addition to this, a particular evolution and use of technology (commonly referred these days as fintech) in finance is disrupting traditional business models in financial markets, as well as bringing about new and uncharted risk territories.”
Xie, Zou, & Lou (2016)
“Internet Finance is a spectral concept. It covers all forms of financial transactions and financial intermediaries and markets, such as commercial banks, securities firms, insurance companies, and stock exchanges, to the scenario under Walrasian equilibrium (where neither financial intermediaries nor markets exist) caused by the impacts of internet technologies.” And “We think internet finance and Fintech are essentially different terms for the same concept.”
Jun & Yeo (2016)
“Recent advances in information and communications technology (ICT) have led to the rapid development and expansion of new and innovative financial services, often termed Fintech.”
Kim, Park, & Chi (2016)
“Fintech is a service sector which uses mobile-centered IT technology to enhance the efficiency of the financial system. As a tern, it is a compound of ‘finance’ and ‘technology’, and collectively refers to industrial changes forged from the convergence of financial services and IT. ”
2.1.2 Fintech Trend Analysis
Based on the rapid change and disruption of innovative Fintech, there gradually have many literatures that research about the trend of Fintech. From the recent research literatures of Fintech, there have some papers that research about the trend of stock price, products’ trend, mobile payment, security, mobile devices, and digital trends in the asset management industry.
In 2016, there proposed a new method to forecast stock price trend by social network, text mining and machines learning analysis, which shows while using different financial resources to investment will have different effects, the accuracy of forecasting still can be improved by deep learning method (Day & Lee, 2016).
In addition to forecasting investment factors, there also has a paper forecasting the vacant mobile payment technology of Fintech by patent analysis to find out the key technology trend of mobile payment (Kim & Shim, 2016), and has another paper proposing a new method to identify the future trends of products by means of social media analysis, and big data analysis to analyze the social media communication of startups to capture the latest development or potential opportunities of products (Hauke & Leker, 2016).
In the early 2017, there have some papers uses text mining techniques to analyze the trends of Fintech’s development in home country (Li & Dai & Park & Em. et al.,
2017), or trends of mobile devices’ security (Seo, JH. & Park, EM., 2017), or even uses network analysis to analyze the asset management and financial robo advisory services (Boldrini & Giorgino, 2017).
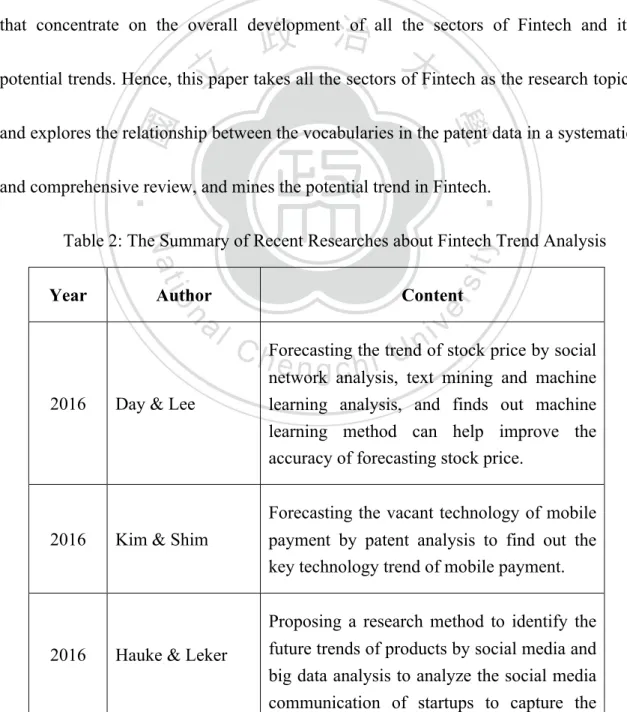
This study has summarized the above research into Table 2 below. In summary, many researches of Fintech trend analysis mostly focus on the specific technology or financial services in Fintech to analyze the trend pattern, while there has a few papers that concentrate on the overall development of all the sectors of Fintech and its potential trends. Hence, this paper takes all the sectors of Fintech as the research topic, and explores the relationship between the vocabularies in the patent data in a systematic and comprehensive review, and mines the potential trend in Fintech.
Table 2: The Summary of Recent Researches about Fintech Trend Analysis
Year Author Content
2016 Day & Lee
Forecasting the trend of stock price by social network analysis, text mining and machine learning analysis, and finds out machine learning method can help improve the accuracy of forecasting stock price.
2016 Kim & Shim
Forecasting the vacant technology of mobile payment by patent analysis to find out the key technology trend of mobile payment.
2016 Hauke & Leker
Proposing a research method to identify the future trends of products by social media and big data analysis to analyze the social media
latest development or potential opportunities of products.
2017 Li & Dai & Park & EM. et al.
Using text-mining techniques to analyze the trends of the development of Fintech in the home country.
2017 Seo, JH. & Park, EM.
Using text-mining techniques to analyze the trends of mobile devices’ security.
2017 Boldrini &
Giorgino
Using network analysis to analyze the asset management and financial advisory services through robo technology.
Source:Summarized by this study
2.2 Patent Analysis for Trends
Intellectual property rights, especially patents, are the vital rights protection derived from research and development. In other terms, patent rights are the most useful tools to protect your innovative technologies. Besides, through patent analysis, the corporate can understand the development and the trend of this technology.
2.2.1 Value of Patent Information and Analysis
The patent specification is the source of the patent information, and the general patent specification contains the text of the patent bibliographic and the patent specification. The patent bibliographic information includes Title, Abstract, Patent Number, Issue Date, Application Number/Date, Inventor, Assignee, Agent, International Patent Classification (IPC), the United States Patent Classification (UPC),
which the US Patent and Trademark Office (USPTO) also provides the specific State/County, Foreign references, Other references, such as journals, …etc, Primary Examiner, Assistant Examiner, and so on.
The text of the patent specification is a detailed description and comprised of the background, purpose, efficacy, illustrations and claims. The purpose and efficacy is to describe the summary of the invention and highlight its benefits. The illustrations are used to clearly illustrate the features of the invention to make the readers quickly understand the contents, and the claims is a description of this invention’s scope of the patent specification, a basis of determining the infringement and the size of the exclusive rights.
According to the World Intellectual Property Organization (WIPO) survey, 90 to 95% of the annual world’s inventions can be found in the patent specification, while other technical literatures only record 5 to10%. WIPO also points out that if the patent information could be made good use of, the time of R&D could be shortened around 60% and the research funding could be save up to 40%. As a result, it is extremely important and indispensable to read and analyze the patent specification and obtain the valuable technical information. Otherwise, a lot of latest technical information and precious business value intelligence will be missed.
into more useful patent information. It is an effective tool not only for R&D planning and intellectual properties management, but also as a basis for technical competition analysis, technical trend analysis, and scope determination (Hall, 1986).
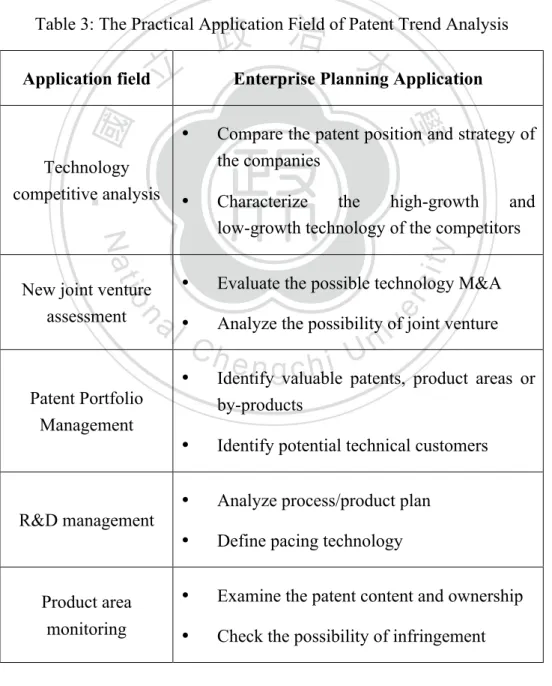
Ashton and Sen (1988) also states that patent analysis can understand the technical trend and the competitors’ position in the patent market and lists five primary application field, as Table 3 below.
Table 3: The Practical Application Field of Patent Trend Analysis
Application field Enterprise Planning Application
Technology competitive analysis
• Compare the patent position and strategy of the companies
• Characterize the high-growth and
low-growth technology of the competitors New joint venture
assessment
• Evaluate the possible technology M&A • Analyze the possibility of joint venture
Patent Portfolio Management
• Identify valuable patents, product areas or by-products
• Identify potential technical customers
R&D management • Analyze process/product plan • Define pacing technology Product area
monitoring
• Examine the patent content and ownership • Check the possibility of infringement Source:Ashton, and Sen, (1988)
Moreover, Mogee (1991) thinks the patent analysis should have the following four applications of value:
(一)、 Rival Analysis
In the patent specification, there will have many patent classification number. Different national patent database will have different classifications, and each patent classification number of letters represents a technical classification. Thus, as long as familiar with patent classification number, you can use patent analysis to find the competing same kind of inventions’ patent application status, which can know the patent application status and the numbers of patents of competitors.
(二)、 Technology Tracking Forecasting
Lock the scope of specific technology, and you can determine whether the technologies are mature or not, have prospects for development, or encounter the bottleneck by the number of patents and investors. Consequently, managers can understand the technical development of the industry to determine whether to invest.
(三)、 Identifying Important Developments
If this patent is the most critical and important core technology, it will be cited by all the relevant inventors, which identifies the important developments.
(四)、 International Strategic Analysis
the specific company, because the patent is based on the territorial principle, which can assess the company’s international strategy.
From Hall (1986), Ashton and Sen (1988), and Mogee (1991), and many other scholars all have clearly pointed out the patent analysis can bring value to the enterprise, and is beneficial to the strategy development, research and development, intellectual properties management and trend identification.
2.2.2 Patent Trend Analysis
Patent analysis has been applied to many different fields, and analyzed a variety of topics with different research method. Some research papers analyzed certain industry or technology to provide suggestions of patent portfolios and R&D strategies respectively (Wu et al, 2015). Other researches used patent analysis to provide the technology matching method, or investment projects’ evaluations (Altuntas & Dereli,
2014). In addition, many other researches discussed industrial development and technology trend by patent analysis (Yoon & Park, 2003).
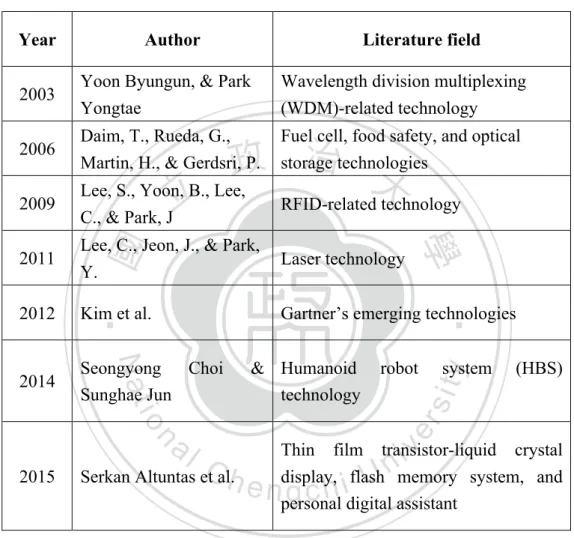
Patent analysis has been applied in different fields. Some apply to analyze the trend of certain technologies (Choi & Jun, 2014), and others apply patent analysis to discover emerging technologies (S. Altuntas et al, 2015), which are summarized in Table 4 below.
be hidden within the texts, and only a few researches analyze Fintech patent, this study chooses to use Fintech patent data as data subject to analyze the hidden and potential trend of Fintech.
Table 4: The Summarized Literature Applications of Patent Trend Analysis
Year Author Literature field
2003 Yoon Byungun, & Park Yongtae
Wavelength division multiplexing (WDM)-related technology 2006 Daim, T., Rueda, G.,
Martin, H., & Gerdsri, P.
Fuel cell, food safety, and optical storage technologies
2009 Lee, S., Yoon, B., Lee,
C., & Park, J RFID-related technology 2011 Lee, C., Jeon, J., & Park,
Y. Laser technology
2012 Kim et al. Gartner’s emerging technologies
2014 Seongyong Choi & Sunghae Jun
Humanoid robot system (HBS) technology
2015 Serkan Altuntas et al.
Thin film transistor-liquid crystal display, flash memory system, and personal digital assistant
Source:Summarized by this study
2.3 Text Mining
This section contains about two parts. First part talks about the basic definitions and related research areas of text mining, and the other part reviews the literatures that combine text mining analysis and patent analysis to analyze the trends.
In the past times, the transmission of terms let the later generations understand the past incidents and the intelligence of the ancestors. Right now we are in the era of information explosion, the access and transmission of the information become much easier and generate a lot of data. If we can analyze the large amount of data with some techniques to mine the hidden information or message behind the terms, we can apply this knowledge to organize new information as a reference for future research or industry reference source (Feldman & Dagan, 1995).
2.3.1Definition and Related Research Areas
Text mining, also known as text data mining or knowledge discovery from textual databases (Feldman & Dagan, 1995), refers to the process of extracting meaningful, non-trivial patterns or knowledge from a set of unstructured texts. It may be considered an extension of data mining or knowledge discovery from databases (Fayyad et al., 1996).
According to Hotho, Nuernberger & Paaß (2005), there can have different definition of text mining regarding to the related research areas as follows:
1. Text Mining = Information Extraction. This approach assumes that text mining essentially corresponds to information extraction, namely, the extraction of facts from texts.
2. Text Mining = Text Data Mining. Text mining can also be defined as applying algorithms and methods to the fields of machine learning and statistics to texts so as to find useful patterns, which is similar to data mining. For this purpose it is necessary to pre-process the texts accordingly. To extract data from texts, many authors use techniques like information extraction methods, natural language processing or some simple preprocessing steps, and then apply data mining algorithms to do the deeper analyses.
3. Text Mining= Knowledge Discovery in Database Process. Following the knowledge discovery process model, we frequently find in literature text mining as a process with a series of partial steps, which summarizes in a general manner as the extraction of not yet discovered information in large collections of texts.
Since this study using text mining techniques as definition of text data mining, based on Fayyad’s Knowledge Discovery in Database (KDD) Process (Fayyad et al., 1996) suggest, text data mining typically involves five steps: (1) data selection, (2) data cleaning, (3) data transformation, (4) data mining, and (5) results evaluation and interpretation. The study herein followed the notion of the KDD process to conduct text- mining analysis.
2.3.2Text-Mining-Based Patent Trend Analysis
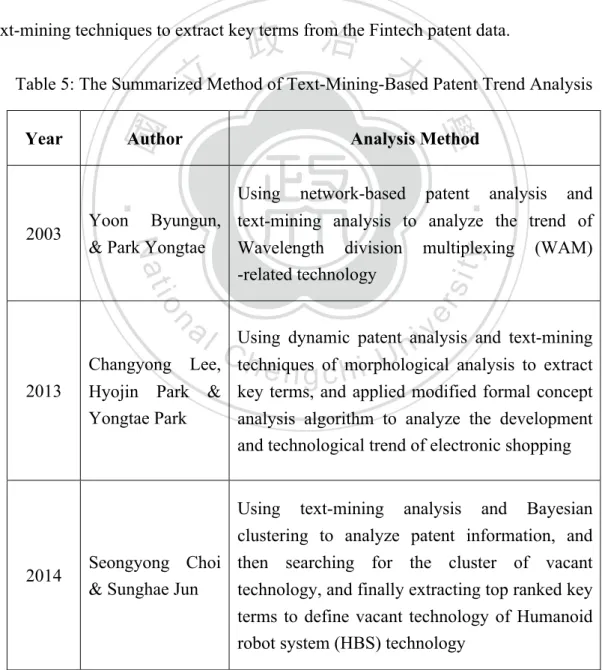
There are many different techniques that combine statistical algorithms to analyze patent technological trend and development, like technology life cycle. There are also some papers using text-mining-based patent analysis to find out the hidden trends of certain technologies or development, which summarized in Table 5 below. Since patent data is proper to be analyzed by text mining techniques, this study will also use text-mining techniques to extract key terms from the Fintech patent data.
Table 5: The Summarized Method of Text-Mining-Based Patent Trend Analysis
Year Author Analysis Method
2003 Yoon Byungun,
& Park Yongtae
Using network-based patent analysis and text-mining analysis to analyze the trend of Wavelength division multiplexing (WAM) -related technology
2013
Changyong Lee, Hyojin Park & Yongtae Park
Using dynamic patent analysis and text-mining techniques of morphological analysis to extract key terms, and applied modified formal concept analysis algorithm to analyze the development and technological trend of electronic shopping
2014 Seongyong Choi
& Sunghae Jun
Using text-mining analysis and Bayesian clustering to analyze patent information, and then searching for the cluster of vacant technology, and finally extracting top ranked key terms to define vacant technology of Humanoid robot system (HBS) technology
2.4 Chance Discovery
This section talks about the definition of Chance Discovery, and describes the related industrial and academic researches about Chance Discovery.
2.4.1 Definition
Chance Discovery is proposed by Ohsawa and other scholars. It explores the hidden opportunity, and explains its implications, especially when the chances are rare and easily ignored (Ohsawa, 2002). Besides, Chance Discovery is to discover the chances rather than accidently come across the chances.
The chances that Chance Discovery discovers can be explained as a neglected incident with great influence on the decision-making and the future (Ohsawa & Fukuda, 2002). In other terms, this ignored incident could be the chances or the risks.
In short, Chance Discovery mostly discovery the future characteristics or phenomena that are hidden, and the characteristics and phenomena are so-called chances, which implies chances or risks. Chance Discovery is also a useful qualitative analysis and it can even visualize the data to let readers easily understand the hidden situation or trends (Hong, 2009).
At present, the most widely used visualization tool of Chance Discovery is KeyGraph, which was proposed by Ohsawa, Benson and Yachida (1998). KeyGraph can be used to analyze large amount of data, and extracts the high-frequent terms and
clusters. KeyGraph can also discover the key term that has high association with other terms but with low frequency. After extractions and association matching, KeyGraph can visualize the results, making readers understand the correlations within the terms.
2.4.2 Related Works of Chance Discovery
The applications of Chance Discovery is very extensive and diverse, including from the early application of predicting earthquake in 2002 (Ohsawa, 2002b), applications of information security by Koo and Cho (2005), exploring DVD industry in 2009(Hong, 2009), discovering research topics of e-commerce in 2013(Chen, et, al., 2013), learning topics of online learning in 2016 with KeyGraph (Li & Wong, 2016), applying to the wireless sensor networks of smart cities to detect unknown attacks (Wu & Ota & Dong & Li, 2016), and designing innovative tour package in 2017 (Sun & Hong & Kuo & Iqbal, 2017), which is summarized in Table 6.
In 2013, Chen et al. collected relevant data from the primary journals and professional books of E-commerce and used Chance Discovery and KeyGraph to present the important research topics that are hidden in the field of E-commerce (Chen et al., 2013). Another similar application is to explore hidden patterns and linkages among students’ learning toward lecture topics from the online learning environment with the help of KeyGraph (Li & Wong, 2016).
KeyGraph to detect the unknown attacks of wireless sensor networks (WSN) in smart cities (Wu, Ota, Dong and Li, 2016). What’s more, there has even applying KeyGraph to business method patents to identify technological chance in product-service system (PSS) (Lee, Kim, Park & Kim, 2016). Thus, as a result of KeyGraph being widely used and able to explore the hidden trends by text-mining techniques, this study applies KeyGraph to discover the potential trends of Fintech patents.
Table 6: The Summarized Literature Applications of Chance Discovery
Year Author Literature field
2002b Ohsawa Earthquake prediction
2005 Koo & Cho Information Security
2009 Hong DVD industry of Taiwan
2013 Chen et al. Research topics of E-commerce
2016 Li & Wong Leaning topic of online learning
environment
2016 J. Wu, & K. Ota, & M. Dong & C. L
Unknown attacks detection of wireless sensor networks in smart cities
2016 Lee, Kim, Park & Kim
Identification of technological change in PSS through business method patents
2017 Sun, Hong, Kuo, &
Iqbal Tourism industry of northern Taiwan
Chapter 3 Research Methodology
This chapter is divided into two sections. The first section introduces the research method of this study, including the overview of this study, the introduction of N-gram and visualization tool KeyGraph algorithm. The second section is this study’s research process, divided into three stages: data collection, keyword capture and the visualization analysis of the results.
3.1 Research Method
3.1.1 Overview
In this study, various national patent data were collected as collection objects. As the content of patent information is comprehensive, the study utilizes a lexical extraction program to extract key terms from the patent data, and apply Chance Discovery tool KeyGraph (Ohsawa et al., 1998) to explore the interrelationships and the characteristics between the terms. By using KeyGraph, this study visualized the graph of Fintech’s related patent application to see the differences of different time of application, technology field, and the direction of trends. This study also designs a KeyGraph algorithm program to analyze the trend of patent data.
3.1.2 N-gram
Lexicon extraction program extracts the text string from the columns of patent data, which are Title, Abstract, and Claims in the N-gram mode (Manning & Schuetze, 1999),
cutting all the vocabularies in n text strings as a term. Due to important information usually hidden in the noun phrases, it is much important to extract noun phrases rather than a single vocabulary because a single vocabulary will be too general to be recognized its meaning. As a consequence, this study applies N-gram to extract the vocabulary group, comprised of zero or an adjective followed by one or more nouns.
Take financial information technology as an example. What N-gram extracts the text type is financial information, information technology, and financial information technology. In order to confirm the result’s accuracy and adequacy, it needs to be viewed manually. Moreover, there are two researchers with finance backgrounds were invited to check the way of examinations. With a view to make sure they understand the definition of text selection and selection rules of the study, they needed to be educated and trained first, so that they could confirm the correctness of the extractions and the combinations in the right way. In the end, after they finished the confirmations, they had been rewarded to increase the incentives of their willingness for helping improve the creditability of the study.
3.1.3 KeyGraph
(一)、 Introduction
KeyGraph algorithm is the most widely used tool to visualize data of Chance Discovery, which is proposed by Ohsawa et al. in 1998. KeyGraph is an algorithm
using data visualization tools to gain insight into the future, especially when a rare event co-occurs in the high-frequent clusters (Ohsawa, 2002a).
KeyGraph can analyze the collected documents, find out the terms with high frequency from the file, and understand the relationship between the word clusters having high correlations and the other terms that isn’t high frequent but have key influence within the word clusters. Finally, the results are converted into visualized graphics. The terms that although they are with low frequency, they have a vital influence on the word clusters are called key terms with potential opportunity (Hong, 2009), which is the main object of this research.
The visualized graphics that KeyGraph generated will appear three kinds of nodes and the two types of lines that connected the nodes, just as shown in Figure 3 below. The three nodes are the solid black points, representing high-frequent terms, hollow points, meaning important vocabulary with low frequency, and double circle nodes, representative of key terms. The lines between the connected nodes represent the correlations between the two vocabularies, inclusive of the solid lines and dashed lines. The solid lines refer to the relevance of two terms in the cluster, while the dashed lines means that the terms have slight relations, which is called Weak Tie (Chen et al., 2013). In addition, there has no meaningful meaning about the size of the nodes and the length of the two lines.
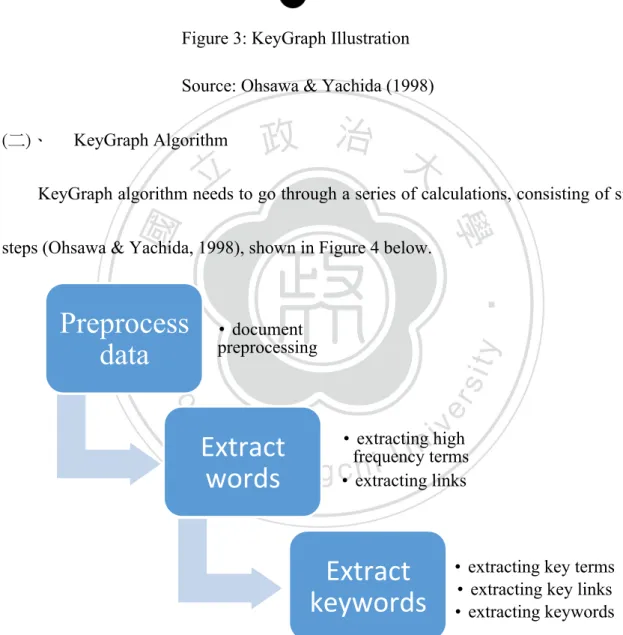
Figure 3: KeyGraph Illustration Source: Ohsawa & Yachida (1998) (二)、 KeyGraph Algorithm
KeyGraph algorithm needs to go through a series of calculations, consisting of six steps (Ohsawa & Yachida, 1998), shown in Figure 4 below.
Figure 4: KeyGraph Calculation Process Source: Organized by this study
First of all, document preprocessing mainly contains data cleansing and the
Preprocess
data
preprocessing • documentExtract
words
• extracting high frequency terms • extracting linksExtract
keywords
• extracting key terms • extracting key links • extracting keywords
integration of terms and phrases. Then, the second step is according to the number of times that the terms appear, extracting and mining data through KeyGraph to capture the terms that appear relatively high, and gather all the high-frequent vocabularies together, denoted by Nh as the vocabularies with high frequency.
The third step of extracting links is to use the formula (1) to calculate the co-occurrence between the high-frequent terms, which can obtain the degree of lexicon relevance. After finishing the calculations based on equation (1), the values will be sorted. The two terms having high correlations will have a link.
𝑎𝑠𝑠𝑐𝑜 𝑤
!, 𝑤
!=
𝑚𝑖𝑛 𝑤
! !, 𝑤
! ! !∈!1
Where wi and wj are the ith and the jth terms in Nh, s means sentence and D refers to documents. assoco(wi, wj) calculates all the relevance of lexicons in Nh, and 𝑤! !, 𝑤! ! represents the number of times that wi and wj appear in the same sentence.
After knowing the degree of correlation between the terms, the fourth step is to extract the key terms to explore the important terms and phrases hidden in the data, in other terms, extract the terms and phrases that have low frequency but are the potential vocabularies. Utilizing the equation (2) to proceed the fourth step, mainly to calculate the weight of all the terms in the data and the high frequent terms Nh (Ohsawa, 1998). The higher the wights are, the more likely that the terms can be the key terms, denoted
by Kht as the potential key terms. Key (w) in equation (2) denotes the co-occurrence between all the terms and high-frequent terms Nh.
𝑘𝑒𝑦 𝑤 = 1 −
1 −
𝑏𝑎𝑠𝑒𝑑 𝑤, 𝑔
𝑛𝑒𝑖𝑔ℎ𝑏𝑜𝑟𝑠 𝑔
!⊂!2
𝑏𝑎𝑠𝑒𝑑 𝑤, 𝑔 =
𝑤
! !∈!𝑔 − 𝑤
!(3)
𝑛𝑒𝑖𝑔ℎ𝑏𝑜𝑟𝑠 𝑔 =
𝑤
! !∈! !∈!𝑔 − 𝑤
!(4)
where 𝑔 − 𝑤
!=
𝑔
!− 𝑤
!,
𝑖𝑓 𝑤 ∈ 𝑔
𝑔 ,
𝑖𝑓 𝑤 ∉ 𝑔
Among the equations, w is all the terms in the document, g is the terms that belong to G cluster, 𝑔 ! is the number of times appear in the sentence s. Keyword Kht has the
characteristics of lower frequency than Nh, which is added to the cluster G after the step fourth.
The fifth step of extracting key links is calculated through the weight of formula (2) and the formula (1) to explore the association of the high-frequent terms Nh and the key terms Kht. At this time, wi and wj in formula (1) are the ith term in Nh and the jth term in
Kht respectively. The links that connect the two word clusters are the key links. The final step is to extract the key terms. On a basis of the key links that are calculated by formula (1), sort those key links and set up a threshold. Those who fit the threshold are
the potential key terms inside the documents.
In summary, the patent data that uses Chance Discovery to analyze through the preprocessing procedure, including extracting the meaningful terms and combining the synonym into one meaningful term, to convert the sentences into the collections of lexicons. Then applying KeyGraph algorithm to explore the potential opportunities step by step can not only understand the relation between the high-frequent terms from the large scale of patent data, but also can find out the key terms with great potential and observe the relationship between the key terms and high-frequent terms. In the end, the result of the output is presented in a visualized terms’ relationship graph, creating the link between the high-frequent terms and the co-occurring terms.
This research hopes to explore the financial technology’s development and future potential trends by applying KeyGraph to search for the interrelations between terms with high frequency, key terms, and the key terms, and visualize these text-type data, making readers easy to understand the correlations between the terms.
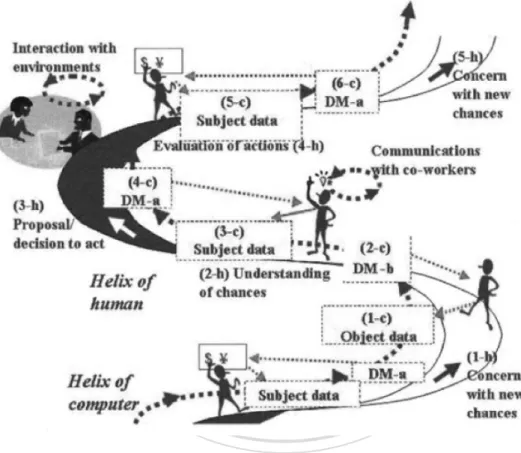
(三)、 Double-Helical Model
In addition to use KeyGraph to demonstrate the relevance of the terms, there also needs to use Double-Helical Model, shown in Figure 5 below, to assist the data analysis section. Ohsawa and McBurney proposed this model theory in 2002 to apply to the data
analysis of Chance Discovery. In the double helical, one is operated manually, the other one is implemented by the computer, that is, first the operator inputs the data or threshold, and then let the computer execute the results. After the execution is complete, the operator checks the result, and then go on to the next analysis. At last, the best result can be gained through this continuous interaction between human and computer.
Figure 5: Double-Helical Model Source: Ohsawa & McBurney (2003)
3.2 Research Process
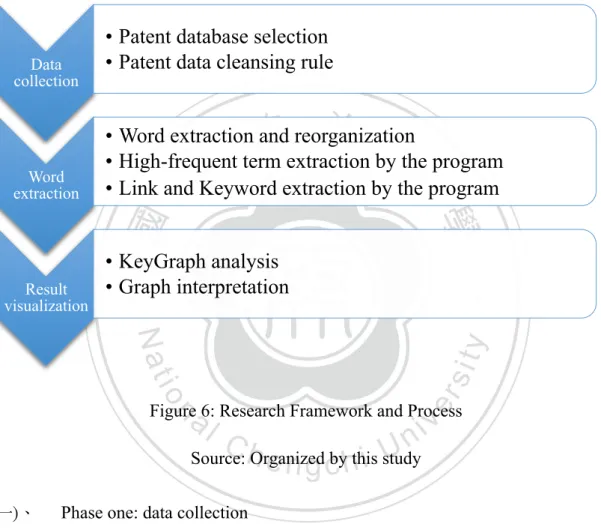
This study’s research framework and process is shown as Figure 6. For the following research process, it can be divided into three phases: data collection, word extraction and result visualization.
Figure 6: Research Framework and Process Source: Organized by this study (一)、 Phase one: data collection
This study is based on the analysis of the published patent data, and the use of patent database is Patent Integration software, which includes many countries’ patent information, such as America, Europe, British, France, Germany, Taiwan, China, Japan, Korea, Mexico, Switzerland, and even WIPO organization, and it is useful for searching for the related Fintech fields as many as possible. This research finds that many
Data collection
• Patent database selection
• Patent data cleansing rule
Word extraction
• Word extraction and reorganization
• High-frequent term extraction by the program
• Link and Keyword extraction by the program
Result visualization
• KeyGraph analysis
• Graph interpretation
previous relevant studies of patent analysis mostly used United States Patent and Trademark Office (USPTO) (Wu et al., 2015; Tsai, Huang & Yang, 2016) to search for the patent. However, Patent Integration software integrates not only the patent data from USPTO, but also other countries’ patent data, which increases the scope and the width of the study. Moreover, it demonstrates every patent’s status that can help control the data quality much easier. Therefore, this study chooses Patent Integration software to collect the patent from the database of America, Europe, British, France, Germany, Taiwan, China, Japan, Korea, Mexico, Switzerland, and WIPO, and the collected data for the study updates till May 4th, 2017.
Based on the main purpose of this research is to outline the overall development and the future trends of Fintech, the key terms that are used to search for the patent are the definition and the synonym of Fintech, namely, uses these three terms, Fintech, finance technology, and financial technology to search for the patent. The reason is that Fintech field is constituted of many financial fields like payments, investment, capital raising, deposit and withdrawal, etc., and each field has many different innovative technologies, it will be time-consuming to collect and classify them one field by one field. Besides, the quality of data will also be hard to control.
After the data collection, there sets up five cleansing rules to clean the data. First, the patent status that is withdrawal, expired, or final rejected will be excluded. Second,
the patent having been published for more than 20 years will be excluded, because they might be outdated. Third, owing to the research mainly collecting English patent data, the data that isn’t published in English will be excluded. Fourth, exclude the patent data that is duplicated because the patent can be applied in any country. Fifth, if the text of title, abstract or claims containing irrelevant information about financial technology, this kind of data will be excluded.
In sum, this study uses Patent Integration software to collect a variety of countries’ patent database with high reliability, and set up the data cleansing rules to complete the research’s data collection process, which can also increases the creditability of this study.
(二)、 Phase two: word extraction
This phase extracts the terms from the three columns of patent data, Title, Abstract, and Claim, by the program developed in the Python 2.7 language, and manually classifies each word, which will be useful to explore the trend of Fintech field from the classified lexicons by KeyGraph algorithm. The program has five functions:
1. Calculate and sort the frequency of each word.
2. Generate bi-gram results and calculate and sort the frequency of each result.
4. Create your own adding rule list and calculate and sort the frequency.
5. Run two-word search from adding rule list, and output the frequency and co-occurrence in the same sentences of the results.
Because of the complexity of original terms and phrases, the study combines the terms and their synonym in order to proceed phase three.
(三)、 Phase three: result visualization
Each period calculates frequency and weight through KeyGraph, and analyzes the high frequency and co-occurrence to establish the relationship between the terms, and then uses visualization tool to show the relationship of terms in each period, and finally interprets the correlations of the terms and the implied trends.
From the aspect of graphic interpretation, if the number of term is insufficient, the terms will be presented in an independent state, and it will not fully present this study’s relevance of key terms and future potential trend. On the other hand, if the number of terms is too much, the graph will be much more complicated and a lot harder to interpret. Only through the Double-Helical Model for human-computer interaction to readjust the terms’ frequency and the threshold of co-occurrence can the key terms’ association and trend graph be easy to interpret and analyze.
Chapter 4 Results and Discussions
This chapter has divided into four parts. First part is about the status of final data set after cleansing rules. Second part talks about the process of data analysis. Third part is about the results of the analysis of the second part, and the last part is the discussion of the results.
4.1 Status of Final Data Set
4.1.1 Data Collection and Data Cleansing
The data of this study is collected from the Patent Integration Software, and according to the set up of keyword searching to ensure the quality of the data, this study uses Fintech, finance technology, and financial technology as three searching key terms. The period of data collection is until the latest update of database on May 4th, 2017, and the total amount of data is 3739.
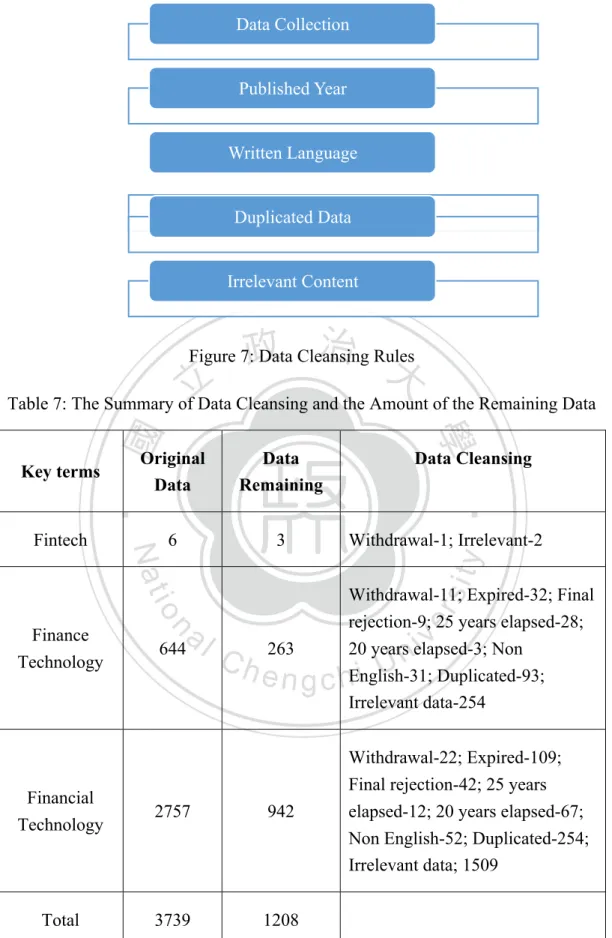
According to the cleansing rule in Figure 7, based on the data status showed on the Patent Integration Software, the data that are withdrawal, expired, or final rejected are excluded, so are the patent that had been published for more than 20 years. What’s more, this study excludes the data that aren’t written in English, because this study mainly researches on English patent data. Finally, in accordance with the title, abstract, and claims of patent data, there has a total of 1208 data left that are relevant to the filed of Fintech for the next part of analysis, which is summarized in Table 7.
Figure 7: Data Cleansing Rules
Table 7: The Summary of Data Cleansing and the Amount of the Remaining Data
Key terms Original
Data
Data Remaining
Data Cleansing
Fintech 6 3 Withdrawal-1; Irrelevant-2
Finance
Technology 644 263
Withdrawal-11; Expired-32; Final rejection-9; 25 years elapsed-28; 20 years elapsed-3; Non
English-31; Duplicated-93; Irrelevant data-254
Financial
Technology 2757 942
Withdrawal-22; Expired-109; Final rejection-42; 25 years elapsed-12; 20 years elapsed-67; Non English-52; Duplicated-254; Irrelevant data; 1509
Total 3739 1208
Source:Organized by this study
Data Collection
Published Year
Written Language
Duplicated Data
4.1.2 Data Integration and Clustering
This study is based on the historical timing of development and the literature that Schueffel conducted Fintech-related research in 2016 to cut the patent data into three periods, namely, the period before 2004, the period from 2005 to 2010, and the period after 2010 (Schueffel, 2016). The published year of collected data was from 1998 to 2017, and it was found that the number of effective data before 2000 was small, so this amount of data would be included in period one. Therefore, the study was divided into three periods. After integrating the data from three key terms and cleansing again the duplicated and irrelevant data, there had 142 data in the period one from 1998 to 2004, 354 data in the period two from 2005 to 2010, and 463 data in the period three from 2011 to 2017, summarized in Table 8.
Table 8: The Summary of Data Clustering
Period Applied Issued Total
1998 to 2004 120 22 142
2005 to 2010 286 68 354
2011 to 2017 322 141 463
Total 728 231 959
4.2 Data Analysis
This section of data analysis follows the six steps of KeyGraph algorithm that had mentioned in chapter 3, shown in Figure 8, to analyze and reorganized the data.
Figure 8: Six Steps of KeyGraph
4.2.1 Step One: Word Preprocess
The data that were downloaded from the Patent Integration Software didn’t have the garbled text, and no need to convert the files, either. As a result, here comes first cleanse the data, and separate the data into three periods. Second, use the program that had mentioned before in chapter 3 to extract the terms. Although the program can help extract the terms in N-gram mode, it will still appear the non-relevant terms or duplicated terms that need to be deleted, or synonyms or text types needing to be combined. This problem is resolved by continuously running the program over and over
Step 1
• Preprocess the word
Step 2
• Extract high-frequent words
Step 3
• Extract links
Step 4
• Calculate the weights and extract the key terms
Step 5